

Key Takeaways:
- SEB SA is a global leader in small domestic equipment and cookware, and it continues to expand across Europe, the Americas, and Asia while leveraging its broad portfolio of consumer and professional brands to defend pricing power and margins.
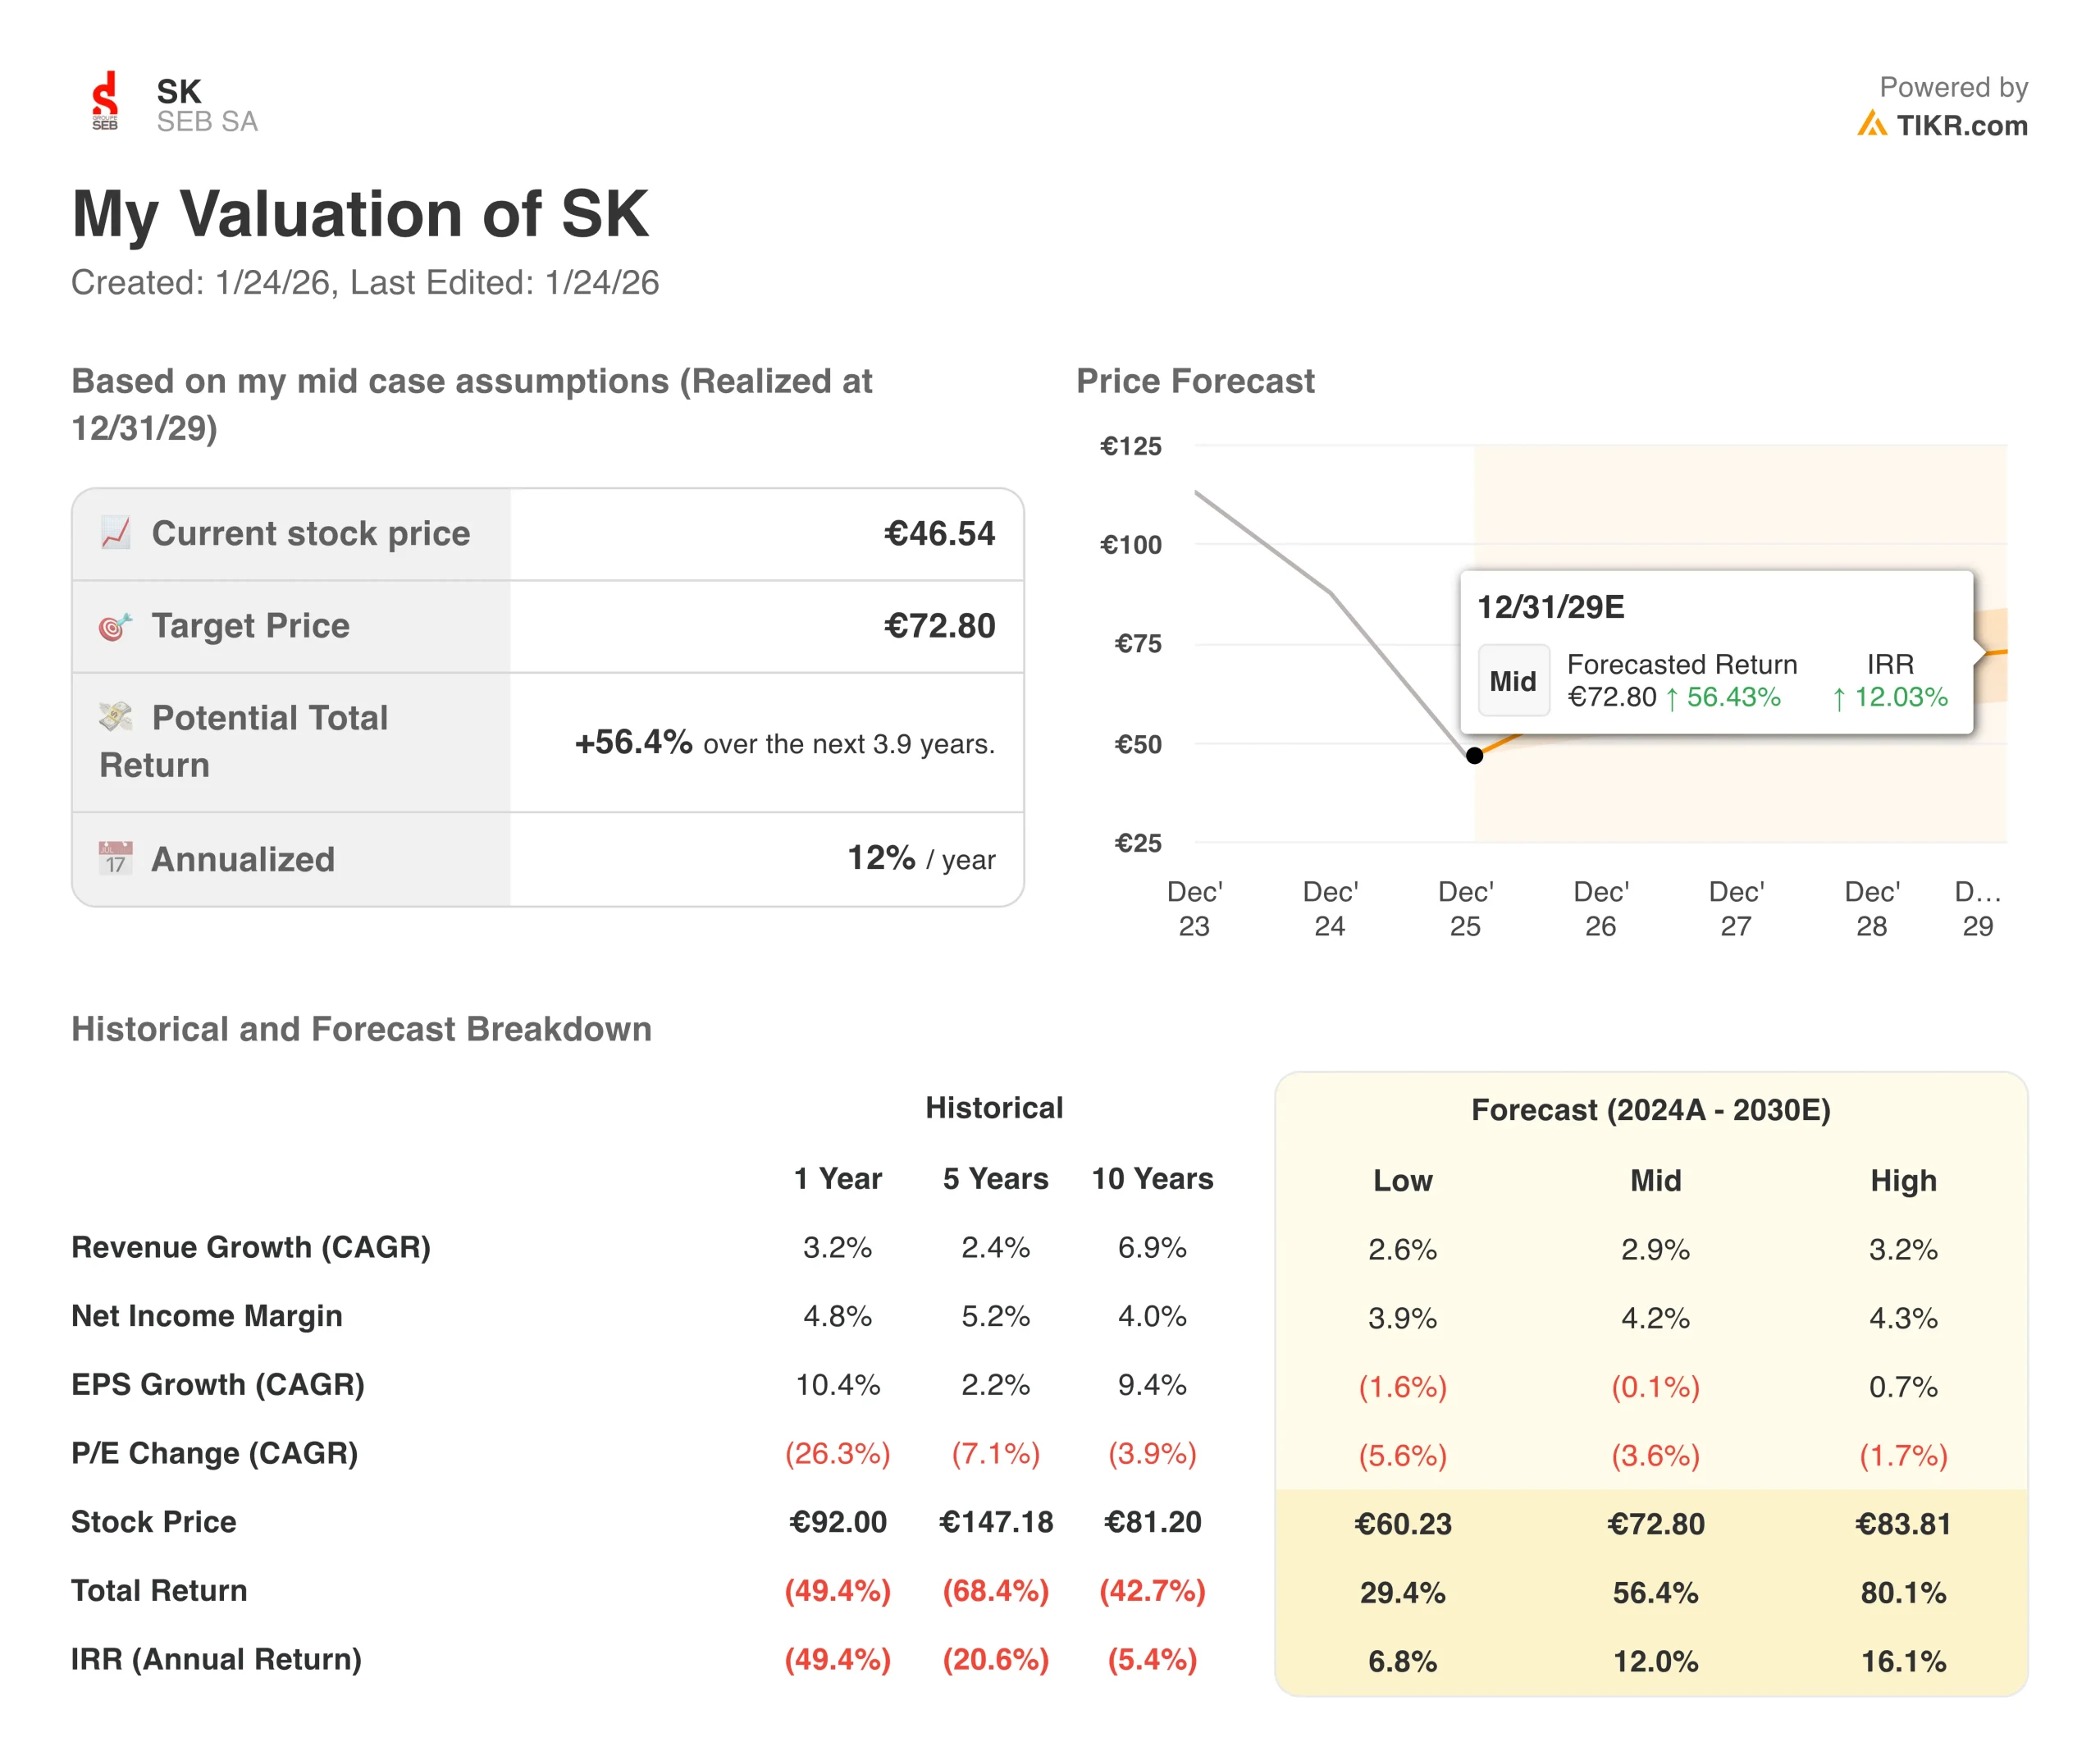
- SK stock could reasonably reach €73 per share by December 2029, based on our valuation assumptions.
- This implies a total return of 56.4% from today’s price of €47, with an annualized return of 12.0% over the next 3.9 years.
SEB SA (SK) manufactures and markets small domestic equipment and cookware under well-known brands such as Tefal, Moulinex, Rowenta, WMF, and others, and serves consumers and professionals across Europe, the Americas, the Middle East, Africa, and Asia.
The company has a long history of innovation in kitchen appliances and cookware, and it continues to invest in product development and geographic expansion to support long-term growth.
SK has faced share price volatility in recent years, but its diversified portfolio, strong brand recognition, and global footprint give it multiple levers to sustain cash generation and margins through cycles.
Here’s why SEB SA stock could provide solid returns through 2029 as it stabilizes growth and margins while the market re-rates the shares closer to historical valuation levels.
What the Model Says for SEB SA Stock
We analyzed the upside potential for SEB SA stock using valuation assumptions that reflect its moderate revenue growth outlook, stable profitability profile, and a slightly lower valuation multiple than its long-term average.
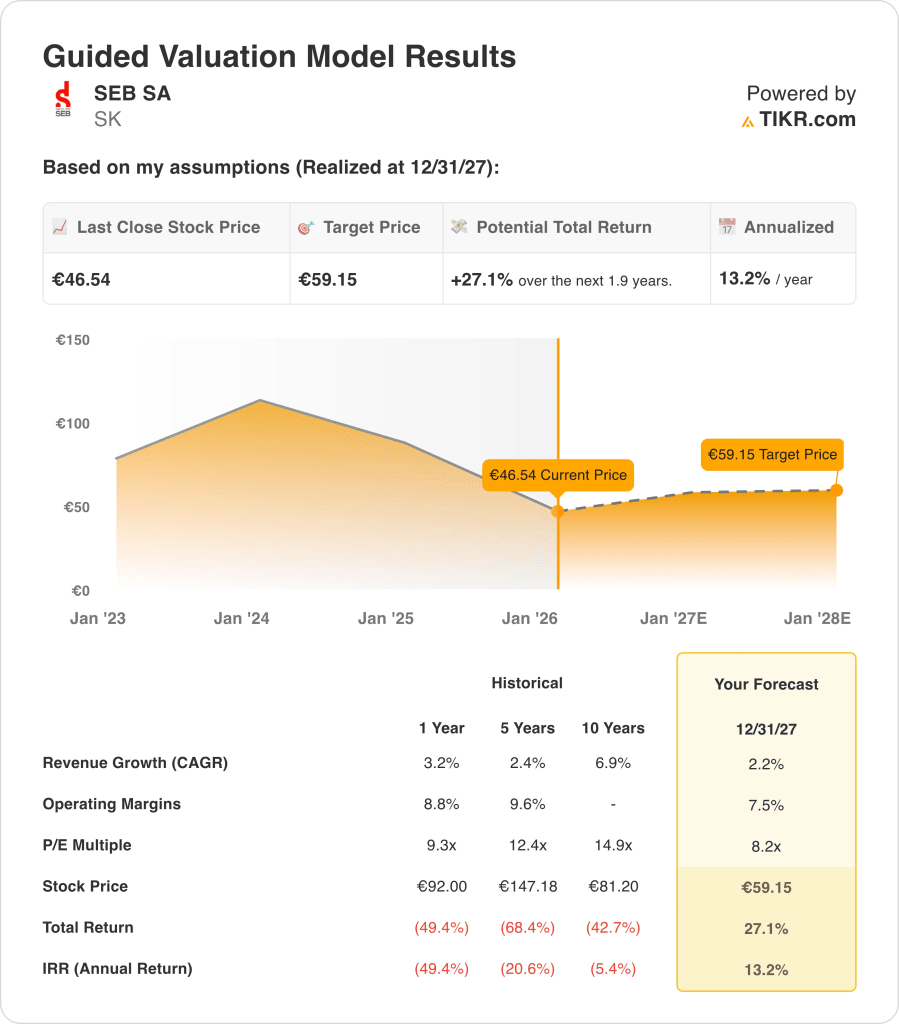
Based on estimates of 2.9% annual revenue growth, 7.5% operating margins, and a normalized P/E multiple of 8.2x, the model projects SEB SA stock could rise from €47 to €59 per share.
That would be a 27.1% total return, or a 13.2% annualized return over the next 2.0 years.
Our Valuation Assumptions
TIKR’s Valuation Model lets you plug in your own assumptions for a company’s revenue growth, operating margins, and P/E multiple, and calculates the stock’s expected returns.
Here’s what we used for SEB SA stock:
1. Revenue Growth: 2.2%
SEB SA’s top line has grown modestly over time, with revenue increasing at a compound annual growth rate of 2.4% over the past five years and 6.9% over the past ten years.
Over the last year, growth slowed to 3.2%, reflecting a more challenging consumer environment and normalization after prior years of elevated demand for home and kitchen products.
Based on analysts’ consensus estimates, we use a 2.9% annual revenue growth forecast, which sits in the middle of the model’s low, mid, and high scenarios and slightly above the recent 5-year CAGR.
This assumption factors in a steady but not aggressive recovery in household spending, gradual price increases supported by SK’s strong brands, and continued geographic diversification.
2. Operating Margins: 7.5%
Historically, SEB SA has delivered operating margins close to high single digits, with the guided valuation showing a 7.5% margin versus 8.8% in the most recent year and 9.6% over the last five years.
Based on analysts’ consensus estimates, we use 7.5% as our operating margin assumption, which is below the 5-year average but in line with the forecast from the guided model.
This reflects a cautious view that SK can maintain solid profitability through cost discipline and scale advantages, though margins may remain slightly below historical peaks as consumer spending normalizes and competition remains intense.
3. Exit P/E Multiple: 8.2x
SEB SA’s stock has traded at an average P/E multiple of 12.4x over the last five years and 14.9x in the previous ten years, but the current valuation is lower after a period of share price weakness and more muted growth expectations.
Based on analysts’ consensus estimates, we maintain an 8.2x exit multiple in our mid-case, acknowledging that investors may continue to demand a margin of safety given cyclical exposure and moderate growth.
However, if SK executes well on cost control, innovation, and geographic expansion, there could be room for some re-rating toward historical averages, which would support the model’s projected double-digit annualized return.
Build your own Valuation Model to value any stock (It’s free!) >>>
What Happens If Things Go Better or Worse?
Different scenarios for SK stock through 2030 show varied outcomes based on revenue growth, margin performance, and how the market values the company (these are estimates, not guaranteed returns):
- Low Case: Revenue grows at 2.6% annually, net income margins reach 3.9%, and the exit P/E multiple remains under pressure → 6.2% annual returns
- Mid Case: Revenue grows at 2.9% annually, net income margins reach 4.2%, and the exit P/E multiple improves modestly → 11.9% annual returns
- High Case: Revenue grows at 3.2% annually, net income margins expand to 4.3%, and the market assigns a higher P/E multiple → 16.9% annual returns
Even in the conservative low case, SK shares show positive expected returns, supported by the company’s diversified brand portfolio, global distribution network, and ability to generate cash through different economic cycles.
However, the mid and high cases illustrate how modest improvements in growth and profitability, combined with a partial recovery in valuation, can significantly enhance shareholder returns.
See what analysts think about SK stock right now (Free with TIKR) >>>
How Much Upside Does SEB Stock Have From Here?
With TIKR’s new Valuation Model tool, you can estimate a stock’s potential share price in under a minute.
All it takes is three simple inputs:
- Revenue Growth
- Operating Margins
- Exit P/E Multiple
If you’re not sure what to enter, TIKR automatically fills in each input using analysts’ consensus estimates, giving you a quick, reliable starting point.
From there, TIKR calculates the potential share price and total returns under Bull, Base, and Bear scenarios so you can quickly see whether a stock looks undervalued or overvalued.
See a stock’s true value in under 60 seconds (Free with TIKR) >>>
Looking for New Opportunities?
- See what stocks billionaire investors are buying so you can follow the smart money.
- Analyze stocks in as little as 5 minutes with TIKR’s all-in-one, easy-to-use platform.
- The more rocks you overturn… the more opportunities you’ll uncover. Search 100K+ global stocks, global top investor holdings, and more with TIKR.
Disclaimer:
Please note that the articles on TIKR are not intended to serve as investment or financial advice from TIKR or our content team, nor are they recommendations to buy or sell any stocks. We create our content based on TIKR Terminal’s investment data and analysts’ estimates. Our analysis might not include recent company news or important updates. TIKR has no position in any stocks mentioned. Thank you for reading, and happy investing!


