
Key Stats for Flutter Stock
- Current Price: $101.20
- TIKR Model Target (Mid): ~$250
- Potential Total Return: ~147%
- Annualized IRR: ~22%/year
- Street Target (Mean): ~$178
- Earnings Reaction: +2.11% (5/6/26)
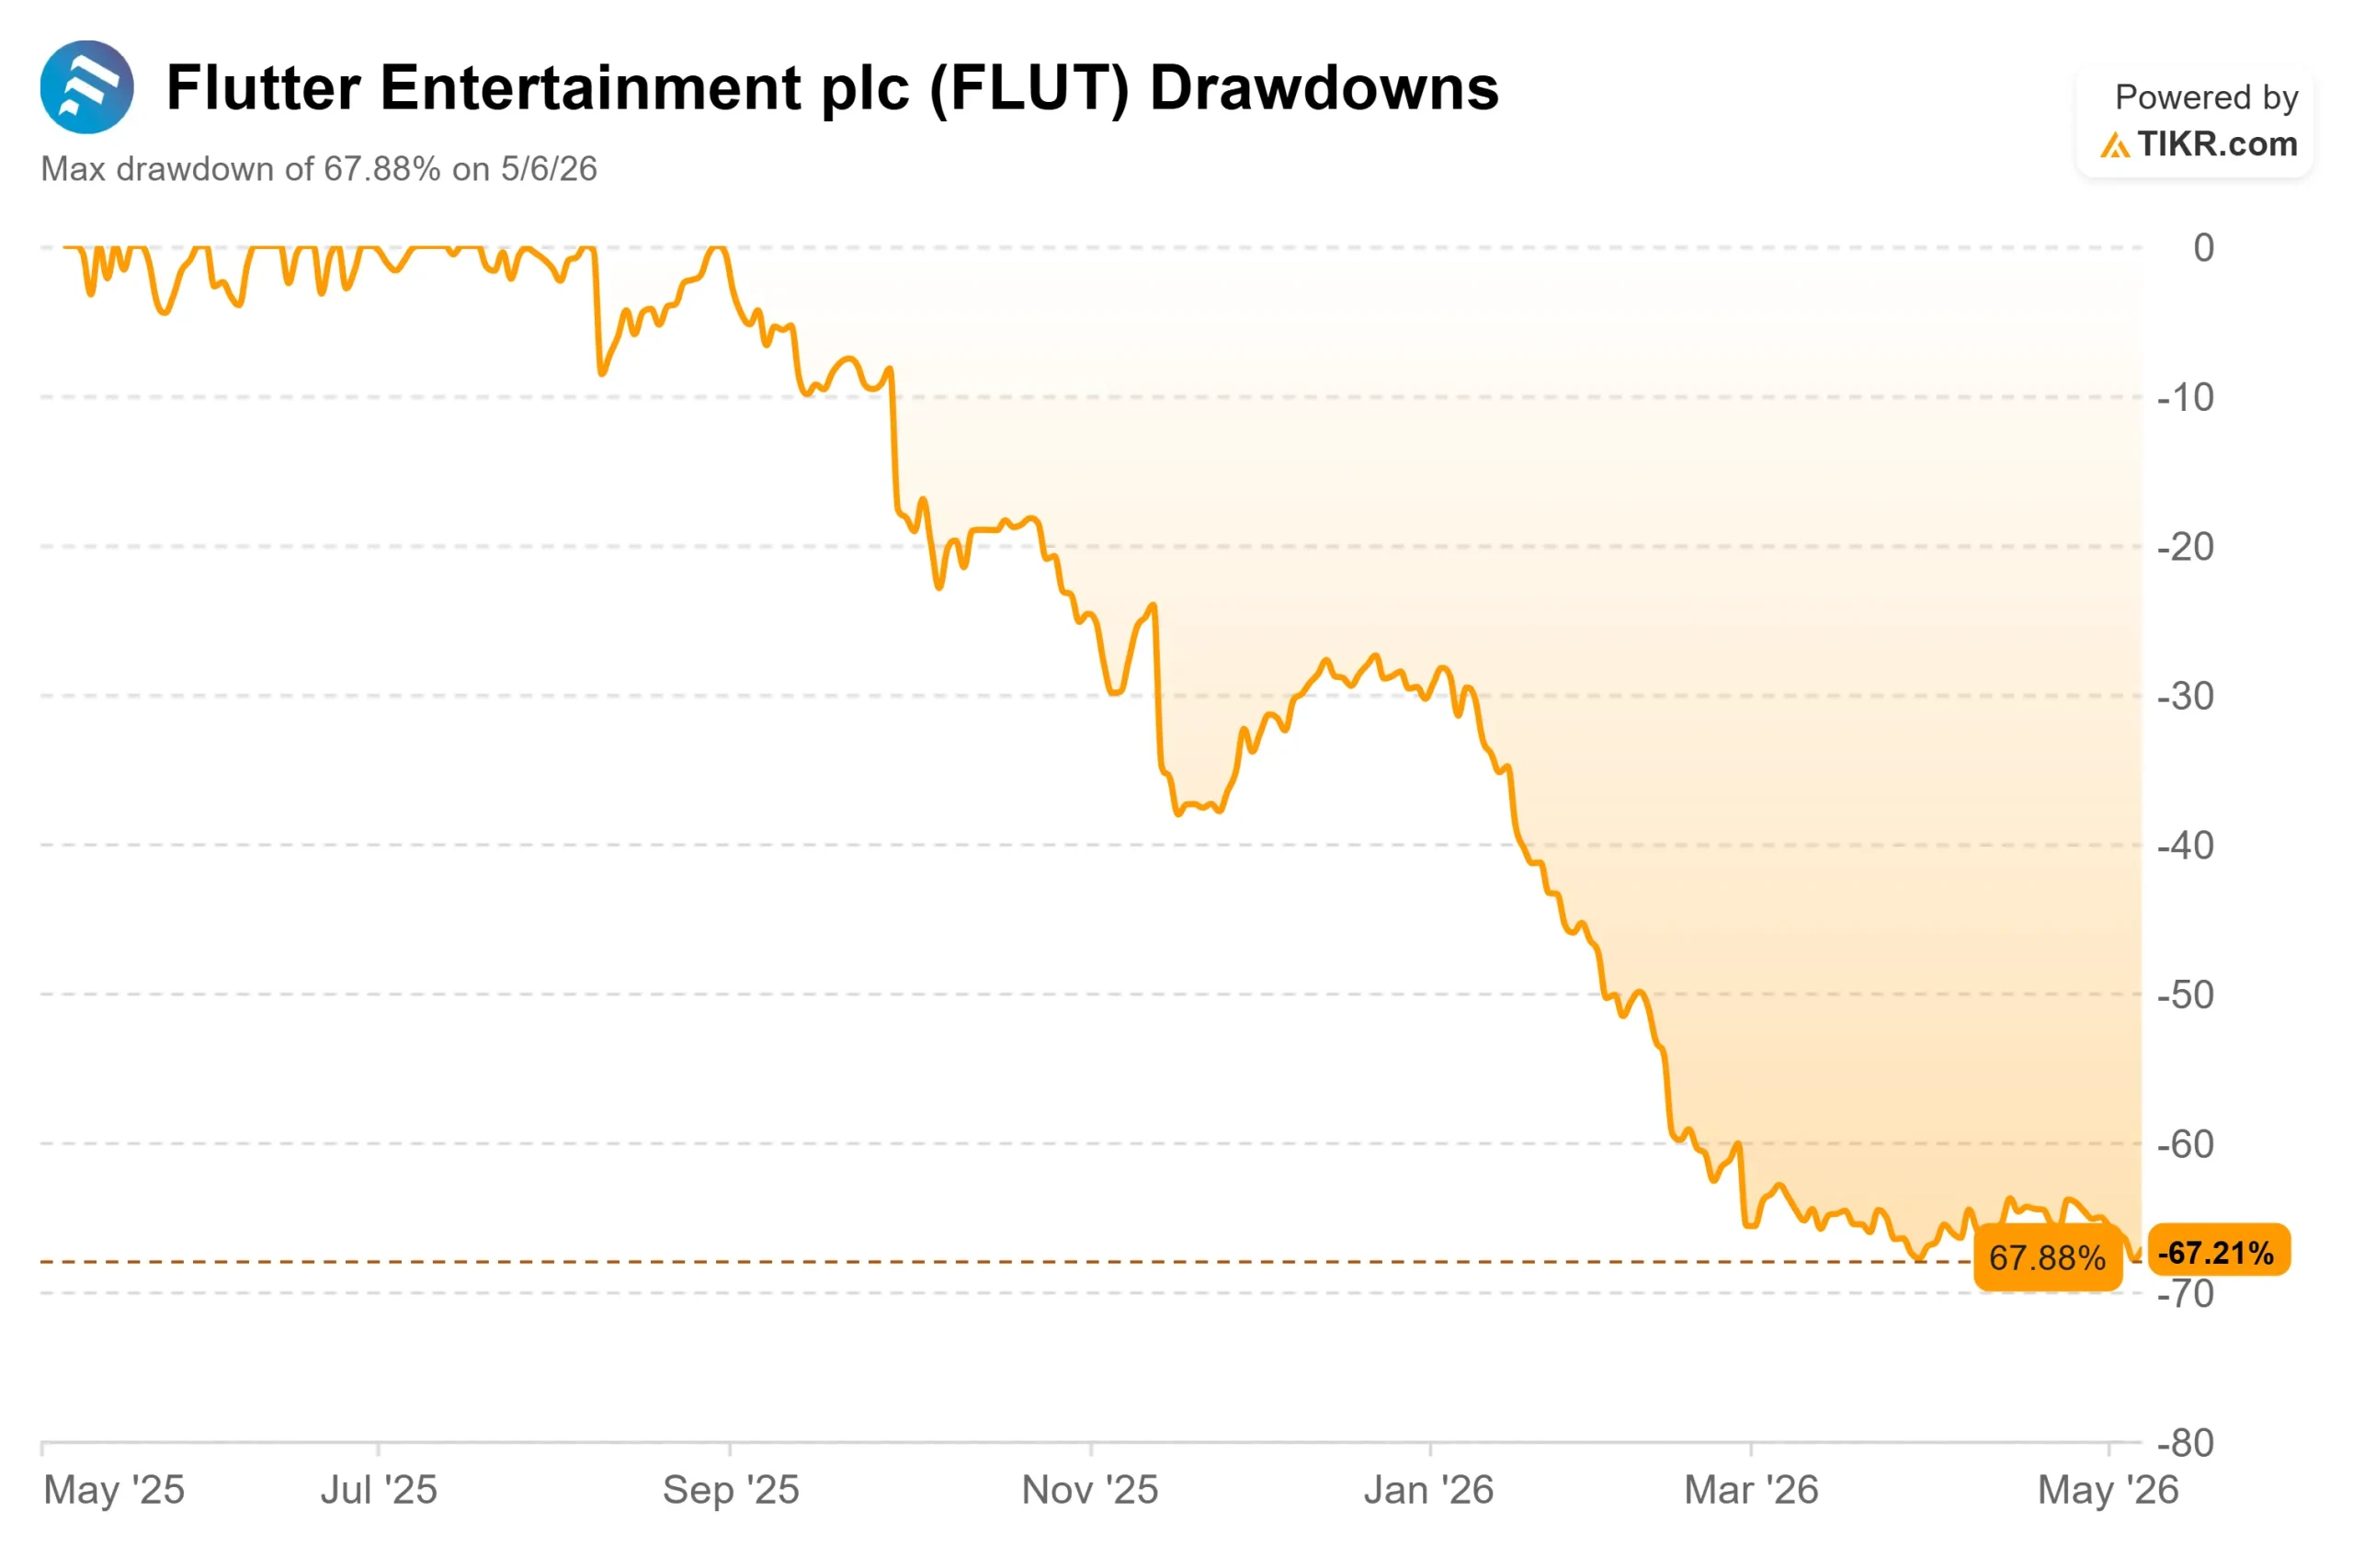
- Max Drawdown: 67.88% (5/6/26)
Now Live: Discover how much upside your favorite stocks could have using TIKR’s new Valuation Model (It’s free) >>>
What Happened?
Flutter Entertainment (FLUT) entered its May 6 Q1 2026 earnings call having already shed nearly 68% from its 52-week high of $313.69. Investors wanted evidence that FanDuel Flutter’s U.S. sportsbook and its largest revenue driver were genuinely turning around. What they got was a complicated package: a real earnings beat, a guidance trim, a CEO departure, and a stock that closed at a new 52-week low of $99.10.
Bulls argue that 17% group revenue growth, 19% U.S. iGaming (online casino) revenue growth, and a forward EV/EBITDA of 9.63x, a steep discount to DraftKings’ 15.21x, make FLUT cheap for the market leader. Bears point to U.S. sportsbook revenue growing only 1%, handle (total dollars wagered) falling 9%, and up to $300 million in annual adjusted EBITDA being burned on a prediction markets platform that generated essentially no revenue in Q1.
The unresolved question: is this a sentiment-driven dislocation, or is FanDuel’s sportsbook structurally weaker than the market believed a year ago?
What Q1 Actually Showed
Flutter reported Q1 2026 revenue of $4,304 million, beating the $4,241.89 million consensus by 1.46%. Adjusted EPS of $1.22 topped the $1.09 estimate by 12.34%. Adjusted EBITDA of $631 million beat the $604.94 million estimate by 4.31%.
Beneath those group numbers, the U.S. segment told a more complicated story. Revenue of $1,763 million grew just 6% year-over-year. U.S. iGaming drove the growth, with revenue up 19% and average monthly players (AMPs, unique customers active in a given month) up 10%. U.S. sportsbook revenue rose only 1%, with AMPs down 6% and handle down 9%. U.S. adjusted EBITDA fell 26% to $119 million, weighed down by the prediction markets investment and the cost of launching in Arkansas.
The most important detail inside those U.S. numbers: the trend was improving as Q1 progressed. AMP declines that measured 5% year-over-year in January had narrowed to 1% growth by March. CFO Rob Coldrake confirmed on the call that early Q2 trading continued that momentum, with positive year-on-year handle trends confirmed for the NBA.
The international segment was the clear bright spot. Revenue of $2,541 million grew 27% year-over-year, driven by the Snai acquisition in Italy and the Betnacional integration in Brazil. Italy, Flutter’s largest international market at $2,532 million in 2025 revenue, is performing exceptionally well. CEO Peter Jackson called it “extremely strong” and noted the Snai platform migration was completed successfully at the end of April, transitioning around 2 million customer accounts. Flutter is also accelerating investment in Brazil ahead of the FIFA World Cup in June.

See historical and forward estimates for Flutter stock (It’s free!) >>>
The Leadership Shakeup
Hours before the Q1 results dropped, CNBC reported that FanDuel CEO Amy Howe was departing after nearly five years. The stock had been trading above its prior close of $103.33 all day. After the news broke, it fell and closed at $99.10, a 4.1% decline to a fresh 52-week low.
Flutter confirmed the departure in its earnings release. FanDuel President Christian Genetski will lead the U.S. business. Daniel Taylor, Flutter’s International CEO, was appointed President of Flutter Entertainment with oversight of FanDuel. Jackson framed the change on the call as a sharpening of focus, not a strategic pivot: “Now is the right time for us to put in place new leadership in the business. I’m excited to see what Christian and Dan can do. There’s no change in our strategy or posture in the business.”
The sportsbook improvement plan already in motion includes a loyalty program now rolling out through Q2 and Q3, Bet Protect+, an industry-first injury insurance feature for bets that is running at double the initial adoption target, and expanded Same Game Parlay (multi-leg bet builder) functionality. These are not new initiatives. They are accelerations of work already underway, now with tighter organizational accountability.
The Prediction Markets Question
No topic generated more analyst questions on the call than FanDuel Predicts, the prediction markets platform Flutter launched in partnership with CME Group in December 2025. The platform generated negligible revenue in Q1 while Flutter spent approximately $40 million building it out. The full-year EBITDA investment is expected to land near the top of the $250 million to $300 million guided range.
The bear case: platforms like Kalshi are drawing recreational bettors away from FanDuel’s sportsbook. Jackson pushed back on the call with data. “We continue to see limited cannibalization impact,” he said, noting that prediction market users skew toward lower-value, entertainment-focused customers who were not sportsbook bettors to begin with.
The more important development from the call: Flutter began market-making on a third-party prediction market exchange in April, applying its proprietary pricing engine to combo (multi-event) contracts and earning revenue from the spread between buy and sell prices. “We’re making money from it already,” Jackson said, adding that Flutter plans to expand market-making across “as many platforms as we can.” The company expects to launch its own market-making platform in the coming months.
This distinction matters for the investment case. A retail prediction platform burning $300 million per year in EBITDA is a long-duration speculative bet. Market-making using Flutter’s existing global pricing infrastructure, the same engine behind FanDuel’s structurally superior gross win margins, is the monetization of a capability the company already has. It is a lower-risk revenue model that sits independent of whether any single retail platform wins the prediction markets race.
See how Flutter performs against its peers in TIKR (It’s free!) >>>
The Valuation Picture
At $101.20, Flutter trades at 9.63x forward EV/EBITDA and 14.76x forward P/E. DraftKings trades at 15.21x forward EV/EBITDA and 20.99x forward P/E. That puts Flutter, the market leader in U.S. online sports betting, with revenue across more than 30 countries, at roughly a 37% valuation multiple discount to its primary U.S. competitor.
That discount is only justified if FanDuel’s sportsbook is structurally broken. The Q1 sequential data does not cleanly support that conclusion. The improving AMP trend through the quarter, positive NBA handle data confirmed for early Q2, and a well-defined H2 catalyst set full loyalty program deployment ahead of the NFL season, lapping a weak H2 2025 NFL prior year, World Cup boost internationally gives the recovery thesis real substance.
Leverage is the main near-term concern. Flutter ended Q1 at 3.7x net debt to adjusted EBITDA, above its medium-term target of 2.0x to 2.5x. Management expects leverage to rise further through Q2 and Q3 before declining in Q4 as second-half profitability improves. Buybacks are active: as of May 1, $190 million of the planned $250 million H1 shareholder return had already been completed.
Flutter also confirmed it is reviewing its secondary London Stock Exchange listing, with an update expected by the end of Q2. The company moved its primary listing to the NYSE in 2024, and the review is widely expected to result in a full London delisting, simplifying Flutter’s capital markets structure further.
TIKR Advanced Model Analysis
- Current Price: $101.20
- TIKR Mid-Case Target: ~$250
- Potential Total Return: ~147%
- Annualized IRR: ~22%/year

See analysts’ growth forecasts and price targets for Flutter stock (It’s free!) >>>
The mid-case model applies a revenue CAGR of around 7% through 12/31/30, with net income margins expanding to around 9%. Two revenue drivers underpin that growth. First, U.S. iGaming: new state legalizations add high-margin revenue that FanDuel can capture immediately, given its existing brand and infrastructure. Second, international scale: Italy is expanding margins through its Sisal-Snai consolidation, and Brazil is accelerating with the World Cup as a near-term catalyst. The margin driver is operating leverage as Flutter’s $300 million international cost efficiency program reaches full run rate by year-end and U.S. generosity spend normalizes.
Free cash flow is forecast to recover from an estimated $1.1 billion in 2026 to approximately $3.1 billion by 2030 as the prediction markets investment rolls off and U.S. margins rebuild.
The upside: sportsbook improvement gains traction through the NFL season, market-making begins contributing revenue, and a 9.63x EV/EBITDA stock with 21 of 26 analysts at Buy or Outperform becomes a re-rating candidate as the data improves.
The downside: the U.S. sportsbook recovery stalls, the NFL season disappoints again, and the prediction markets investment shows no measurable return. In that scenario, a second guidance cut becomes possible, and the current multiple discount deepens.
Conclusion
The metric to watch at Q2 2026 earnings (expected in August) is U.S. sportsbook AMP growth for the full quarter. March showed 1% year-over-year growth. If the full Q2 period confirms positive AMP trends, the H2 setup is intact. If AMPs turn negative again, the back-half recovery thesis is under pressure.
Before Q2 results, Peter Jackson and Rob Coldrake are scheduled for a J.P. Morgan fireside chat on May 11, 2026, which may offer early Q2 color. Flutter’s Annual General Meeting follows on May 29, with the London listing review conclusion expected by the end of June.
Flutter is the world’s leading online sports betting company, now trading at a 37% EV/EBITDA discount to DraftKings, with 21 of 26 analysts still at Buy or Outperform. At $101, the market is pricing in continued failure. Whether that is right gets clearer with every quarterly data point.
See what stocks billionaire investors are buying so you can follow the smart money with TIKR.
Should You Invest in Flutter?
The only way to really know is to look at the numbers yourself. TIKR gives you free access to the same institutional-quality financial data that professional analysts use to answer exactly that question.
Pull up Flutter, and you’ll see years of historical financials, what Wall Street analysts expect for revenue and earnings in the quarters ahead, how valuation multiples have moved over time, and whether price targets are trending up or down.
You can build a free watchlist to track Flutter alongside every other stock on your radar. No credit card required. Just the data you need to decide for yourself.
Analyze Flutter on TIKR Free →
Looking for New Opportunities?
- See what stocks billionaire investors are buying so you can follow the smart money.
- Analyze stocks in as little as 5 minutes with TIKR’s all-in-one, easy-to-use platform.
- The more rocks you overturn… the more opportunities you’ll uncover. Search 100K+ global stocks, global top investor holdings, and more with TIKR.
Disclaimer:
Please note that the articles on TIKR are not intended to serve as investment or financial advice from TIKR or our content team, nor are they recommendations to buy or sell any stocks. We create our content based on TIKR Terminal’s investment data and analysts’ estimates. Our analysis might not include recent company news or important updates. TIKR has no position in any stocks mentioned. Thank you for reading, and happy investing!