
Key Takeaways:
- Strategic Reset: Citigroup stock gained 42% in 2025, reflecting improved investor confidence following leadership changes and stronger deal activity.
- Banking Focus: Citigroup named 4 senior leaders across corporate and investment banking, tightening execution across global advisory and lending operations.
- Return Outlook: Citi’s valuation implies a 7% annualized return through 2028, reflecting steady earnings normalization rather than multiple expansion.
- Upside Projection: Citi stock could reach $141, implying 23% total upside from $115, supported by stable margins and mid-single-digit revenue growth.
Citigroup Inc. (C) is a global financial institution serving consumers, corporations, and governments across 5 core segments, providing diversified revenue exposure.
Last week, Citigroup announced leadership changes across corporate and investment banking to sharpen competitiveness and expand cross-business coordination.
Citigroup also extended its securities services footprint through a Citi-powered lending platform partnership with OCBC, supporting institutional asset monetization.
Its operational momentum improved as Citigroup beat fourth-quarter profit expectations, reflecting stronger dealmaking and rising corporate client activity.
Despite a 42% gain in 2025, Citigroup stock still reflects debate over execution durability versus global banking peers.
What the Model Says for C Stock
We valued Citigroup using stable services income, improving banking execution, and disciplined capital returns in a normalized banking environment.
Based on 4.9% revenue growth, 40.7% operating margins, and a 9.6x exit multiple, the model reflects measured earnings durability.
That implies a $140.73 target price, representing a 22.6% total return, or a 7.2% annualized return.

Our Valuation Assumptions
TIKR’s Valuation Model lets you plug in your own assumptions for a company’s revenue growth, operating margins, and P/E multiple, and calculates the stock’s expected returns.
Here’s what we used for C stock:
1. Revenue Growth: 4.9%
C stock generated steady revenue expansion historically, with 5% one-year growth, reflecting diversified exposure across services, markets, and banking cycles.
Revenue growth slowed below 3% over five years as global banking normalized and consumer credit conditions tightened.
Corporate banking hires, dealmaking recovery, and securities services partnerships support growth, while macro uncertainty and regulation limit upside.
According to consensus analyst estimates, 4.9% revenue growth reflects institutional momentum offset by mature banking markets.
2. Operating Margins: 40.7%
Citigroup stock’s operating margins reached about 34% recently, reflecting scale benefits from services and markets during periods of elevated capital markets activity.
Margins expanded above 40% over five years as restructuring efforts, cost exits, and business simplification improved efficiency across international operations.
Future margin stability depends on sustaining deal flow, disciplined expense control, and avoiding margin dilution from slower consumer banking growth.
In line with analyst consensus projections, operating margins near 40.7% reflect normalized efficiency gains balanced against cyclical volatility in investment banking revenues.
3. Exit P/E Multiple: 9.6x
Citigroup has historically traded at earnings multiples between roughly 9x and 11x, reflecting its global scale, regulatory burden, and cyclical earnings profile.
Despite improved execution and leadership changes, investor caution persists due to earnings volatility and lower returns versus U.S. banking peers.
Valuation support requires consistent profitability, capital return visibility, and sustained corporate banking momentum without balance sheet stress.
Based on street consensus estimates, a 9.6× exit multiple reflects balanced expectations around execution progress, normalized returns, and ongoing structural banking risks.
What Happens If Things Go Better or Worse?
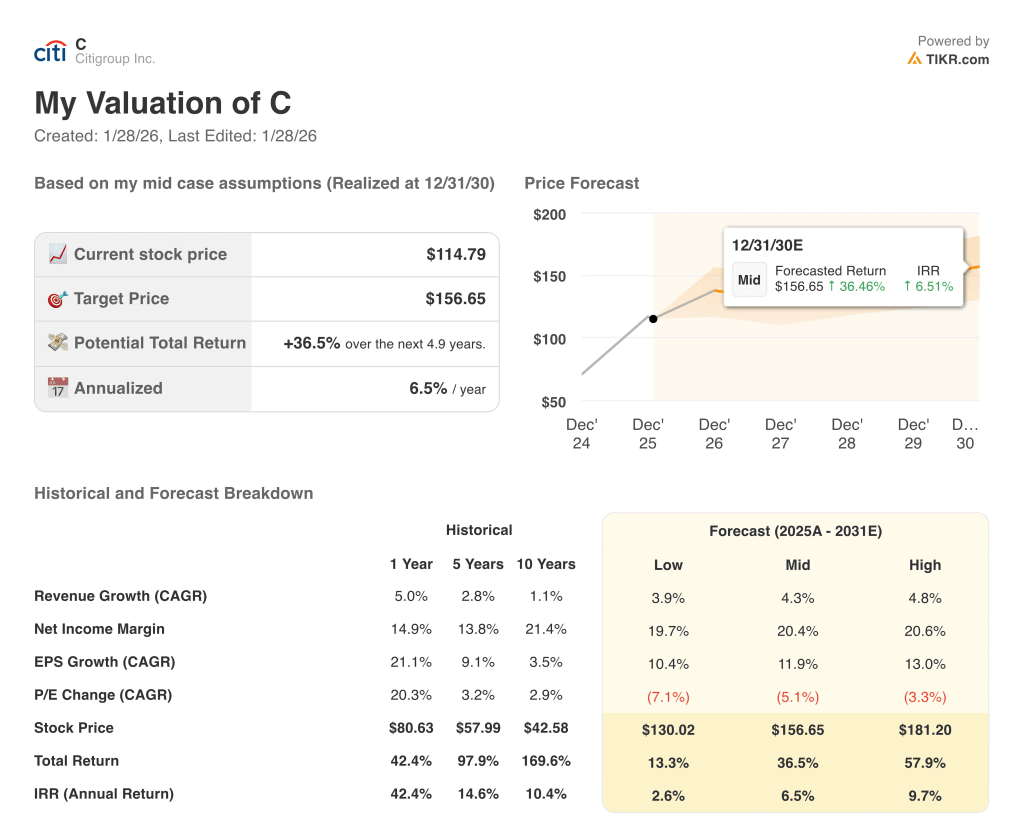
Citigroup stock’s outcomes depend on corporate banking execution, services fee growth, and expense discipline, setting up a range of possible paths through 2030.
- Low Case: If deal activity slows and costs stay elevated, revenue grows around 3.9% and margins hold near 19.7% → 2.6% annualized return.
- Mid Case: With services strength and steadier banking results, revenue growth near 4.3% and margins around 20.4% → 6.5% annualized return.
- High Case: If services scale faster and efficiency improves, revenue reaches about 4.8% and margins approach 20.6% → 9.7% annualized return.
The $157 mid-case target price relies on consistent execution across services and banking, not valuation multiple expansion or market enthusiasm.
How Much Upside Does It Have From Here?
With TIKR’s new Valuation Model tool, you can estimate a stock’s potential share price in under a minute.
All it takes is three simple inputs:
- Revenue Growth
- Operating Margins
- Exit P/E multiple
If you’re not sure what to enter, TIKR automatically fills in each input using analysts’ consensus estimates, giving you a quick, reliable starting point.
From there, TIKR calculates the potential share price and total returns under Bull, Base, and Bear scenarios so you can quickly see whether a stock looks undervalued or overvalued.
See a stock’s true value in under 60 seconds (Free with TIKR) >>>
Looking for New Opportunities?
- See what stocks billionaire investors are buying so you can follow the smart money.
- Analyze stocks in as little as 5 minutes with TIKR’s all-in-one, easy-to-use platform.
- The more rocks you overturn… the more opportunities you’ll uncover. Search 100K+ global stocks, global top investor holdings, and more with TIKR.
Disclaimer:
Please note that the articles on TIKR are not intended to serve as investment or financial advice from TIKR or our content team, nor are they recommendations to buy or sell any stocks. We create our content based on TIKR Terminal’s investment data and analysts’ estimates. Our analysis might not include recent company news or important updates. TIKR has no position in any stocks mentioned. Thank you for reading, and happy investing!