Key Takeaways:
- Earnings Scale: Merck stock generated $64 billion in LTM revenue and $27 billion operating income, reflecting strong oncology-led scale.
- Margin Expansion: Operating margins reached 42% LTM, highlighting profitability gains from mix shift toward higher-margin oncology therapies.
- Earnings Momentum: Q3 net income rose 62% year over year to $6 billion, confirming accelerating profit conversion.
- Strategic Positioning: Merck’s pipeline and partnerships support sustained growth as the company prioritizes oncology and specialty innovation.
Merck (MRK) is a global healthcare company spanning human pharmaceuticals and animal health, generating $64 billion in LTM revenue through diversified therapeutic exposure.
Last week, Merck exited acquisition talks with Revolution Medicines while expanding oncology reach via a multi-year Guardant Health collaboration.
Quarterly revenue reached $17 billion in Q3, rising 4% year over year as oncology demand offset slower mature product growth.
Merck stock generated $27 billion in operating income last year with 42% margins, highlighting strong profitability at a roughly $300 billion market capitalization.
Even as earnings and margins strengthen, Merck’s valuation continues to reflect caution around pipeline durability and post-Keytruda growth visibility.
What the Model Says for MRK Stock
We analyzed Merck stock using strong operating income, disciplined capital returns, and its oncology-led positioning within a mature global pharmaceutical portfolio.
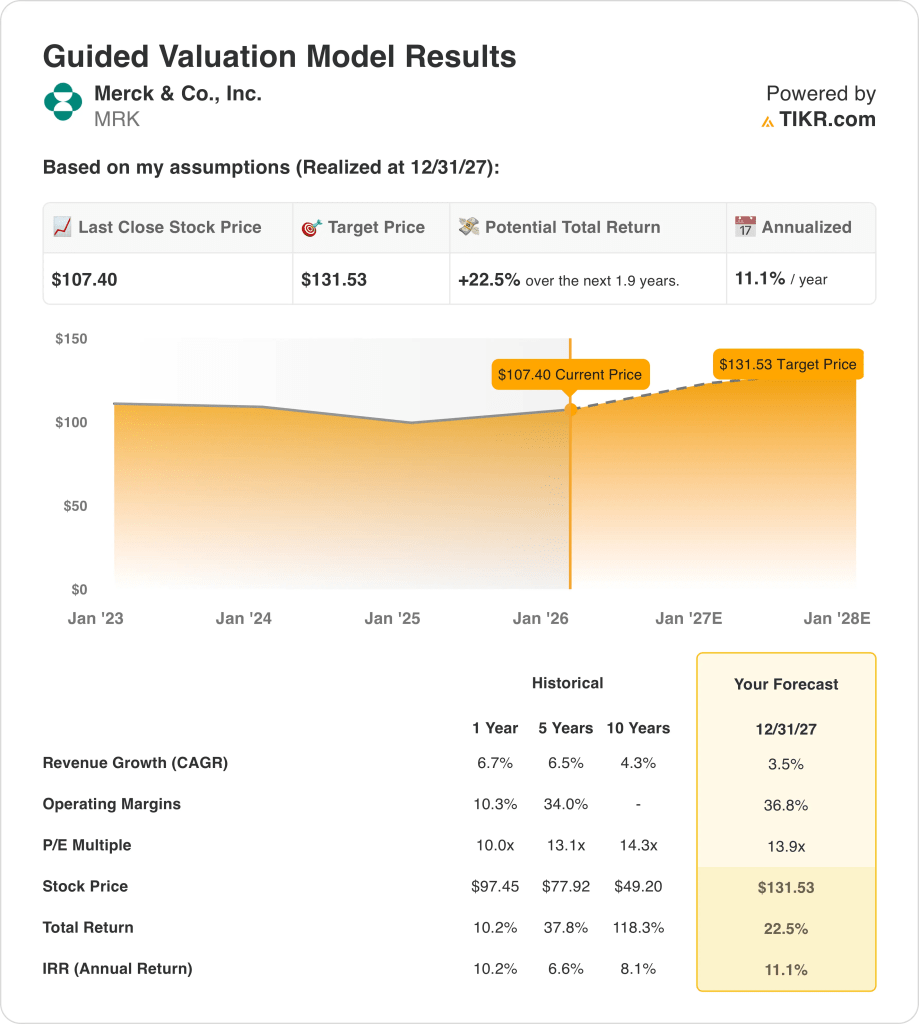
Assuming 3.5% revenue growth, 36.8% operating margins, and a 13.9x exit multiple, the model estimates a $131.53 share value.
This represents a 22.5% total return, or an 11.1% annualized return, over the next 1.9 years.
Our Valuation Assumptions
TIKR’s Valuation Model lets you plug in your own assumptions for a company’s revenue growth, operating margins, and P/E multiple, and calculates the stock’s expected returns.
Here’s what we used for MRK stock:
1. Revenue Growth: 3.5%
Merck stock generated $64 billion in LTM revenue, with historical growth moderating from double-digit expansion toward lower rates as its base scaled.
Recent quarterly revenue reached $17 billion, rising 4% year over year, showing oncology demand offsetting slower mature product sales.
Forward growth depends on oncology portfolio execution and animal health stability, balanced against patent exposure and pricing pressure.
According to consensus analyst estimates, a 3.5% revenue growth assumption reflects durable demand tempered by Merck’s large revenue base and portfolio concentration.
2. Operating Margins: 36.8%
Merck stock delivered $27 billion in operating income last year, with margins expanding from 27% in 2023 to above 42% LTM.
Margin strength reflects oncology mix, controlled SG&A, and R&D normalization following elevated investment cycles.
Sustaining margins depends on continued oncology scale and disciplined spending, with risks from pipeline setbacks and competitive therapies.
In line with analyst consensus projections, operating margins around 36.8% balance normalization from peak levels with structurally higher profitability.
3. Exit P/E Multiple: 13.9x
Merck has historically traded at earnings multiples in the mid-teens during periods of stable growth and strong cash generation.
Current valuation reflects caution around post-Keytruda concentration despite improving earnings visibility and capital return capacity.
Multiple stability depends on sustained oncology execution and reduced pipeline risk, rather than aggressive growth reacceleration.
Based on street consensus estimates, a 13.9× exit multiple reflects balanced expectations for durable cash flows and a 9.8% annual return outlook.
What Happens If Things Go Better or Worse?
Merck’s outcomes depend on oncology demand, pipeline execution, and cost discipline, setting up a range of possible paths through 2029.
- Low Case: If oncology growth slows and pipeline progress lags, revenue grows 2.1% and margins stay near 32.3% → 4.5% annualized return.
- Mid Case: With core oncology performing steadily and spending controlled, revenue grows 2.3% and margins improve toward 34.3% → 9.8% annualized return.
- High Case: If oncology launches scale efficiently and costs stay contained, revenue reaches 2.5% and margins approach 36.0% → 14.7% annualized return.

How Much Upside Does It Have From Here?
With TIKR’s new Valuation Model tool, you can estimate a stock’s potential share price in under a minute.
All it takes is three simple inputs:
- Revenue Growth
- Operating Margins
- Exit P/E multiple
If you’re not sure what to enter, TIKR automatically fills in each input using analysts’ consensus estimates, giving you a quick, reliable starting point.
From there, TIKR calculates the potential share price and total returns under Bull, Base, and Bear scenarios so you can quickly see whether a stock looks undervalued or overvalued.
See a stock’s true value in under 60 seconds (Free with TIKR) >>>
Looking for New Opportunities?
- See what stocks billionaire investors are buying so you can follow the smart money.
- Analyze stocks in as little as 5 minutes with TIKR’s all-in-one, easy-to-use platform.
- The more rocks you overturn… the more opportunities you’ll uncover. Search 100K+ global stocks, global top investor holdings, and more with TIKR.
Disclaimer:
Please note that the articles on TIKR are not intended to serve as investment or financial advice from TIKR or our content team, nor are they recommendations to buy or sell any stocks. We create our content based on TIKR Terminal’s investment data and analysts’ estimates. Our analysis might not include recent company news or important updates. TIKR has no position in any stocks mentioned. Thank you for reading, and happy investing!