Key Takeaways:
- Earnings Scale: Coca-Cola delivered $48 billion LTM revenue with $15 billion operating income, reflecting durable global demand and pricing power.
- Margin Strength: Operating margins reached 32% LTM, showing strong cost control despite slowing revenue growth to 3%.
- Cash Generation: Coca-Cola produced $5 billion quarterly operating cash flow and $5 billion free cash flow, supporting dividends and buybacks.
- Valuation Setup: Trading near 22x forward earnings, Coca-Cola reflects stability while limiting upside without renewed volume growth.
Coca-Cola (KO) is a global beverage leader selling nonalcoholic drinks across more than 200 markets, generating $48 billion in LTM revenue through scale and distribution reach.
In January 2026, Coca-Cola announced a CEO transition and new digital leadership, signaling operational continuity alongside increased focus on data-driven execution.
Coca-cola stock’s revenue rose 4% year over year in the latest quarter to $12 billion, confirming pricing strength amid slower volume growth.
Operating income totaled $15 billion LTM with 32% margins, reflecting efficiency at a $260 billion market value.
Despite strong cash flow and stable leadership, the stock trades at 22x earnings, signaling caution around long-term growth.
What the Model Says for KO Stock
Our valuation links steady operating income growth, cash returns, and Coca-Cola’s defensive global positioning.
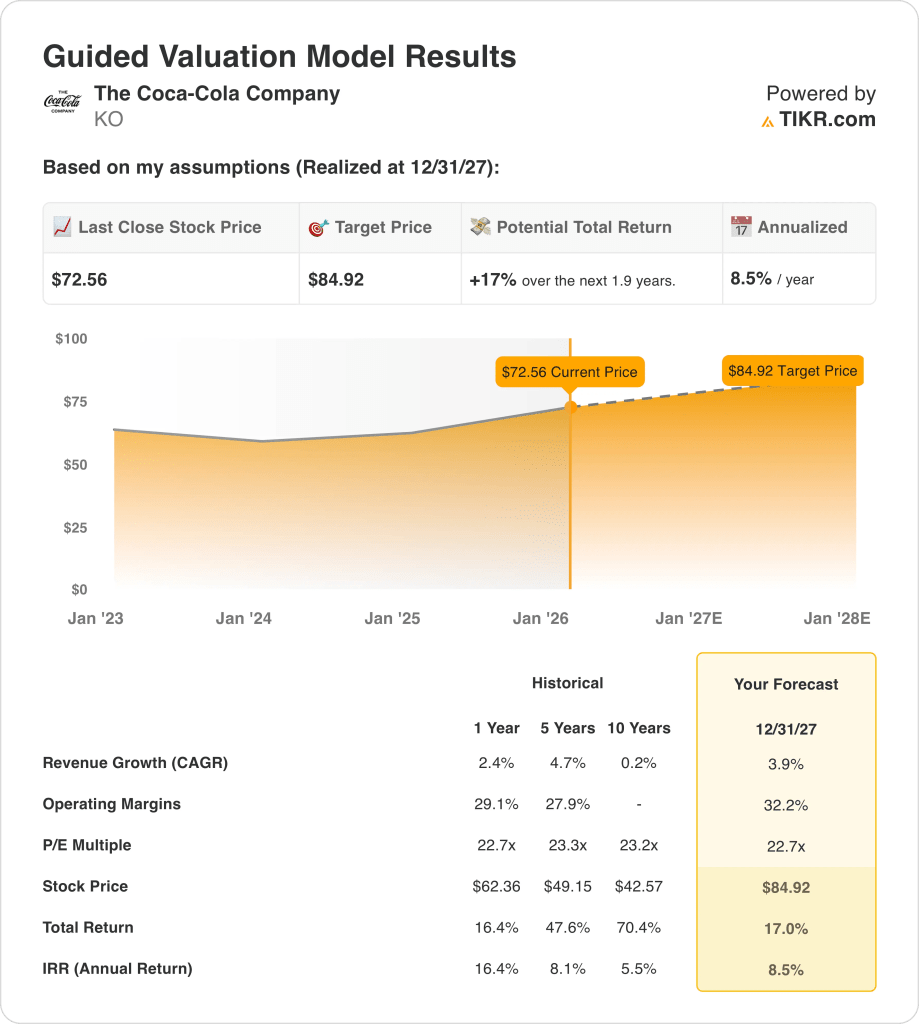
Using 3.87% revenue growth, 31.88% operating margins, and a 22x exit multiple, the model estimates a $76 target price.
This implies a 15% total return, or roughly 7% annualized returns, from today’s price to the modeled target.
Our Valuation Assumptions
TIKR’s Valuation Model lets you plug in your own assumptions for a company’s revenue growth, operating margins, and P/E multiple, and calculates the stock’s expected returns.
Here’s what we used for KO stock:
1. Revenue Growth: 3.9%
Coca-Cola stock generated $48 billion in LTM revenue, up from $39 billion in 2021, supported by global pricing discipline.
Quarterly revenue rose 4% year over year to $12 billion, reflecting pricing strength despite softer volumes.
Growth remains constrained by health regulation and portfolio maturity, partially offset by emerging markets and premium brand extensions.
According to pooled market forecasts, a 3.9% revenue growth assumption balances pricing durability against slower global beverage volume trends.
2. Operating Margins: 32.2%
Coca-Cola stock produced $15 billion in LTM operating income, with margins rising from 30% in 2021 to nearly 32% recently.
Margin expansion reflects concentrate economics, disciplined SG&A growth, and refranchising benefits that sustain operating leverage.
Input cost swings and marketing reinvestment remain constraints, though pricing continues converting into profit efficiently.
In line with analyst consensus projections, operating margins around 32.2% reflect normalized efficiency near recent peak levels.
3. Exit P/E Multiple: 22.7x
Coca-Cola shares historically traded between roughly 22x and 23x earnings, supported by defensive cash flows and global brand stability.
The stock trades near 22x earnings, signaling investor caution toward long-term volume growth despite consistent profitability.
Multiple expansion depends on sustained pricing, steady margins, and capital returns offsetting slower category growth.
Based on consensus estimates, a 22.7x exit multiple implies stable fundamentals and an 8.5% annual return outlook.
What Happens If Things Go Better or Worse?
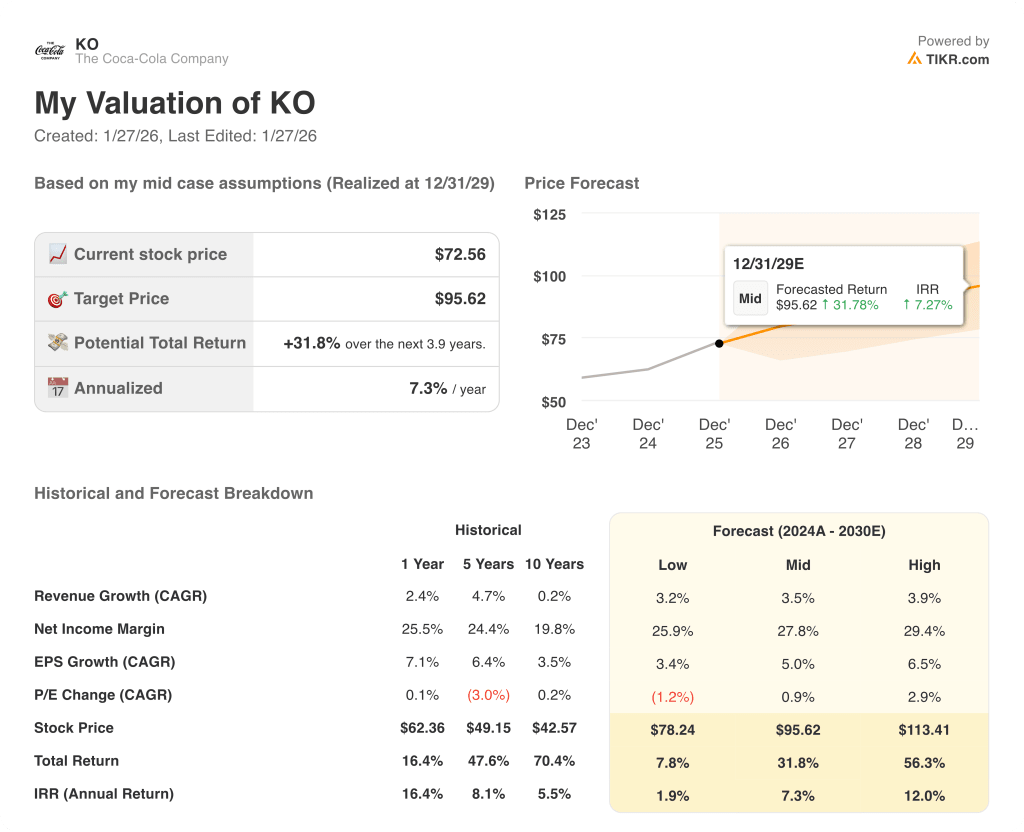
Coca-Cola’s outcomes depend on pricing discipline, volume resilience, and margin control across a mature portfolio, setting up multiple execution paths through 2029.
- Low Case: If volumes stay pressured and pricing offsets weaken, revenue grows 3.2% with margins near 25.9% → 1.9% annualized return.
- Mid Case: With core brands performing steadily and cost control holding, revenue grows 3.5% and margins reach 27.8% → 7.3% annualized return.
- High Case: If pricing, mix, and execution outperform expectations, revenue reaches 3.9% and margins approach 29.4% → 12.0% annualized return.
How Much Upside Does It Have From Here?
With TIKR’s new Valuation Model tool, you can estimate a stock’s potential share price in under a minute.
All it takes is three simple inputs:
- Revenue Growth
- Operating Margins
- Exit P/E multiple
If you’re not sure what to enter, TIKR automatically fills in each input using analysts’ consensus estimates, giving you a quick, reliable starting point.
From there, TIKR calculates the potential share price and total returns under Bull, Base, and Bear scenarios so you can quickly see whether a stock looks undervalued or overvalued.
See a stock’s true value in under 60 seconds (Free with TIKR) >>>
Looking for New Opportunities?
- See what stocks billionaire investors are buying so you can follow the smart money.
- Analyze stocks in as little as 5 minutes with TIKR’s all-in-one, easy-to-use platform.
- The more rocks you overturn… the more opportunities you’ll uncover. Search 100K+ global stocks, global top investor holdings, and more with TIKR.
Disclaimer:
Please note that the articles on TIKR are not intended to serve as investment or financial advice from TIKR or our content team, nor are they recommendations to buy or sell any stocks. We create our content based on TIKR Terminal’s investment data and analysts’ estimates. Our analysis might not include recent company news or important updates. TIKR has no position in any stocks mentioned. Thank you for reading, and happy investing!