Key Takeaways:
- Revenue Scale: Abbott stock generated $44 billion in LTM revenue, confirming durable demand across diagnostics, devices, nutrition, and established pharmaceuticals.
- Profit Efficiency: Gross margins near 57% support operating income of roughly $12 billion, highlighting scale benefits and disciplined cost control.
- Strategic Momentum: FDA approval in 2026 expands neuromodulation usage, supporting higher-margin medical device growth within Abbott’s portfolio.
- Valuation Focus: With a market capitalization around $190 billion, Abbott stock reflects stable fundamentals but ongoing debate over long-term growth acceleration.
Abbott Laboratories (ABT) operates across pharmaceuticals, diagnostics, nutrition, and medical devices, generating $44 billion in LTM revenue from diversified global healthcare demand.
In January 2026, Abbott received FDA approval for prone MRI use with neuromodulation systems, expanding access across its chronic pain device portfolio.
Abbott delivered $44 billion in 2025 revenue with 6% growth, as diagnostics stabilized and medical device procedures picked up again.
Meanwhile, operating income reached $12 billion LTM with 57% gross margins, reflecting pricing discipline and scale in diagnostics and devices.
Despite improving profits and a $190 billion market cap, the valuation shows investor caution about long-term growth after the pandemic.
What the Model Says for ABT Stock
We analyzed Abbott based on diversified healthcare exposure, consistent operating efficiency, and capital returns supported by global demand.
Using 7.6% revenue growth, 24.9% operating margins, and a 19.1x exit multiple, the model projects steady earnings expansion.
This implies a $142.70 target price, representing 31.8% total upside and a 9.9% annualized return.

Our Valuation Assumptions
TIKR’s Valuation Model lets you plug in your own assumptions for a company’s revenue growth, operating margins, and P/E multiple, and calculates the stock’s expected returns.
Here’s what we used for ABT stock:
1. Revenue Growth: 7.6%
Abbott generated steady growth over recent years, with 5.7% one-year and 5.1% five-year revenue CAGR reflecting diversified healthcare exposure.
Also, recent performance benefited from diagnostics normalization and medical device recovery, while nutrition and established pharmaceuticals provided stability across regions.
Forward growth relies on device adoption, diagnostic expansion, and emerging markets, offset by pricing pressure and healthcare budget constraints.
Overall, consensus estimates of 7.6% revenue growth support a balanced outlook aligned with diversification and a 9.9% annual return profile.
2. Operating Margins: 24.9%
Abbott stock historically delivered operating margins between 22% and 23%, reflecting scale advantages across diagnostics, devices, and branded nutrition platforms.
Margins improved as higher-margin medical devices and diagnostics regained volume while cost discipline moderated inflation impacts across manufacturing and distribution.
Normalization assumes continued mix shift toward devices, balanced against regulatory compliance costs and competitive reimbursement dynamics in global healthcare markets.
Therefore, analyst projections place operating margins near 24.9%, balancing efficiency gains against normalization risks in long-term execution.
3. Exit P/E Multiple: 19.1x
Abbott stock has historically traded at earnings multiples between roughly 23x and 25x during periods of stronger growth and healthcare demand.
The valuation reflects caution about post-pandemic normalization, reimbursement pressure, and slower near-term earnings across the diagnostics business.
Sustained execution in devices, diagnostics innovation, and consistent capital returns remain necessary to support stable valuation over the forecast period.
Therefore, based on street consensus estimates, a 19.1x exit multiple reflects conservative expectations without requiring multiple expansion to reach modeled returns.
What Happens If Things Go Better or Worse?
Abbott’s outcomes depend on medical device adoption, diagnostics demand, and margin discipline, setting up a range of possible paths through 2030.
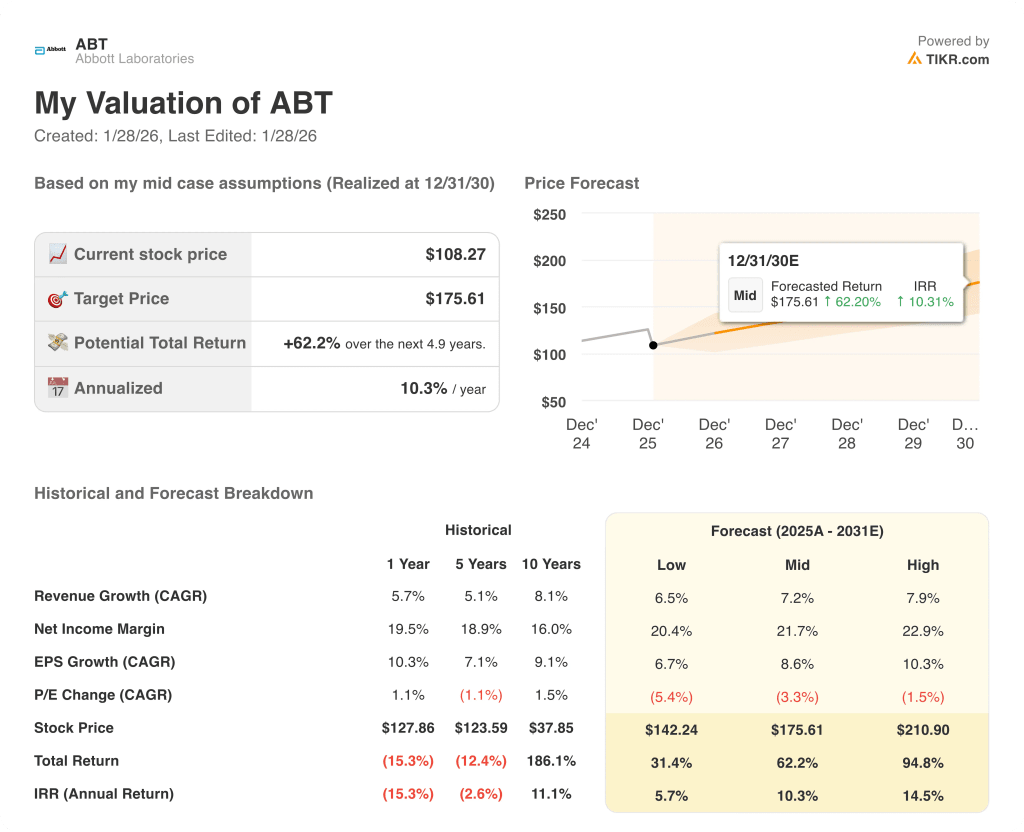
- Low Case: If device demand slows and pricing pressure persists, revenue grows around 6.5% and margins stay near 20.4% → 5.7% annualized return.
- Mid Case: With core franchises executing steadily, revenue growth near 7.2% and margins improving toward 21.7% support stable valuation → 10.3% annualized return.
- High Case: If devices and diagnostics outperform globally, revenue reaches about 7.9% and margins approach 22.9% as efficiency improves → 14.5% annualized return.
How Much Upside Does It Have From Here?
With TIKR’s new Valuation Model tool, you can estimate a stock’s potential share price in under a minute.
All it takes is three simple inputs:
- Revenue Growth
- Operating Margins
- Exit P/E multiple
If you’re not sure what to enter, TIKR automatically fills in each input using analysts’ consensus estimates, giving you a quick, reliable starting point.
From there, TIKR calculates the potential share price and total returns under Bull, Base, and Bear scenarios so you can quickly see whether a stock looks undervalued or overvalued.
See a stock’s true value in under 60 seconds (Free with TIKR) >>>
Looking for New Opportunities?
- See what stocks billionaire investors are buying so you can follow the smart money.
- Analyze stocks in as little as 5 minutes with TIKR’s all-in-one, easy-to-use platform.
- The more rocks you overturn… the more opportunities you’ll uncover. Search 100K+ global stocks, global top investor holdings, and more with TIKR.
Disclaimer:
Please note that the articles on TIKR are not intended to serve as investment or financial advice from TIKR or our content team, nor are they recommendations to buy or sell any stocks. We create our content based on TIKR Terminal’s investment data and analysts’ estimates. Our analysis might not include recent company news or important updates. TIKR has no position in any stocks mentioned. Thank you for reading, and happy investing!