
Key Takeaways:
- Revenue Scale: T-Mobile US generated $86 billion LTM revenue, confirming sustained demand across postpaid, prepaid, and home broadband services.
- Profit Expansion: Operating income reached $20 billion LTM with 23% margins, showing structural efficiency gains from scale and network leverage.
- Capital Discipline: The $3 billion debt redemption at 5% interest lowers financing costs and supports stronger free cash flow generation.
- Valuation Setup: Despite a $190 billion market cap, current pricing reflects regulatory and margin concerns rather than recent earnings growth.
T-Mobile US (TMUS) provides nationwide wireless services and devices, generating $86 billion in LTM revenue across postpaid, prepaid, and broadband customers.
In January 2026, T-Mobile announced redemption of $3 billion in 4.75% notes that reduces interest costs and strengthening balance sheet flexibility.
Q3 2025 revenue reached $22 billion, up 9%, as subscriber growth and pricing offset competitive pressure.
Operating income hit $20 billion LTM with margins near 23%, reflecting scale benefits and tighter cost control.
Despite higher profits and a $190 billion market value, valuation reflects scrutiny on pricing claims and margin momentum.
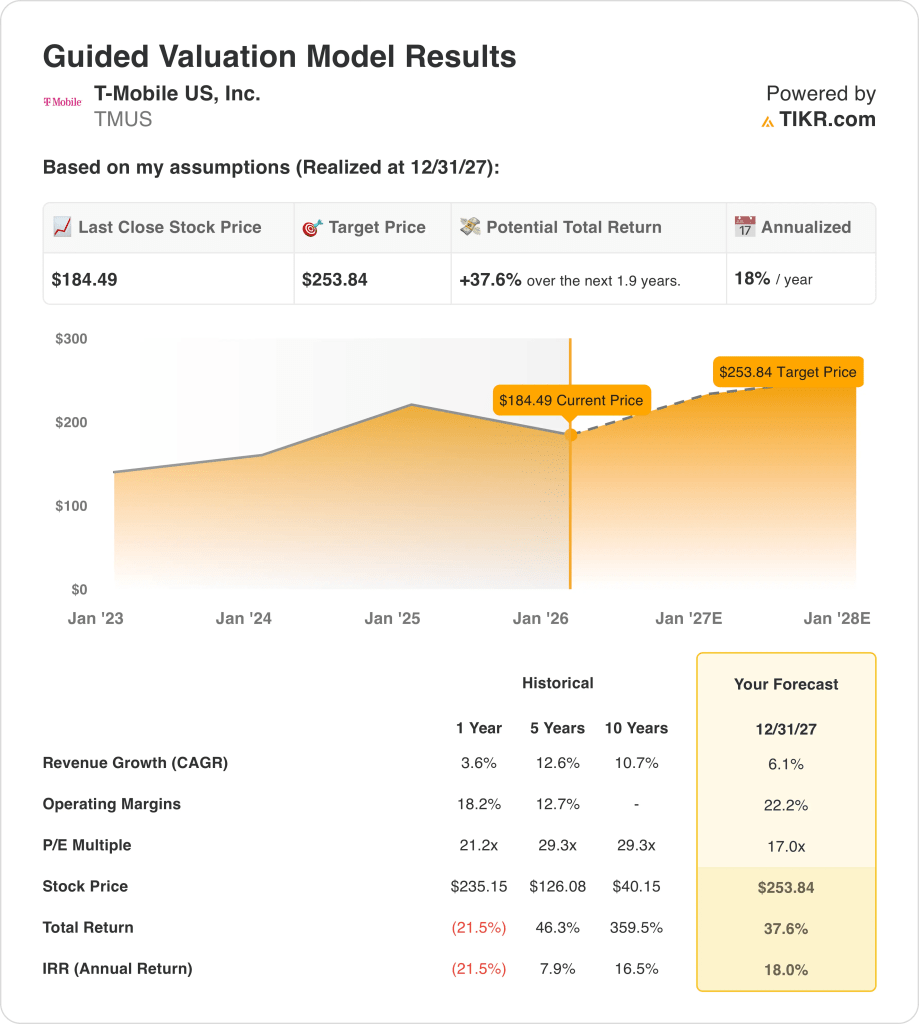
What the Model Says for TMUS Stock
We analyzed T-Mobile stock using 6.1% revenue growth, 22.2% operating margins, and strong capital returns from scale and network positioning.
Based on a 17.0x exit multiple, the model reflects disciplined profitability, subscriber scale, and steady cash returns supporting valuation expansion.
This projects a $253.84 target price, implying 37.6% total upside and an 18% annualized return over 1.9 years.
Our Valuation Assumptions
TIKR’s Valuation Model lets you plug in your own assumptions for a company’s revenue growth, operating margins, and P/E multiple, and calculates the stock’s expected returns.
Here’s what we used for TMUS stock:
1. Revenue Growth: 6.1%
T-Mobile achieved over 10% long-term revenue growth, driven by subscriber gains and stable postpaid and broadband demand.
More recently, revenue growth moderated to around 4% as the wireless market matured, while service revenue remained supported by low churn and premium plan adoption.
Looking forward, growth is supported by fixed wireless broadband expansion and postpaid share gains, while limits include market saturation and competitive pricing discipline.
According to consensus analyst estimates, a 6.1% revenue growth assumption balances continued share gains against slower industry-wide subscriber growth.
2. Operating Margins: 22.2%
T-Mobile’s operating margins improved from the low teens historically as merger synergies reduced costs and scale benefits flowed through the income statement.
Recent margins near 18% reflect network integration progress and lower customer acquisition costs following the Sprint merger integration phase.
Margin upside is supported by lower capex intensity, declining integration expenses, and higher service revenue mix, while risks include promotional pressure.
In line with analyst consensus projections, operating margins near 22.2% reflect normalized scale economics without assuming aggressive cost cuts.
3. Exit P/E Multiple: 17x
T-Mobile has historically traded at earnings multiples above 20x during periods of faster subscriber growth and strong merger-driven earnings acceleration.
Current valuation reflects investor caution around wireless market maturity, slower net adds, and normalization after merger benefits fully roll off.
A 17.0x exit multiple assumes stable earnings growth, sustained cash generation, and disciplined capital returns without renewed industry price wars.
Based on street consensus estimates, a 17.0x exit multiple reflects balanced expectations between durable cash flow and a mature U.S. wireless market.
What Happens If Things Go Better or Worse?
T-Mobile’s outcomes depend on wireless demand stability, subscriber mix discipline, and cost control, setting up a range of possible paths through 2029.
- Low Case: If wireless competition tightens and pricing slows, revenue grows around 5.0% with margins near 16.7% → 11.4% annualized return.
- Mid Case: With core subscriber growth holding steady, revenue grows near 5.5% and margins improve toward 17.4% → 16.9% annualized return.
- High Case: If broadband adoption accelerates and costs scale efficiently, revenue reaches about 6.1% with margins near 17.9% → 21.8% annualized return.
The $341 mid-case target price depends on sustained postpaid adds, broadband growth, and margin discipline, without relying on multiple expansion or market enthusiasm.

How Much Upside Does It Have From Here?
With TIKR’s new Valuation Model tool, you can estimate a stock’s potential share price in under a minute.
All it takes is three simple inputs:
- Revenue Growth
- Operating Margins
- Exit P/E multiple
If you’re not sure what to enter, TIKR automatically fills in each input using analysts’ consensus estimates, giving you a quick, reliable starting point.
From there, TIKR calculates the potential share price and total returns under Bull, Base, and Bear scenarios so you can quickly see whether a stock looks undervalued or overvalued.
See a stock’s true value in under 60 seconds (Free with TIKR) >>>
Looking for New Opportunities?
- See what stocks billionaire investors are buying so you can follow the smart money.
- Analyze stocks in as little as 5 minutes with TIKR’s all-in-one, easy-to-use platform.
- The more rocks you overturn… the more opportunities you’ll uncover. Search 100K+ global stocks, global top investor holdings, and more with TIKR.
Disclaimer:
Please note that the articles on TIKR are not intended to serve as investment or financial advice from TIKR or our content team, nor are they recommendations to buy or sell any stocks. We create our content based on TIKR Terminal’s investment data and analysts’ estimates. Our analysis might not include recent company news or important updates. TIKR has no position in any stocks mentioned. Thank you for reading, and happy investing!