Every investment thesis rests on assumptions about the business. You buy a stock because you expect revenue to grow, margins to hold steady, or returns on capital to remain elevated. When those assumptions prove correct, the investment works. When they prove wrong, holding becomes a liability.
The difficulty is distinguishing between temporary setbacks and permanent deterioration. A single weak quarter does not invalidate a long-term thesis. Businesses face headwinds, miss estimates, and stumble operationally without losing their competitive advantages. But sometimes a weak quarter is the first sign of something deeper. The challenge is recognizing when fundamentals have genuinely changed versus when the market is overreacting to noise.
Many investors struggle with this distinction because they anchor to their original thesis. They remember why they bought, focus on the positives, and explain away evidence that contradicts their view. This confirmation bias leads to holding stocks long after the investment case has deteriorated. The losses that accumulate during denial often exceed what a timely exit would have cost.
Selling when fundamentals change requires intellectual honesty. You must evaluate your holdings with the same skepticism you would apply to a stock you do not own. If the business no longer meets the criteria that justified the original purchase, the rational choice is to exit, regardless of whether you are sitting on a gain or a loss.
This guide explains how to identify genuine fundamental deterioration, what metrics to monitor, and how to use TIKR to recognize when the thesis has broken.
Defining Your Fundamental Thesis
Before you can recognize when fundamentals change, you need clarity about the assumptions that underpin your investment. A vague thesis like “this is a good company” provides no framework for evaluation. A specific thesis creates measurable criteria for success or failure.
When you buy a stock, document the key assumptions. These might include expectations for revenue growth rates, target margins, capital return thresholds, or specific catalysts you expect to play out. Be explicit about what would need to happen for the investment to work and what would cause it to fail.
For example, a thesis might state: “I expect this company to grow revenue at 12% to 15% annually while maintaining operating margins above 18% and returns on capital above 15%. The competitive moat from switching costs should protect market share. I would reconsider the position if revenue growth falls below 8% for two consecutive years, margins compress below 15%, or a competitor gains significant share.”
This specificity transforms selling from an emotional decision into a logical one. You are not asking whether you feel good about the stock. You are asking whether the business is meeting the criteria you established. When it stops meeting them, you have a clear signal to act.
TIKR tip: When you add a stock to your portfolio, use TIKR to document your thesis alongside the key metrics you will monitor. The Detailed Financials tab provides the baseline numbers you can compare against over time.
Look for stock deterioration instantly using TIKR detailed financial tools (Free with TIKR) >>>
Revenue Deterioration
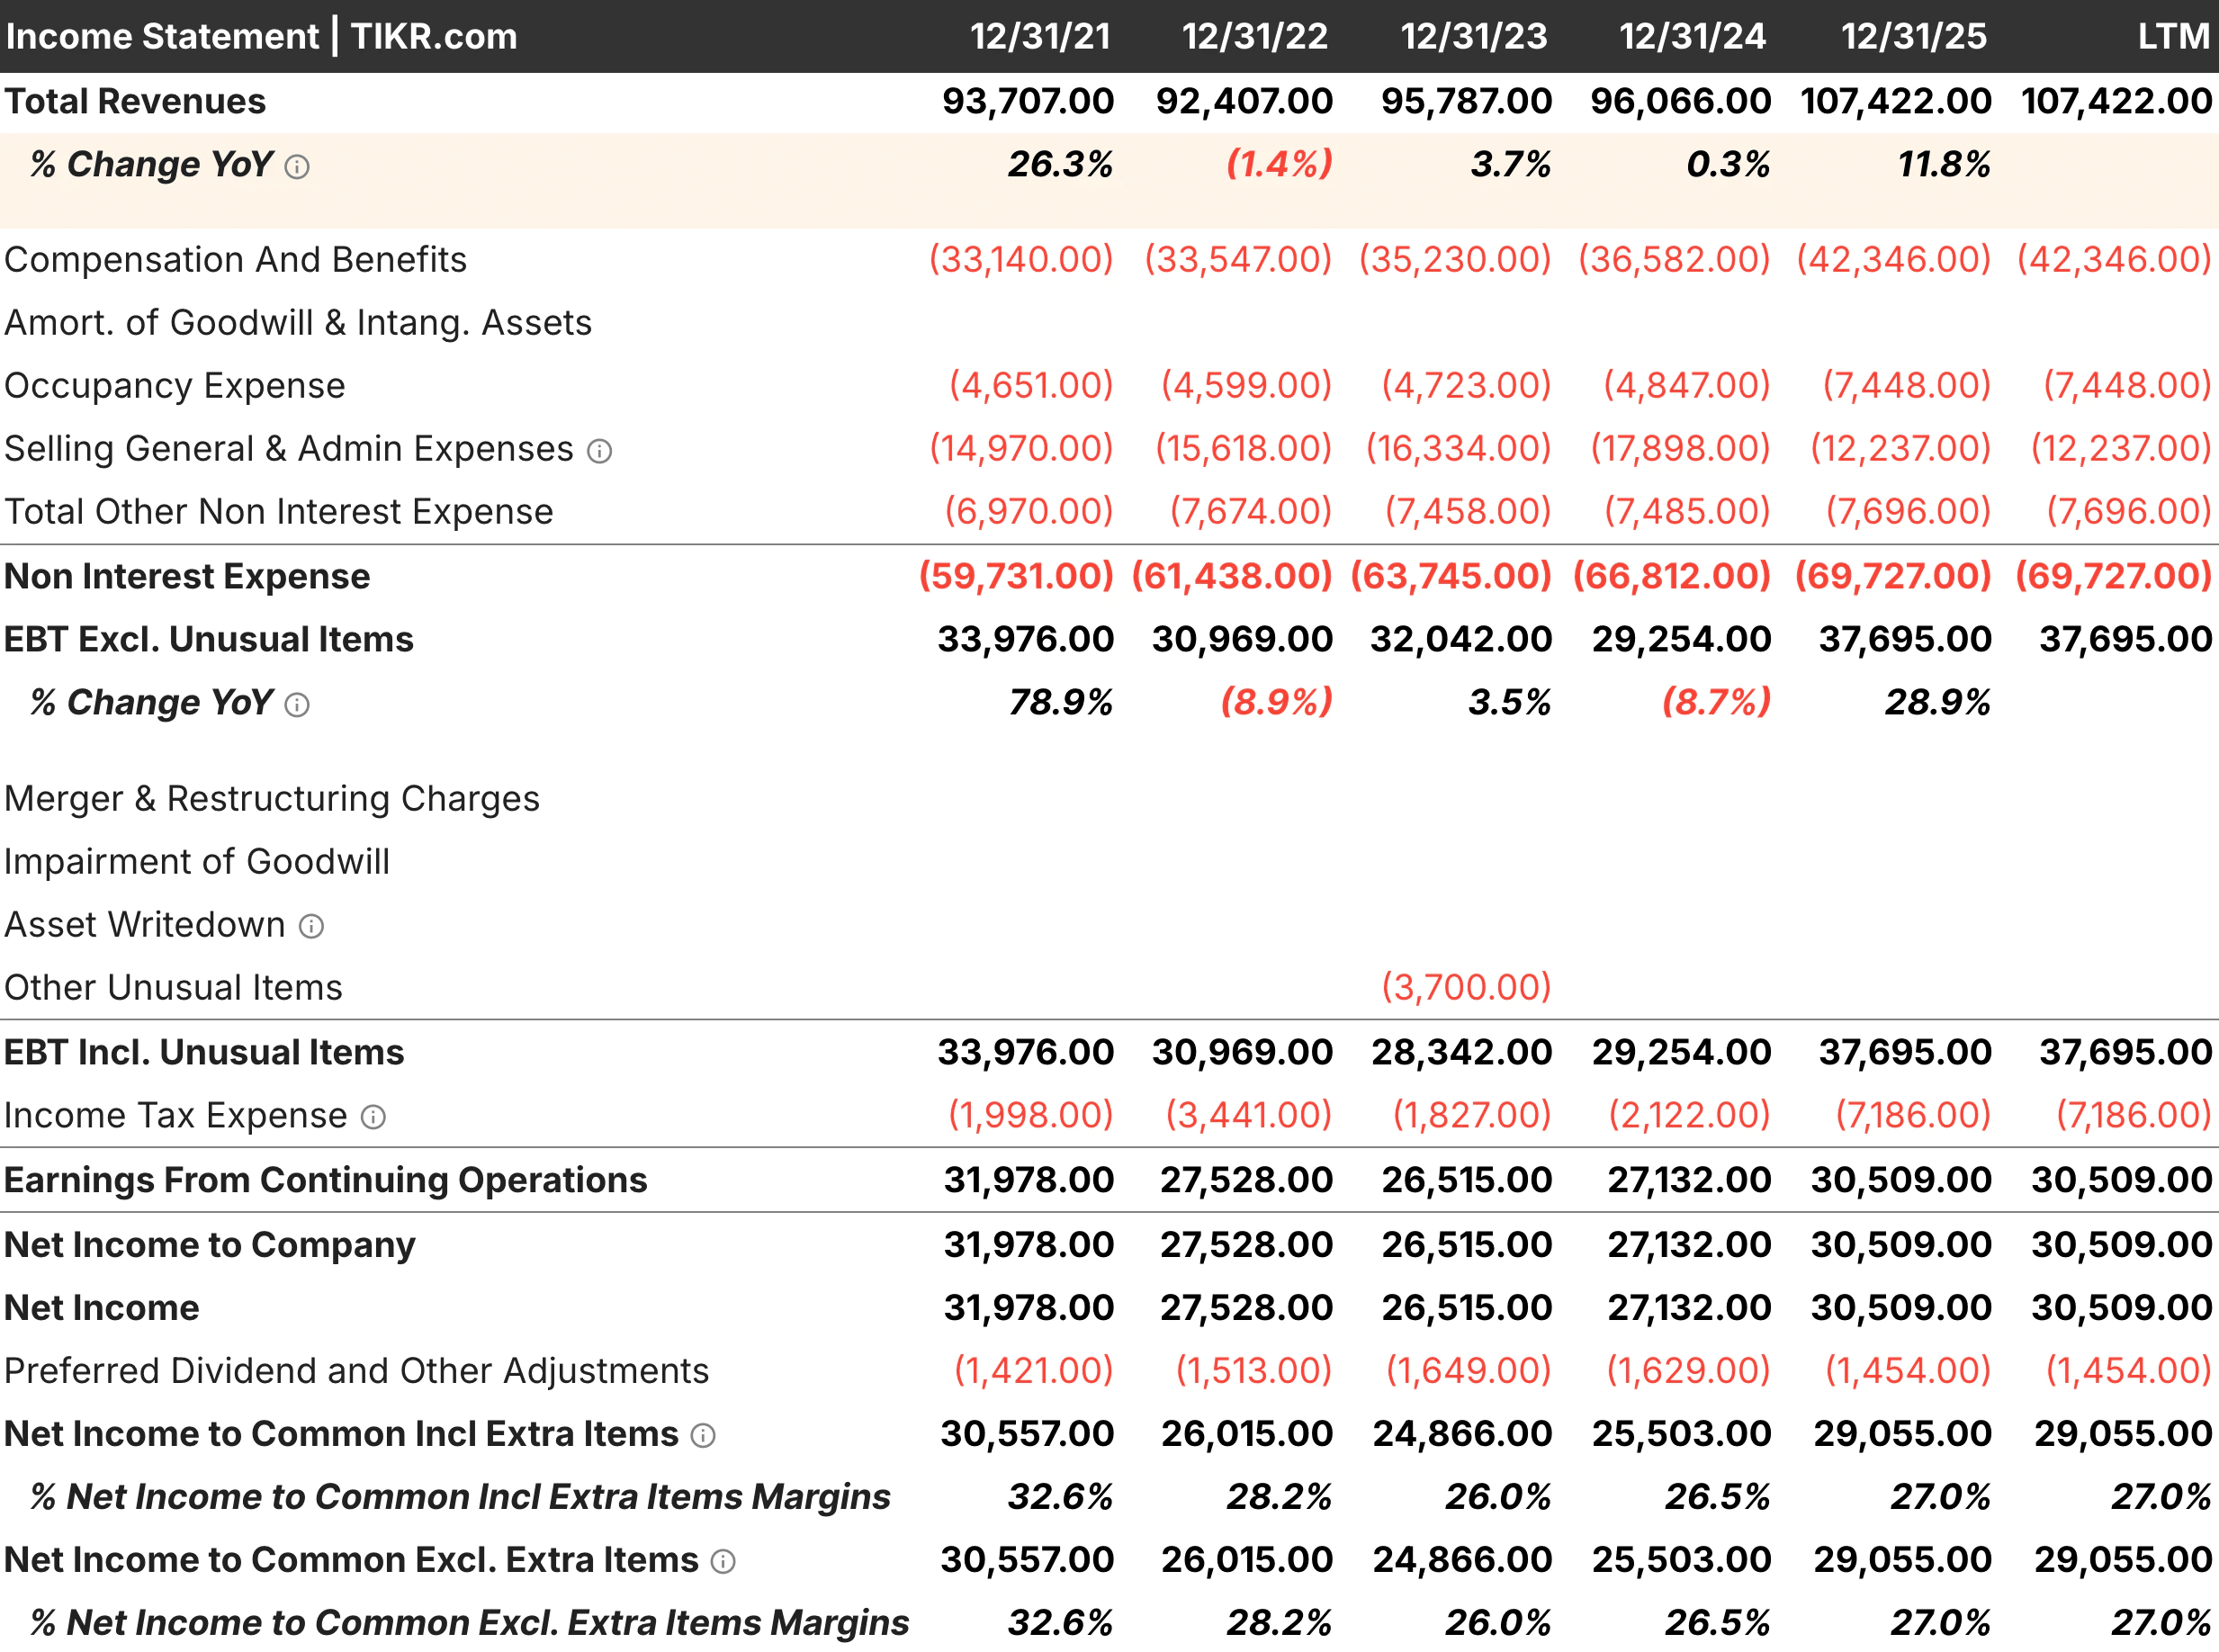
Revenue is the foundation of business performance. Everything else, including margins, earnings, and cash flow, flows from the top line. When revenue growth deteriorates meaningfully, it often signals that customers are leaving, competition is intensifying, or the market is shrinking.
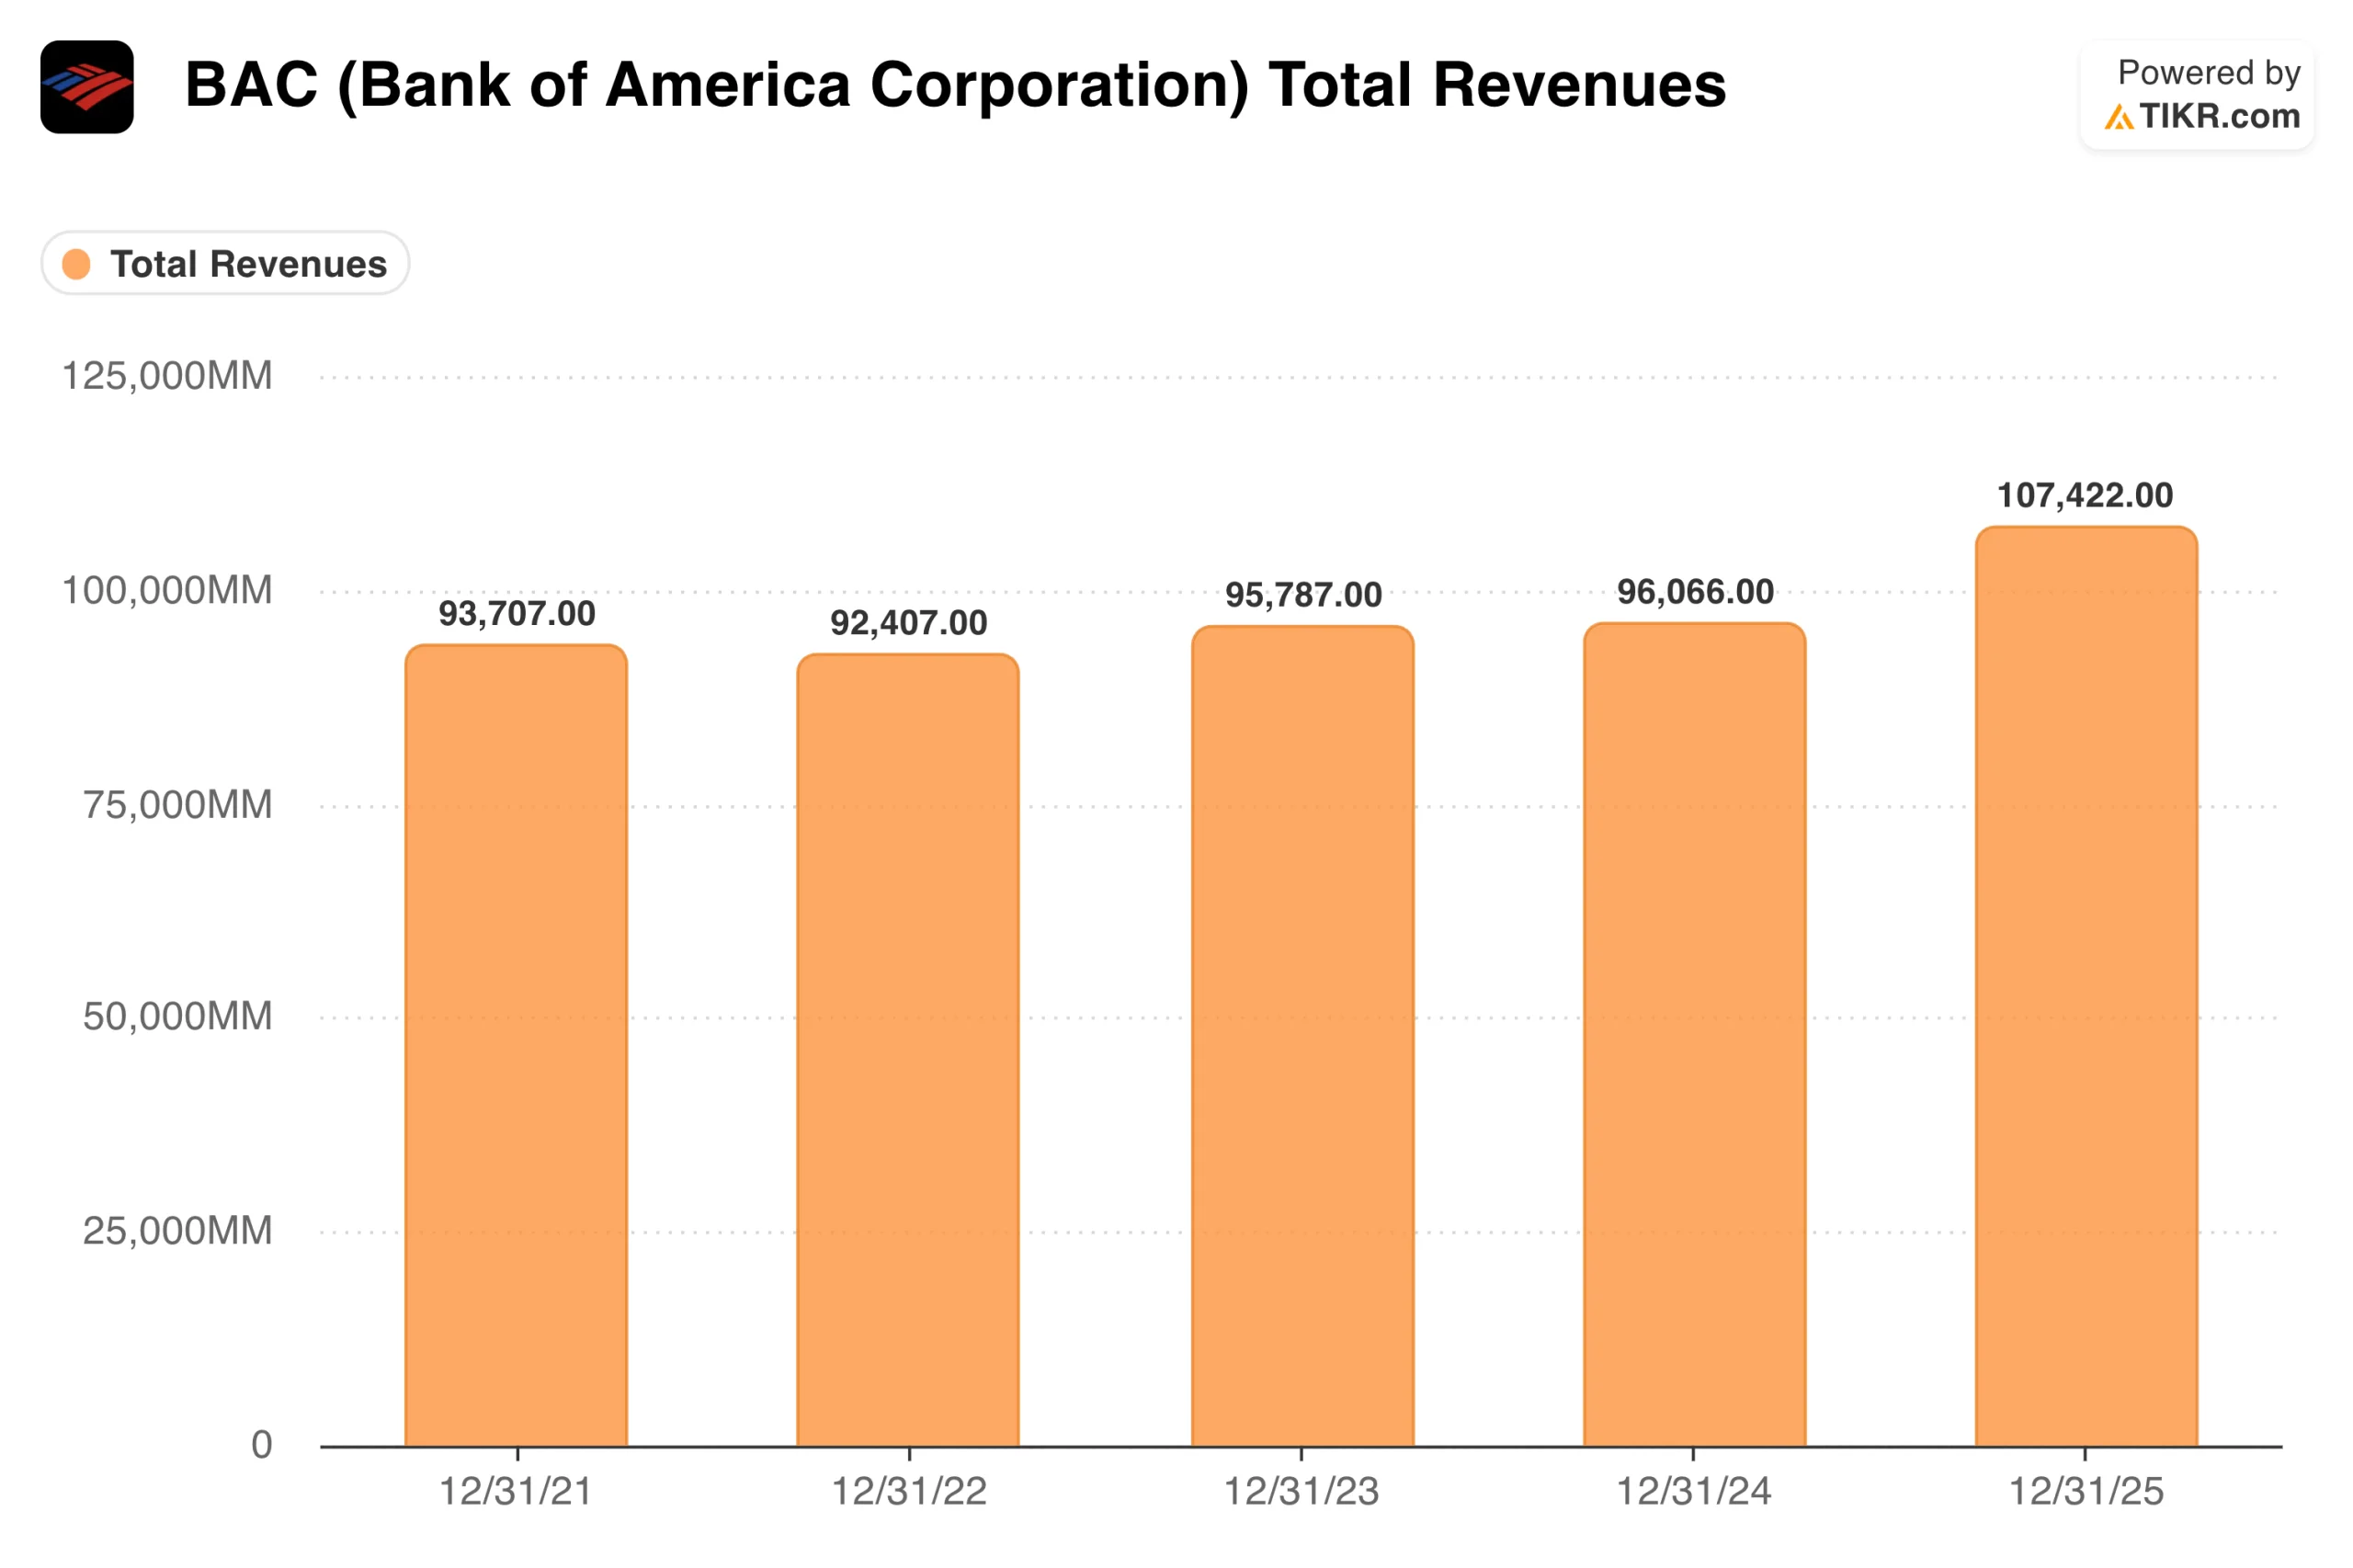
Watch for sustained deceleration rather than single-quarter misses. A company that grows revenue 18%, then 15%, then 11%, then 7% over four consecutive years is showing a clear trend. Each year’s growth is positive, but the trajectory suggests the business is maturing faster than expected or losing ground to the competition.
Value any stock in less than 60 seconds with TIKR’s new Valuation Model (It’s free) >>>
Compare revenue growth to industry peers. If the entire sector is slowing, one company’s deceleration may reflect macro conditions rather than company-specific problems. But if competitors continue growing while your holding stagnates, the business is losing share. Market share losses are difficult to reverse and often precede more serious deterioration.
Pay attention to the composition of revenue growth. A company can maintain headline growth through acquisitions while organic growth turns negative. Strip out acquired revenue to see how the core business is performing. If organic growth has stalled, the acquisitions may be masking fundamental weakness.
TIKR tip: Use TIKR’s Detailed Financials to track revenue growth over multiple years. Compare the company’s growth rate to competitors’ growth rates in the Competitors tab to determine whether deceleration is company-specific or industry-wide.
Margin Compression
Margins reveal whether a company can convert revenue into profit. When margins compress over time, each dollar of revenue generates fewer earnings. This compression can reflect pricing pressure, rising costs, a shift in the mix toward lower-margin products, or a loss of operational efficiency.
Gross margin deterioration is particularly concerning because it suggests the core business model is weakening. If a company cannot maintain its markup over direct costs, either customers are unwilling to pay premium prices, or competition is forcing discounts. Neither situation bodes well for long-term profitability.
Operating margin compression may reflect investment in growth, which can be positive, or loss of operating leverage, which is negative. Distinguish between the two by examining what is driving the compression. Rising sales and marketing expenses to enter new markets differ from rising costs due to operational inefficiencies.
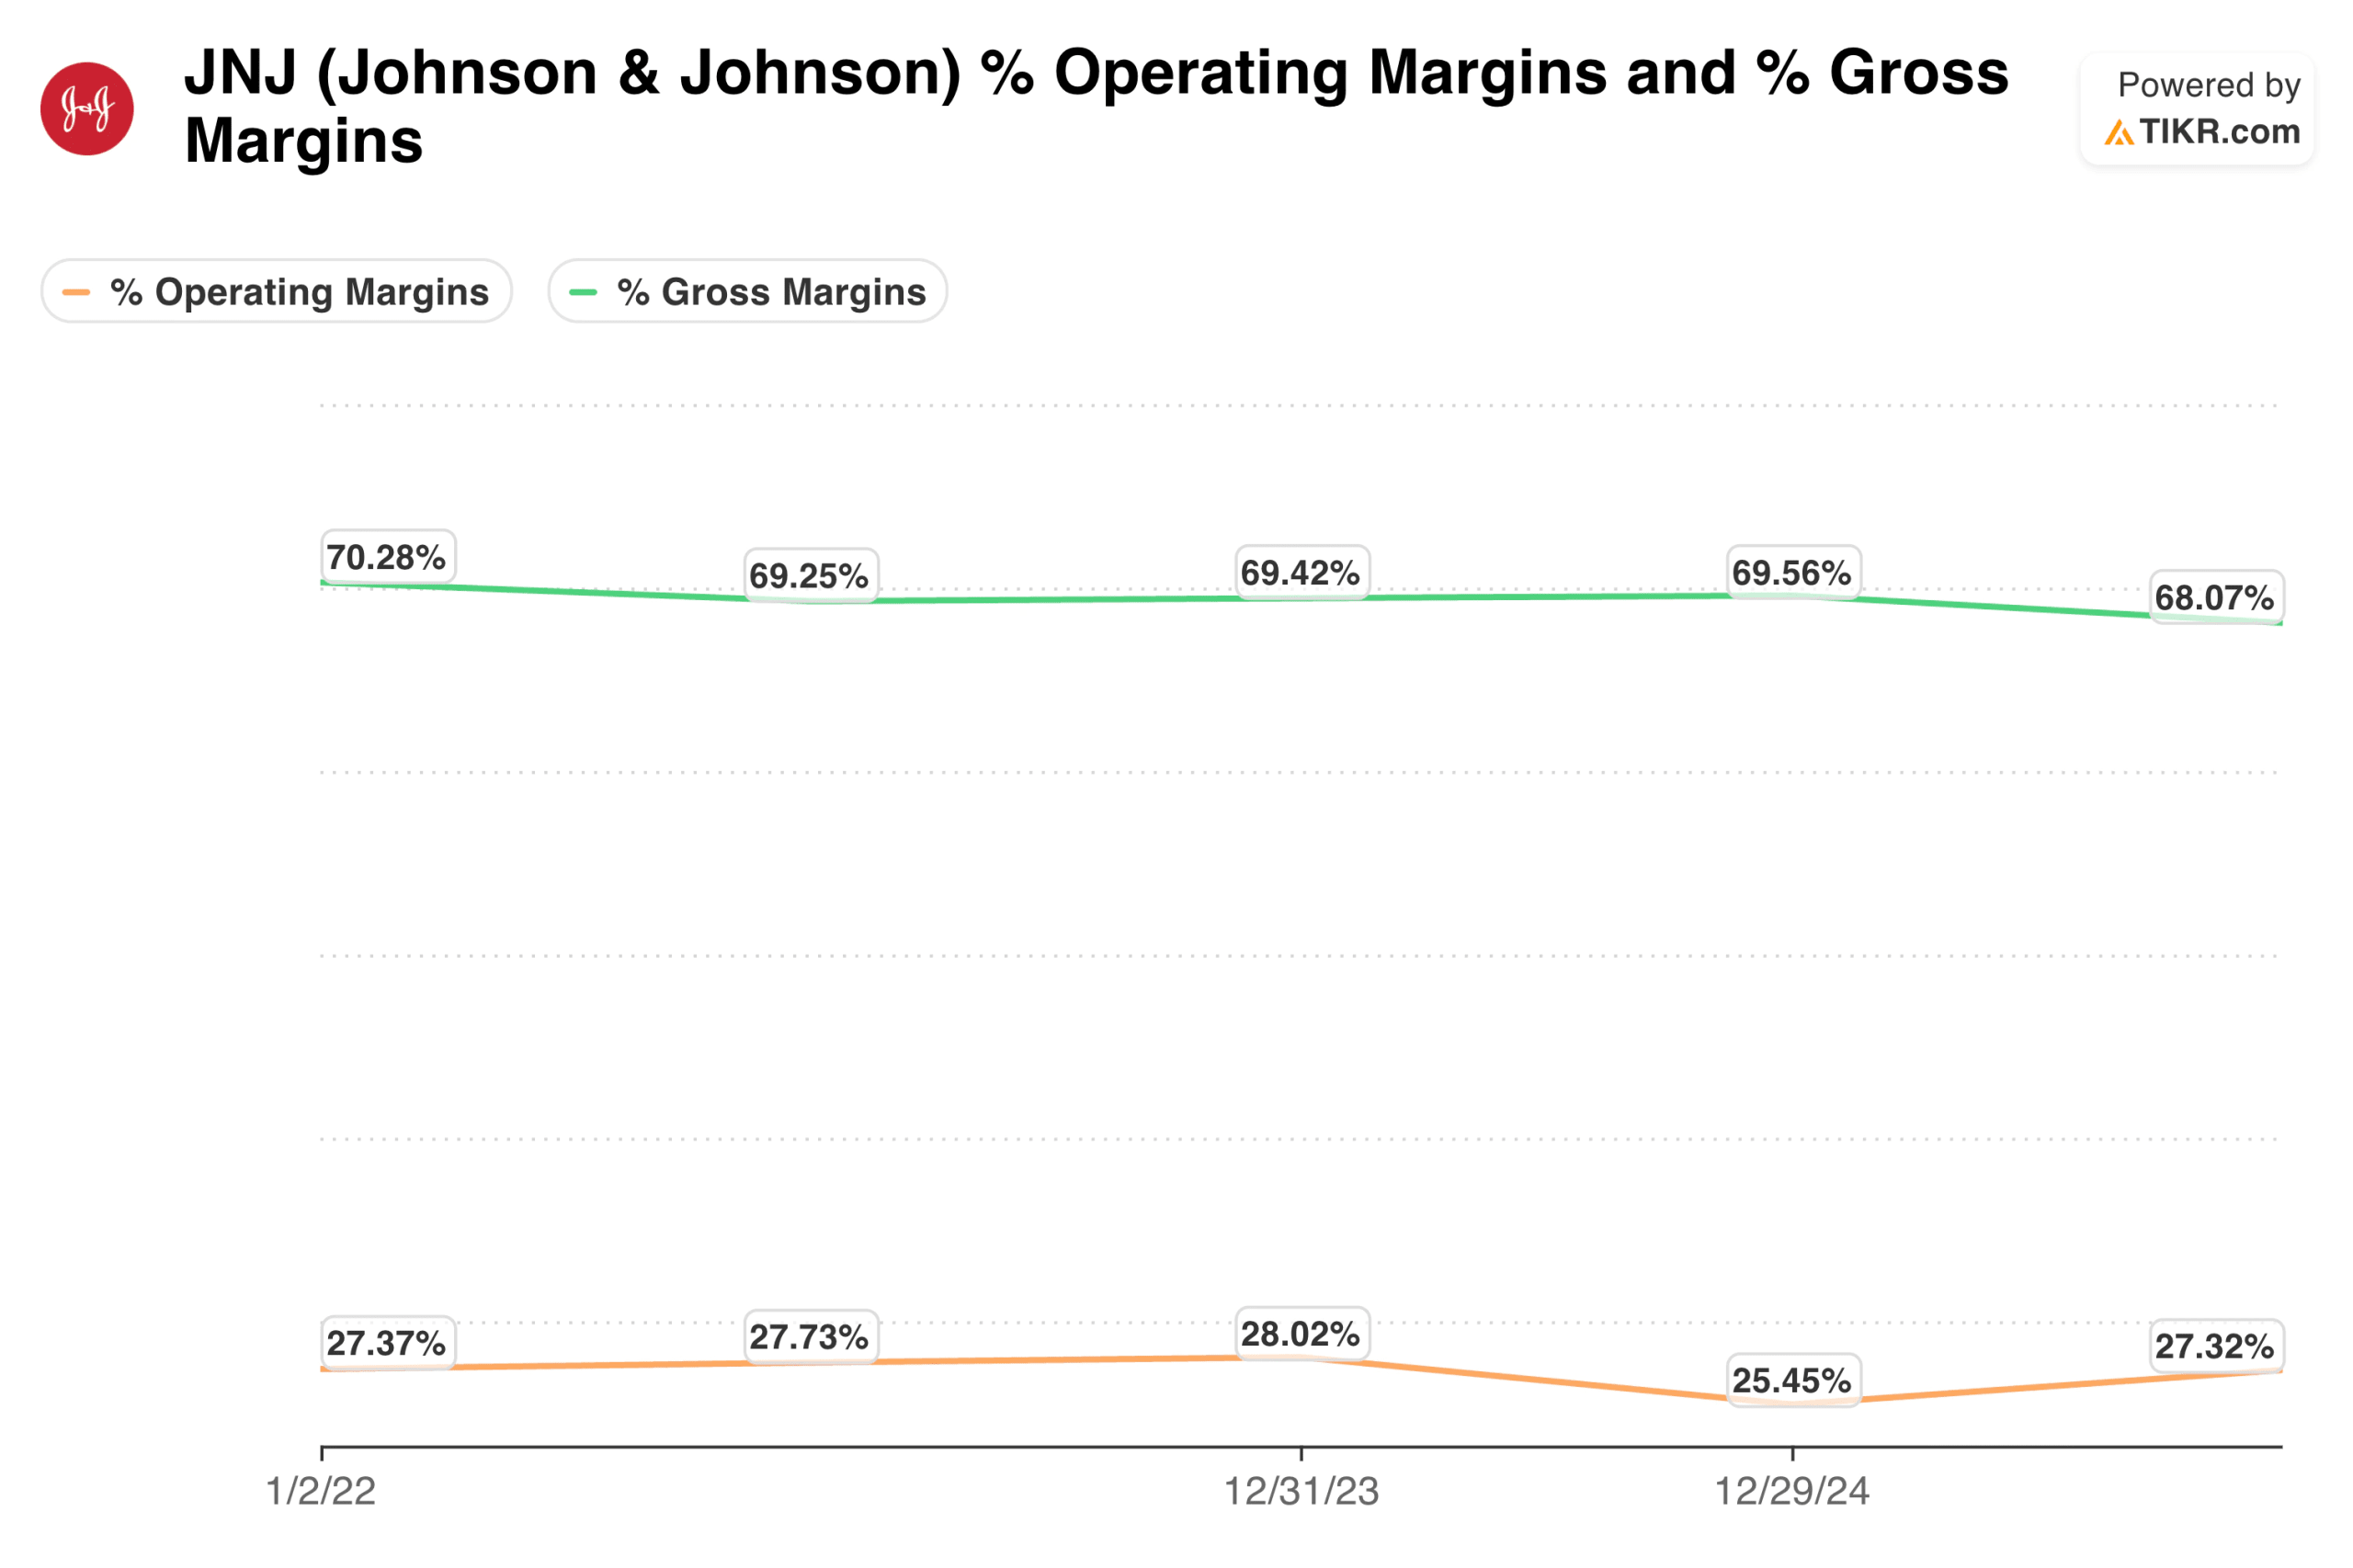
Watch for the trend rather than any single period. Margins fluctuate based on product mix, seasonality, and one-time items. What matters is whether the trajectory over three to five years shows stability, improvement, or decay. Persistent compression that continues quarter after quarter indicates structural problems.
TIKR tip: TIKR’s Detailed Financials display gross, operating, and net margins over time. Look for patterns of sustained compression rather than temporary fluctuations.
Get the most up-to-date stock financials of thousands of stocks with TIKR (It’s free) >>>
Declining Returns on Capital
Returns on capital measure how efficiently a business generates profits from its investments. High returns on capital typically indicate competitive advantages that allow the company to earn more than competitors from similar investments. When these returns decline, the moat may be eroding.
A company earning 25% returns on capital five years ago and 12% today is telling you something important. Either competition has intensified, the company is investing in lower-return projects, or management is allocating capital poorly. Regardless of the cause, the business is becoming less exceptional.
Compare the company’s returns on capital to its cost of capital. A business earning returns above its cost of capital creates value. One earning returns below its cost of capital destroys value. If returns have fallen from well above the hurdle rate to near or below it, the investment case has fundamentally changed.
Watch whether declining returns accompany increased investment. A company that doubles its capital base while returns fall from 20% to 10% is earning the same absolute profit from twice the capital. The business is growing less valuable on a per-dollar basis, even if headline earnings remain stable.
TIKR tip: Track return on capital in TIKR’s Ratios section under Detailed Financials. Compare current returns to five-year and ten-year averages to identify deterioration trends.
Run a detailed stock analysis on TIKR looking for stocks that are starting detoriate (It’s free) >>>
Cash Flow Divergence
Earnings can be manipulated through accounting choices. Cash flow is harder to fake. When a company reports strong earnings but cash flow deteriorates, the quality of those earnings is suspect.
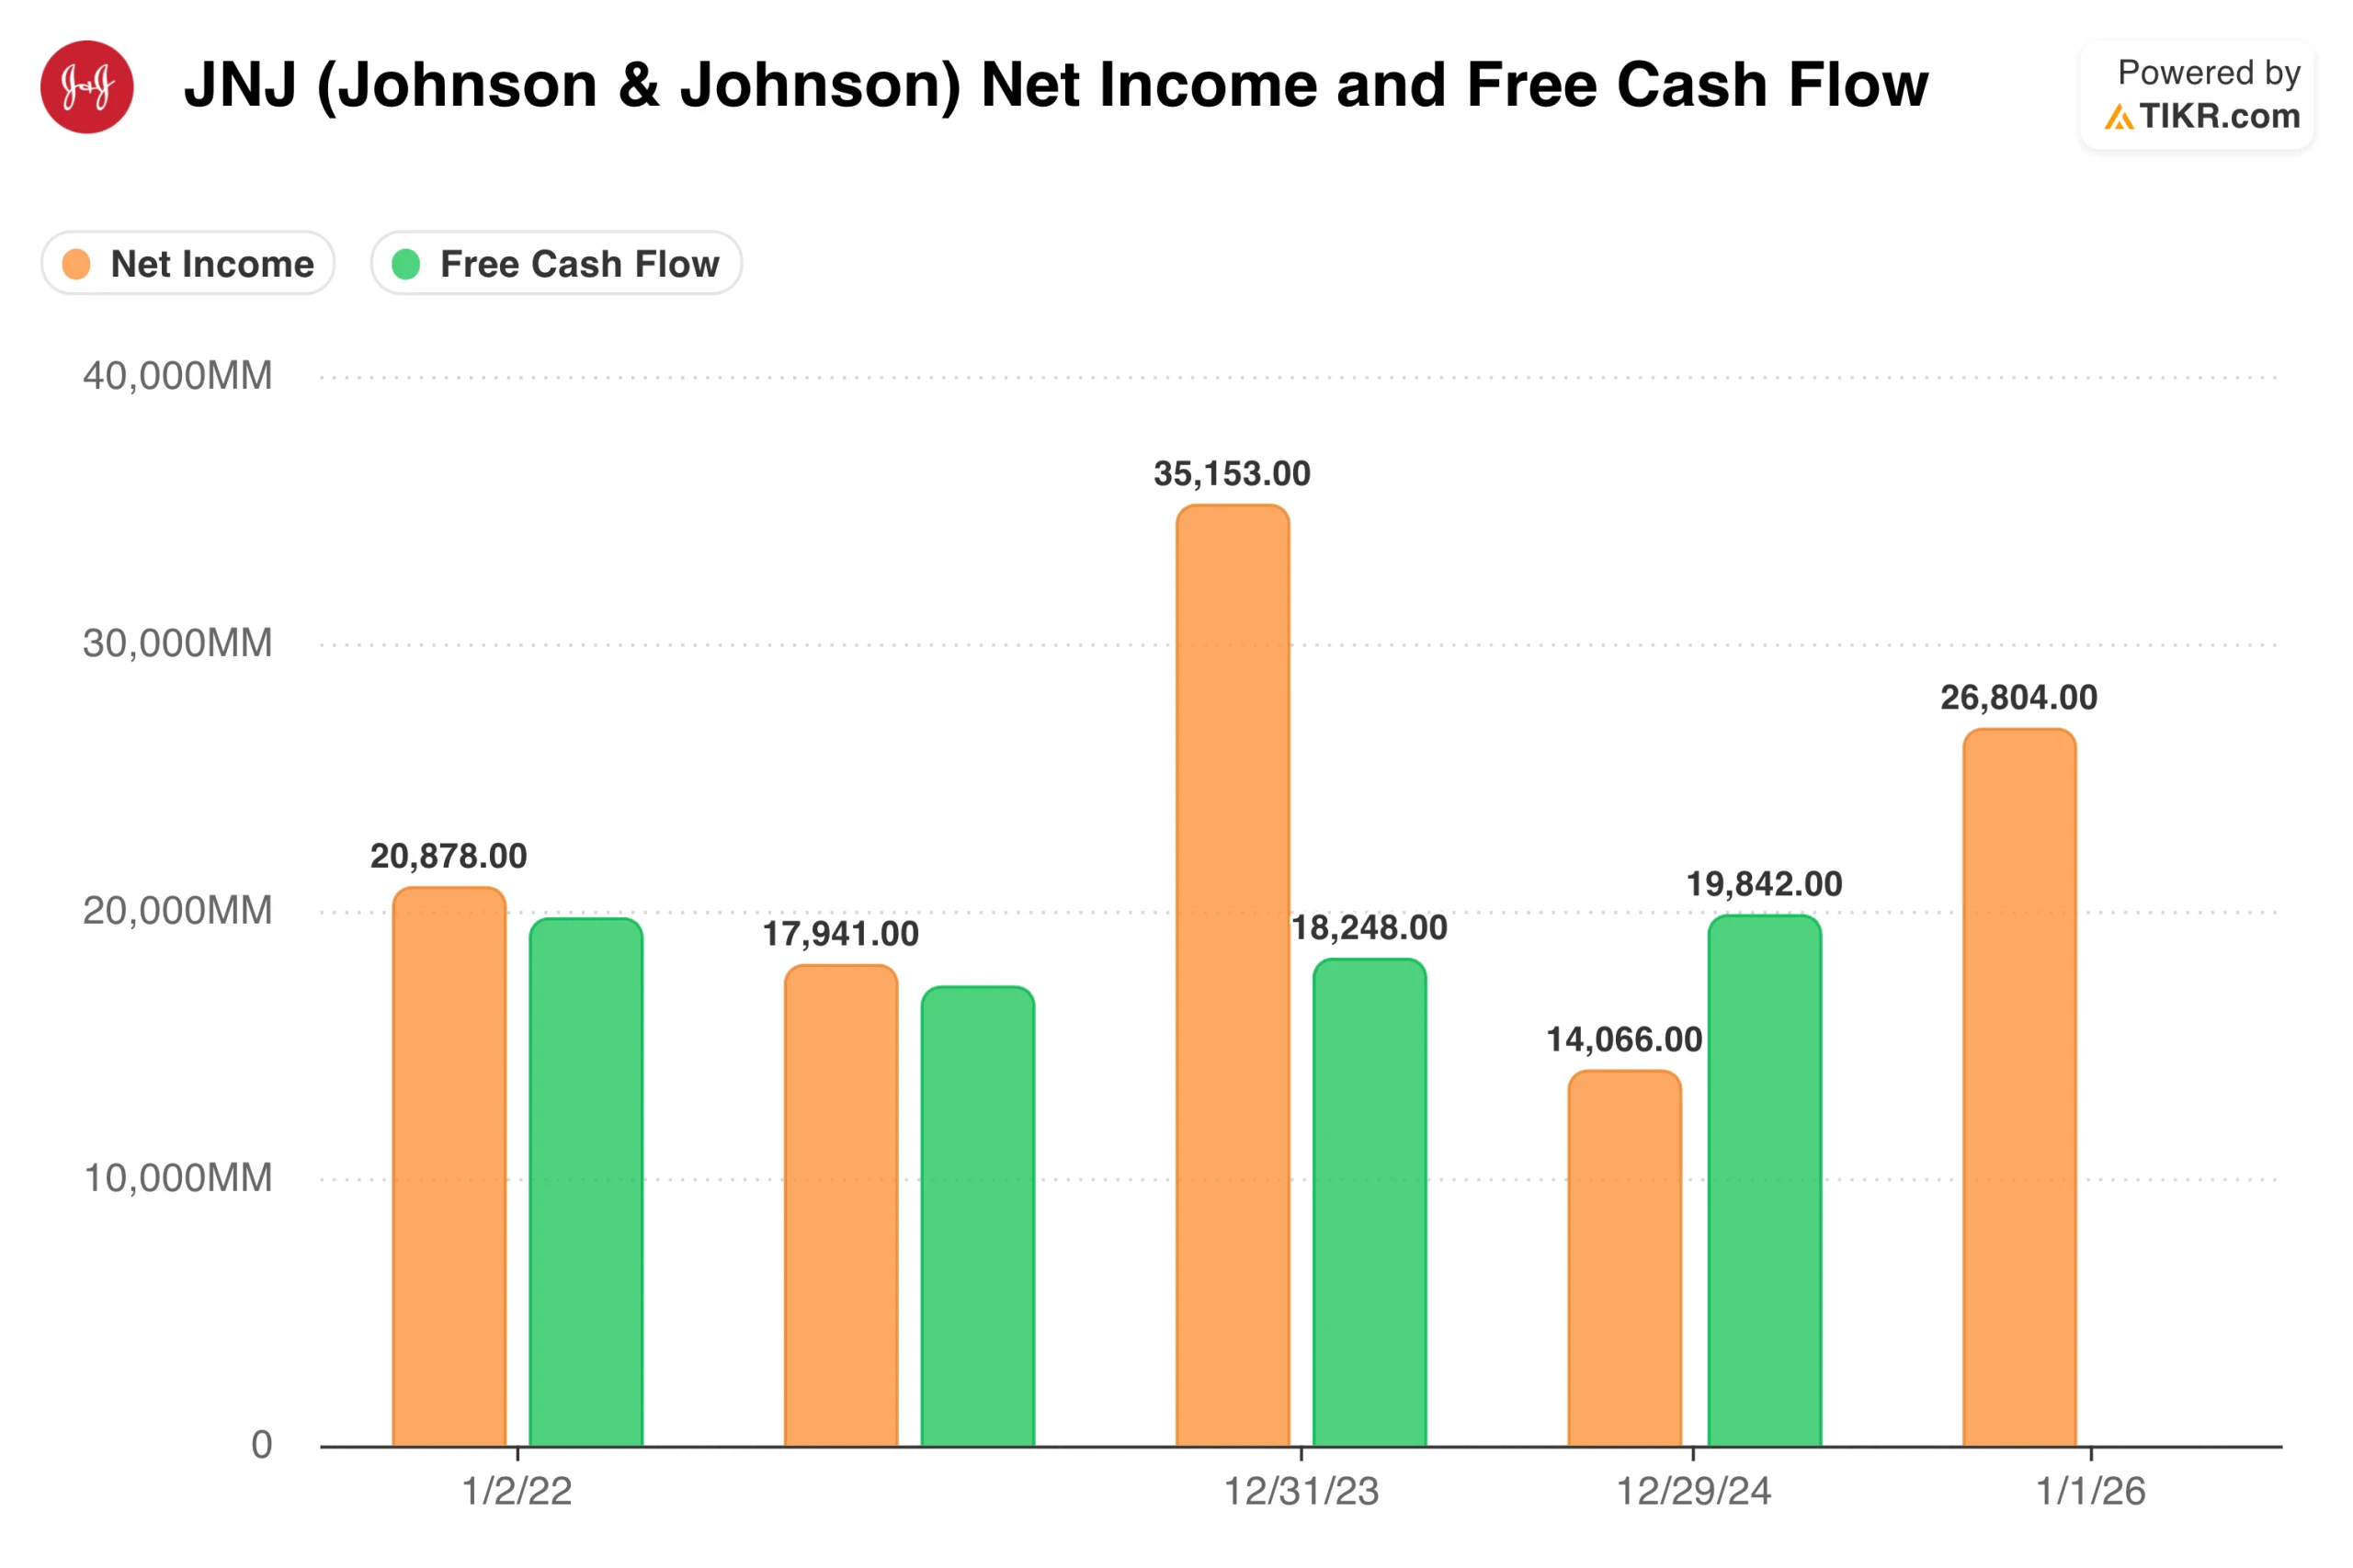
Watch for a growing gap between net income and operating cash flow. In a healthy business, these figures should track each other over time. Temporary divergences are normal, but a persistent pattern where earnings exceed cash flow suggests aggressive accounting or deteriorating business economics.
Free cash flow is particularly important. A company can report profits while burning cash if capital expenditures exceed depreciation or working capital consumes resources. If free cash flow has turned negative or declined significantly relative to earnings, the business may be in worse shape than the income statement suggests.
Examine what is consuming cash. Rising receivables suggest collection problems or aggressive revenue recognition. Rising inventory may indicate slowing demand or obsolete products. Increasing capital expenditure requirements suggest the business needs more investment just to maintain its position.
TIKR tip: Compare net income to operating cash flow and free cash flow in TIKR’s Cash Flow Statement. A healthy company should generate cash flow that meets or exceeds net income over any multi-year period.
Competitive Position Shifts
Fundamental deterioration often begins with competitive dynamics before showing up in financial statements. By the time margins compress or growth slows, the competitive damage may already be severe.
Monitor market share trends. A company losing share to competitors is seeing its competitive advantage erode in real time. Even if current financials look acceptable, market share losses typically precede revenue deceleration and margin pressure.
Watch for new entrants or disruptive technologies. An industry that was stable for decades can change rapidly when new competitors arrive with different business models or cost structures. If your investment thesis assumed limited competition, new entrants may invalidate that assumption.
Pay attention to customer concentration and retention. A business losing key customers or seeing retention rates decline is experiencing fundamental deterioration that will eventually show in the numbers. Management commentary on customer metrics often provides early warning before financial statements reflect the damage.
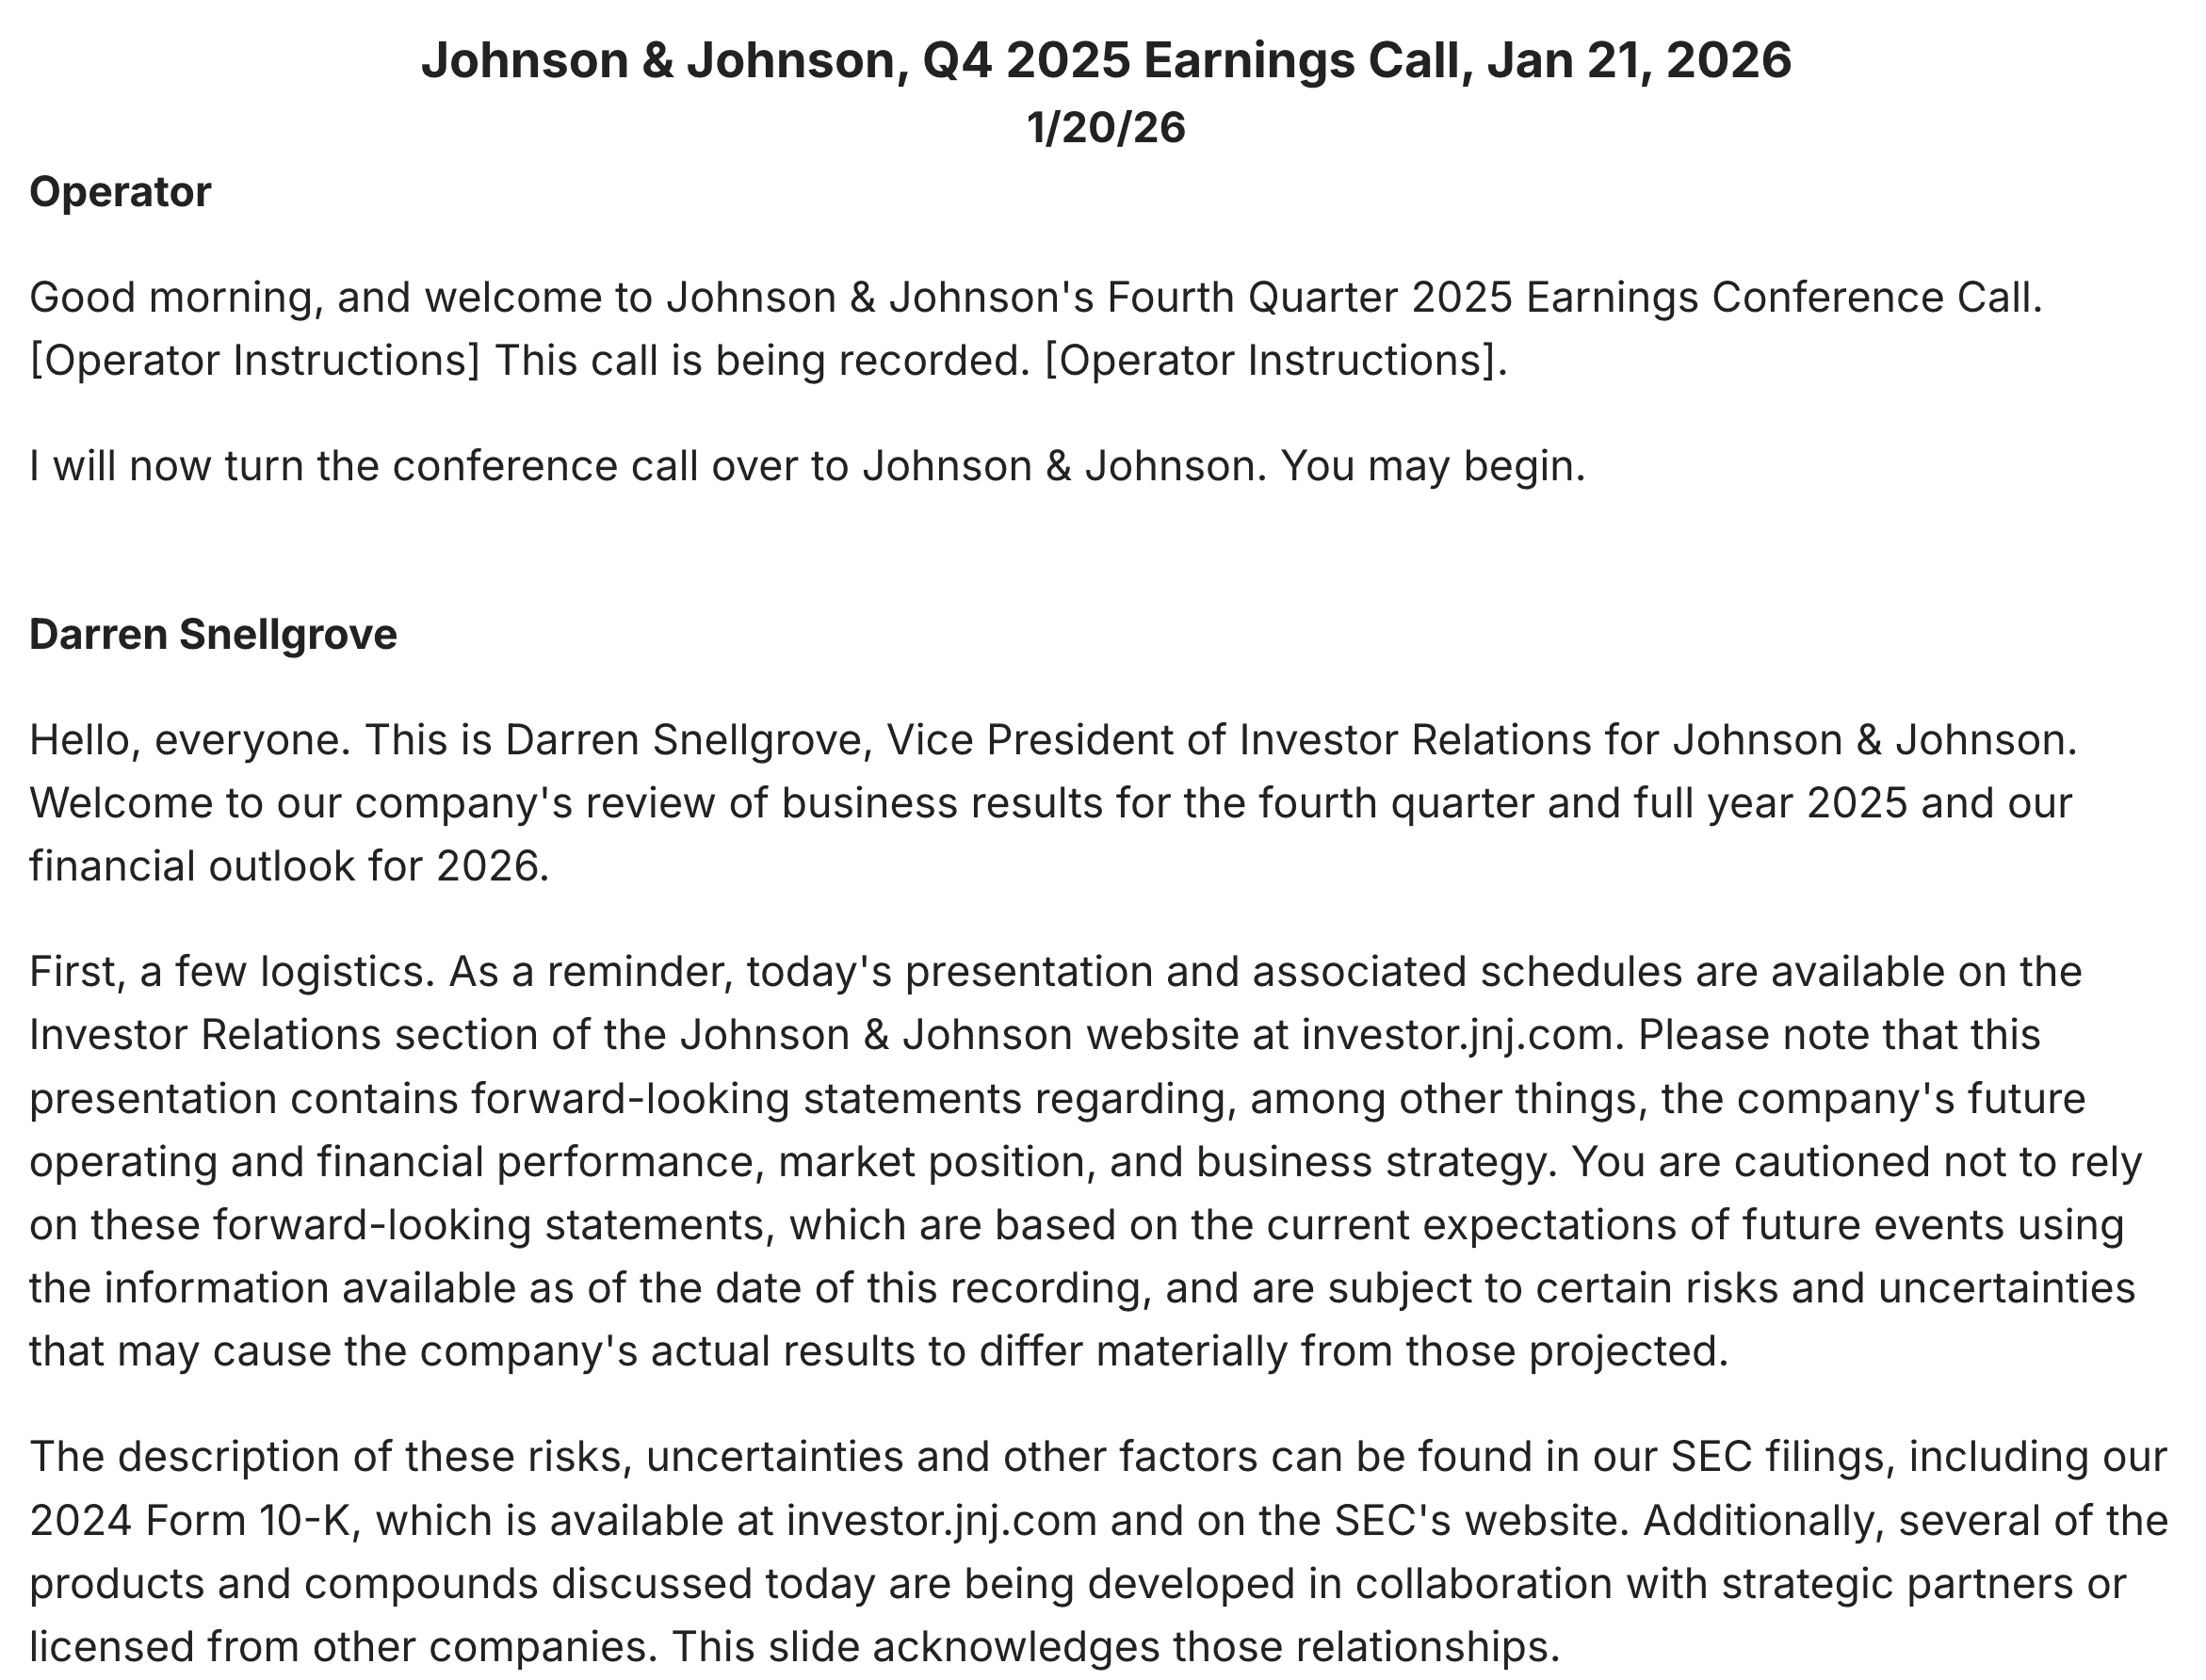
TIKR tip: Review earnings call transcripts in TIKR for management commentary on competitive dynamics, customer retention, and market share. These qualitative signals often precede quantitative deterioration.
How to Respond When Fundamentals Change
Recognizing deterioration is only half the challenge. You must also act on what you see. Many investors identify problems but delay action, hoping for a recovery that never comes.
When you spot concerning trends, revisit your original thesis. Are the assumptions that justified the purchase still valid? If revenue growth has fallen below your threshold, margins have compressed beyond your tolerance, or returns on capital have declined to unacceptable levels, the honest assessment is that the thesis has broken.
Do not wait for certainty. By the time deterioration is obvious to everyone, the stock price has usually already reflected the damage. Selling on early warning signs means accepting that you might be wrong. But the cost of selling a stock that later recovers is typically less than the cost of holding one that continues to deteriorate.
Consider whether the problems are fixable. Some fundamental deterioration is permanent, while some reflect temporary challenges that capable management can address. A company with a new CEO implementing a turnaround plan differs from one with structural industry decline. Be honest about which situation you face.
Sell in stages if you are uncertain. Reducing your position by half acknowledges the increased risk while maintaining some exposure if the situation improves. This middle path works when evidence is mixed, and conviction is shaken but not eliminated.
TIKR tip: Before selling, use TIKR to review the complete picture: financials, estimates, valuation, and insider activity. Confirm that multiple indicators point to fundamental deterioration rather than temporary noise.
The TIKR Takeaway
Selling when fundamentals change is one of the most important disciplines in investing. Holding a deteriorating business in the hope of recovery is how small losses become large ones. The key is to define your thesis clearly from the start and monitor the metrics that matter.
The warning signs are consistent: decelerating revenue growth, compressing margins, declining returns on capital, cash flow divergence from earnings, and weakening competitive position. Any one of these might be temporary. Multiple signals appearing together almost always indicate genuine deterioration.
TIKR makes monitoring straightforward by consolidating financials, ratios, estimates, and competitive comparisons into a single platform. You can track the metrics that underpin your thesis and recognize when they stop supporting your investment case.
The goal is not to trade frequently but to hold businesses only as long as they deserve your capital. When fundamentals change, intellectual honesty demands action. A disciplined approach to selling protects your portfolio from the slow erosion that comes from holding hope instead of quality.
Find undervalued stocks in less than 60 seconds with TIKR’s new Valuation Model (It’s free) >>>
Value Any Stock in Under 60 Seconds with TIKR
With TIKR’s new Valuation Model tool, you can estimate a stock’s potential share price in under a minute.
All it takes is three simple inputs:
- Revenue Growth
- Operating Margins
- Exit P/E Multiple
If you’re not sure what to enter, TIKR automatically fills in each input using analysts’ consensus estimates, giving you a quick, reliable starting point.
From there, TIKR calculates the potential share price and total returns under Bull, Base, and Bear scenarios so you can quickly see whether a stock looks undervalued or overvalued.
See a stock’s true value in under 60 seconds (Free with TIKR) >>>
Looking for New Opportunities?
- Discover which stocks billionaire investors are purchasing, so you can follow the smart money.
- Analyze stocks in as little as 5 minutes with TIKR’s all-in-one, easy-to-use platform.
- The more rocks you overturn… the more opportunities you’ll uncover. Search 100K+ global stocks, global top investor holdings, and more with TIKR.
Disclaimer:
Please note that the articles on TIKR are not intended to serve as investment or financial advice from TIKR or our content team, nor are they recommendations to buy or sell any stocks. We create our content based on TIKR Terminal’s investment data and analysts’ estimates. Our analysis might not include recent company news or important updates. TIKR has no position in any stocks mentioned. Thank you for reading, and happy investing!