

Key Stats
- Current Price: ~$12 (May 15, 2026 close)
- Q1 2026 Revenue: $5B+ (managerial framework, record for any first quarter; +42% YoY FX-neutral)
- Q1 2026 Net Income: $871M (+41% YoY FX-neutral; Q1 historical high)
- Q1 2026 Credit Portfolio: $37.2B (+40% YoY FX-neutral)
- Q1 2026 Total Customers: 135.2M (+14% YoY)
- Mexico Break-Even: Achieved Q1 2026 (first time)
- Efficiency Ratio: 17.6% reported; full-year 2026 target ~20%
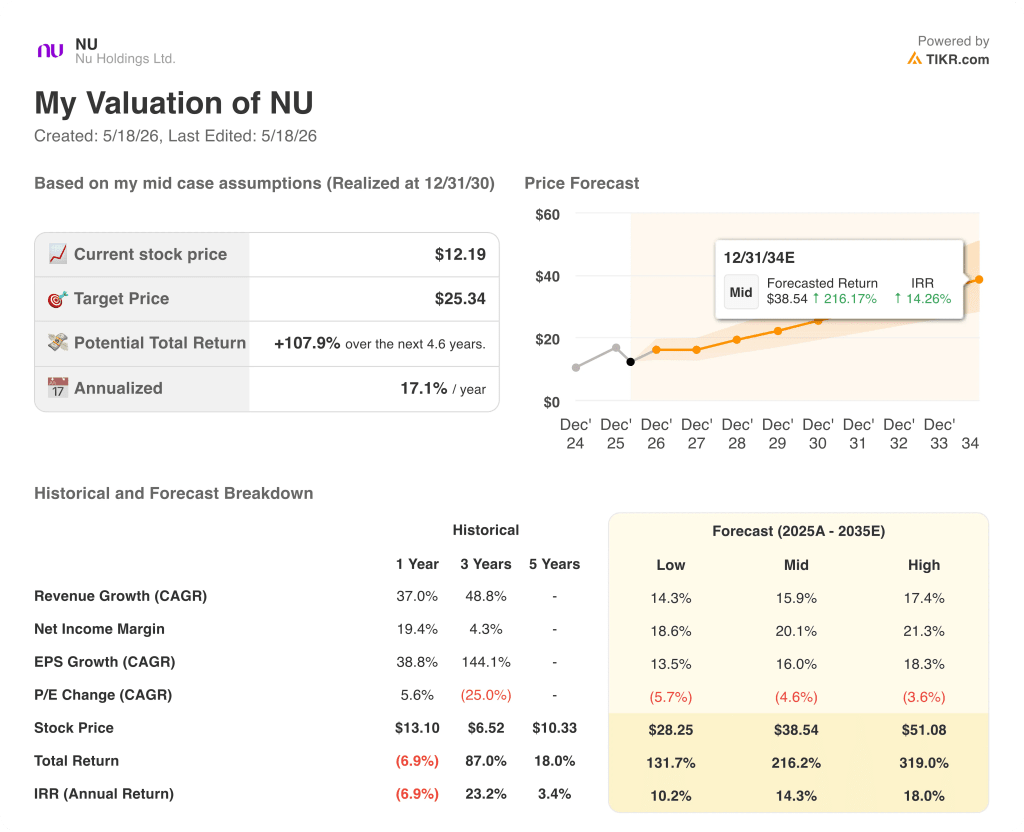
- TIKR Model Price Target: $25.34
- Implied Upside: ~108%
Nu Holdings Q1 2026 Earnings Breakdown
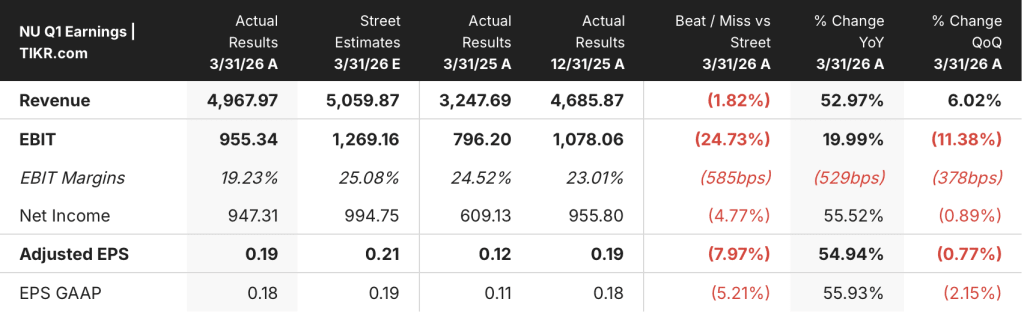
Nu Holdings stock (NU) posted a Q1 2026 net income of $871M, up 41% year-over-year on an FX-neutral basis and the highest first-quarter figure in the company’s history.
Revenue crossed $5B for the first time in any single quarter, according to CEO David Velez on the Q1 2026 earnings call, a record driven by continued ARPAC expansion and portfolio growth.
The credit portfolio reached $37.2B at quarter-end, up 40% year-over-year on an FX-neutral basis, with unsecured lending growing 53% to $10B and credit cards expanding 36%, according to CFO Guilherme Lago on the Q1 2026 earnings call.
The headline that rattled the market: Nu Holdings stock fell nearly 9% in after-hours trading on the earnings release before trimming losses to roughly 3% by the end of the call.
The driver was a $1.79B credit loss allowance, up 33% quarter-over-quarter on an FX-neutral basis, which pushed risk-adjusted net interest margin down 100 basis points sequentially to 9.5%, according to CFO Lago on the Q1 2026 earnings call.
Lago attributed the CLA build to three distinct dynamics: first-quarter seasonality (responsible for $267M of the $800M quarter-over-quarter increase in ECL allowance), portfolio growth (responsible for $423M, more than half the total build), and product mix shifting further toward higher-loss unsecured products, according to his remarks on the Q1 2026 earnings call.
The 15-to-90-day NPL ratio rose to 5.0% from 4.1% at year-end, while the 90-plus day NPL ratio actually declined to 6.5% from 6.6%, according to CFO Lago on the Q1 2026 earnings call.
Mexico reached break-even for the first time in Q1 2026, a milestone Velez described as arriving ahead of the company’s own internal plan, with the business now serving more than 15 million customers.
Nu Holdings stock now commands the position of third-largest financial institution in Mexico by customer count, according to CEO Velez on the Q1 2026 earnings call, while Brazil surpassed 115 million customers to become the largest private financial institution in the country.
The efficiency ratio came in at 17.6% reported and 16.6% at the core, a record low, though Lago noted on the Q1 2026 earnings call that roughly two-thirds of the quarter’s outperformance reflected timing items (marketing and real estate phasing) that will normalize in subsequent quarters.
Management guided for the full-year 2026 consolidated efficiency ratio to land at approximately 20%, consistent with where the company finished 2025, according to CFO Lago on the Q1 2026 earnings call.
On U.S. expansion, Velez confirmed the company will proceed at a measured pace, with maximum OpEx headwind from U.S. investment capped at below 100 basis points of the consolidated efficiency ratio in each of 2026 and 2027, according to his remarks on the Q1 2026 earnings call.
Nu also announced a $4.2B strategic investment plan in its Mexican operations through 2030, with full banking operations in Mexico scheduled to begin in 2026 once the banking regulator’s audit over the banking license is finalized.
Nu Holdings Stock: What the Financials Show
The Q1 2026 income statement reflects an institution that is generating strong top-line momentum while absorbing elevated provisioning costs that have compressed net revenue in the near term.

Net interest income reached $3.01B in Q1 2026, up from $2.62B in Q4 2025 and $1.84B in Q1 2025, continuing a step-up pattern that has run without interruption across the past eight quarters shown in the screenshot.
Revenues before provision for loan losses rose to $3.70B in Q1 2026 from $3.31B in Q4 2025, up from $2.35B a year ago, reflecting both NIM expansion and non-interest income stability.
The provision for loan losses, however, climbed to $1.72B in Q1 2026 from $1.24B in Q4 2025 and $970M in Q1 2025, the largest single-quarter provision figure across the eight periods visible in the screenshot.
Total revenues after provision settled at $1.98B, up 44% year-over-year but down from $2.07B in Q4 2025, as the provision build more than offset the gross revenue gain.
Non-interest income held flat at $690M in Q1 2026, unchanged from Q4 2025, reflecting the diversification Lago referenced on the Q1 2026 earnings call between credit, float, and fee income streams.
What Does the Valuation Model Say?
The TIKR model prices Nu Holdings stock at $25.34 against a current price of ~$12, implying roughly 108% upside over the next 4.6 years, or approximately 17% annualized.
The mid-case assumptions underpinning that target are a revenue CAGR of 15.9% and a net income margin of 20.1% from 2025 through 2035, according to the TIKR valuation model.
Q1’s provision spike is exactly the kind of near-term noise that creates a gap between price and model value: the core revenue engine printed a record quarter while the headline net income figure absorbed a seasonal CLA build that management expects to normalize as the year progresses.
Nu Holdings stock enters the back half of 2026 with Mexico at break-even, an efficiency ratio well inside the 20% full-year target, and a credit book that management says is provisioned ahead of new NPL formation at 153.8% gross CLA coverage, according to CFO Lago on the Q1 2026 earnings call.
On the evidence presented, the investment case is stronger than the after-hours reaction suggested.
The debate for Nu Holdings stock hinges on whether the Q1 provisioning surge is a seasonal reset or the first signal of credit cycle pressure in Brazil.
Bull Case
- The 90-plus day NPL ratio fell 10 basis points sequentially to 6.5%, well below the 7% peak reached in Q3 2024, indicating late-stage delinquency is improving even as early-stage seasonal metrics rise.
- Portfolio growth alone contributed $423M of the $800M ECL build, more than half, which is a mechanical IFRS 9 effect of book expansion rather than any change in underlying credit quality, according to CFO Lago on the Q1 2026 earnings call.
- Mexico reached break-even ahead of internal plan, opening a second large earnings contributor with a profit pool management estimates above $40B in annual gross profit and Nu’s current share below 1%.
- Gross CLA coverage stands at 153.8% of new 90-plus NPL formation, meaning provisions are running ahead of delinquency formation and the balance sheet carries a material buffer into potential credit stress, according to CFO Lago on the Q1 2026 earnings call.
Bear Case
- The 15-to-90-day NPL ratio rose 89 basis points sequentially to 5.0%, and while management attributes 65 basis points to seasonality, 17 basis points came from intentional risk expansion in higher-loss unsecured segments, an ongoing structural choice rather than a one-time effect.
- Unsecured lending and credit cards accounted for 98% of new exposure added in Q1 2026, up from 88% a year prior, concentrating the book further in higher-expected-loss products at exactly the point Brazil’s household debt service ratios are elevated.
- Risk-adjusted NIM compressed 100 basis points sequentially to 9.5%, and while management expects a recovery toward second-half 2025 levels, any further credit cycle deterioration in Brazil would extend that compression rather than reverse it.
- The full-year efficiency ratio target of approximately 20% assumes U.S. expansion costs remain below 100 basis points and timing OpEx normalizes; if either assumption slips, net income trajectory absorbs a double headwind.
Should You Invest in Nu Holdings Ltd.?
The only way to really know is to look at the numbers yourself. TIKR gives you free access to the same institutional-quality financial data that professional analysts use to answer exactly that question.
Pull up Nu Holdings stock and you’ll see years of historical financials, what Wall Street analysts expect for revenue and earnings in the quarters ahead, how valuation multiples have moved over time, and whether price targets are trending up or down.
You can build a free watchlist to track Nu Holdings stock alongside every other stock on your radar. No credit card required. Just the data you need to decide for yourself.
Access Professional Tools to Analyze NU stock on TIKR for Free →


