
Key Stats for NFLX Stock
- Past week’s performance: -2%
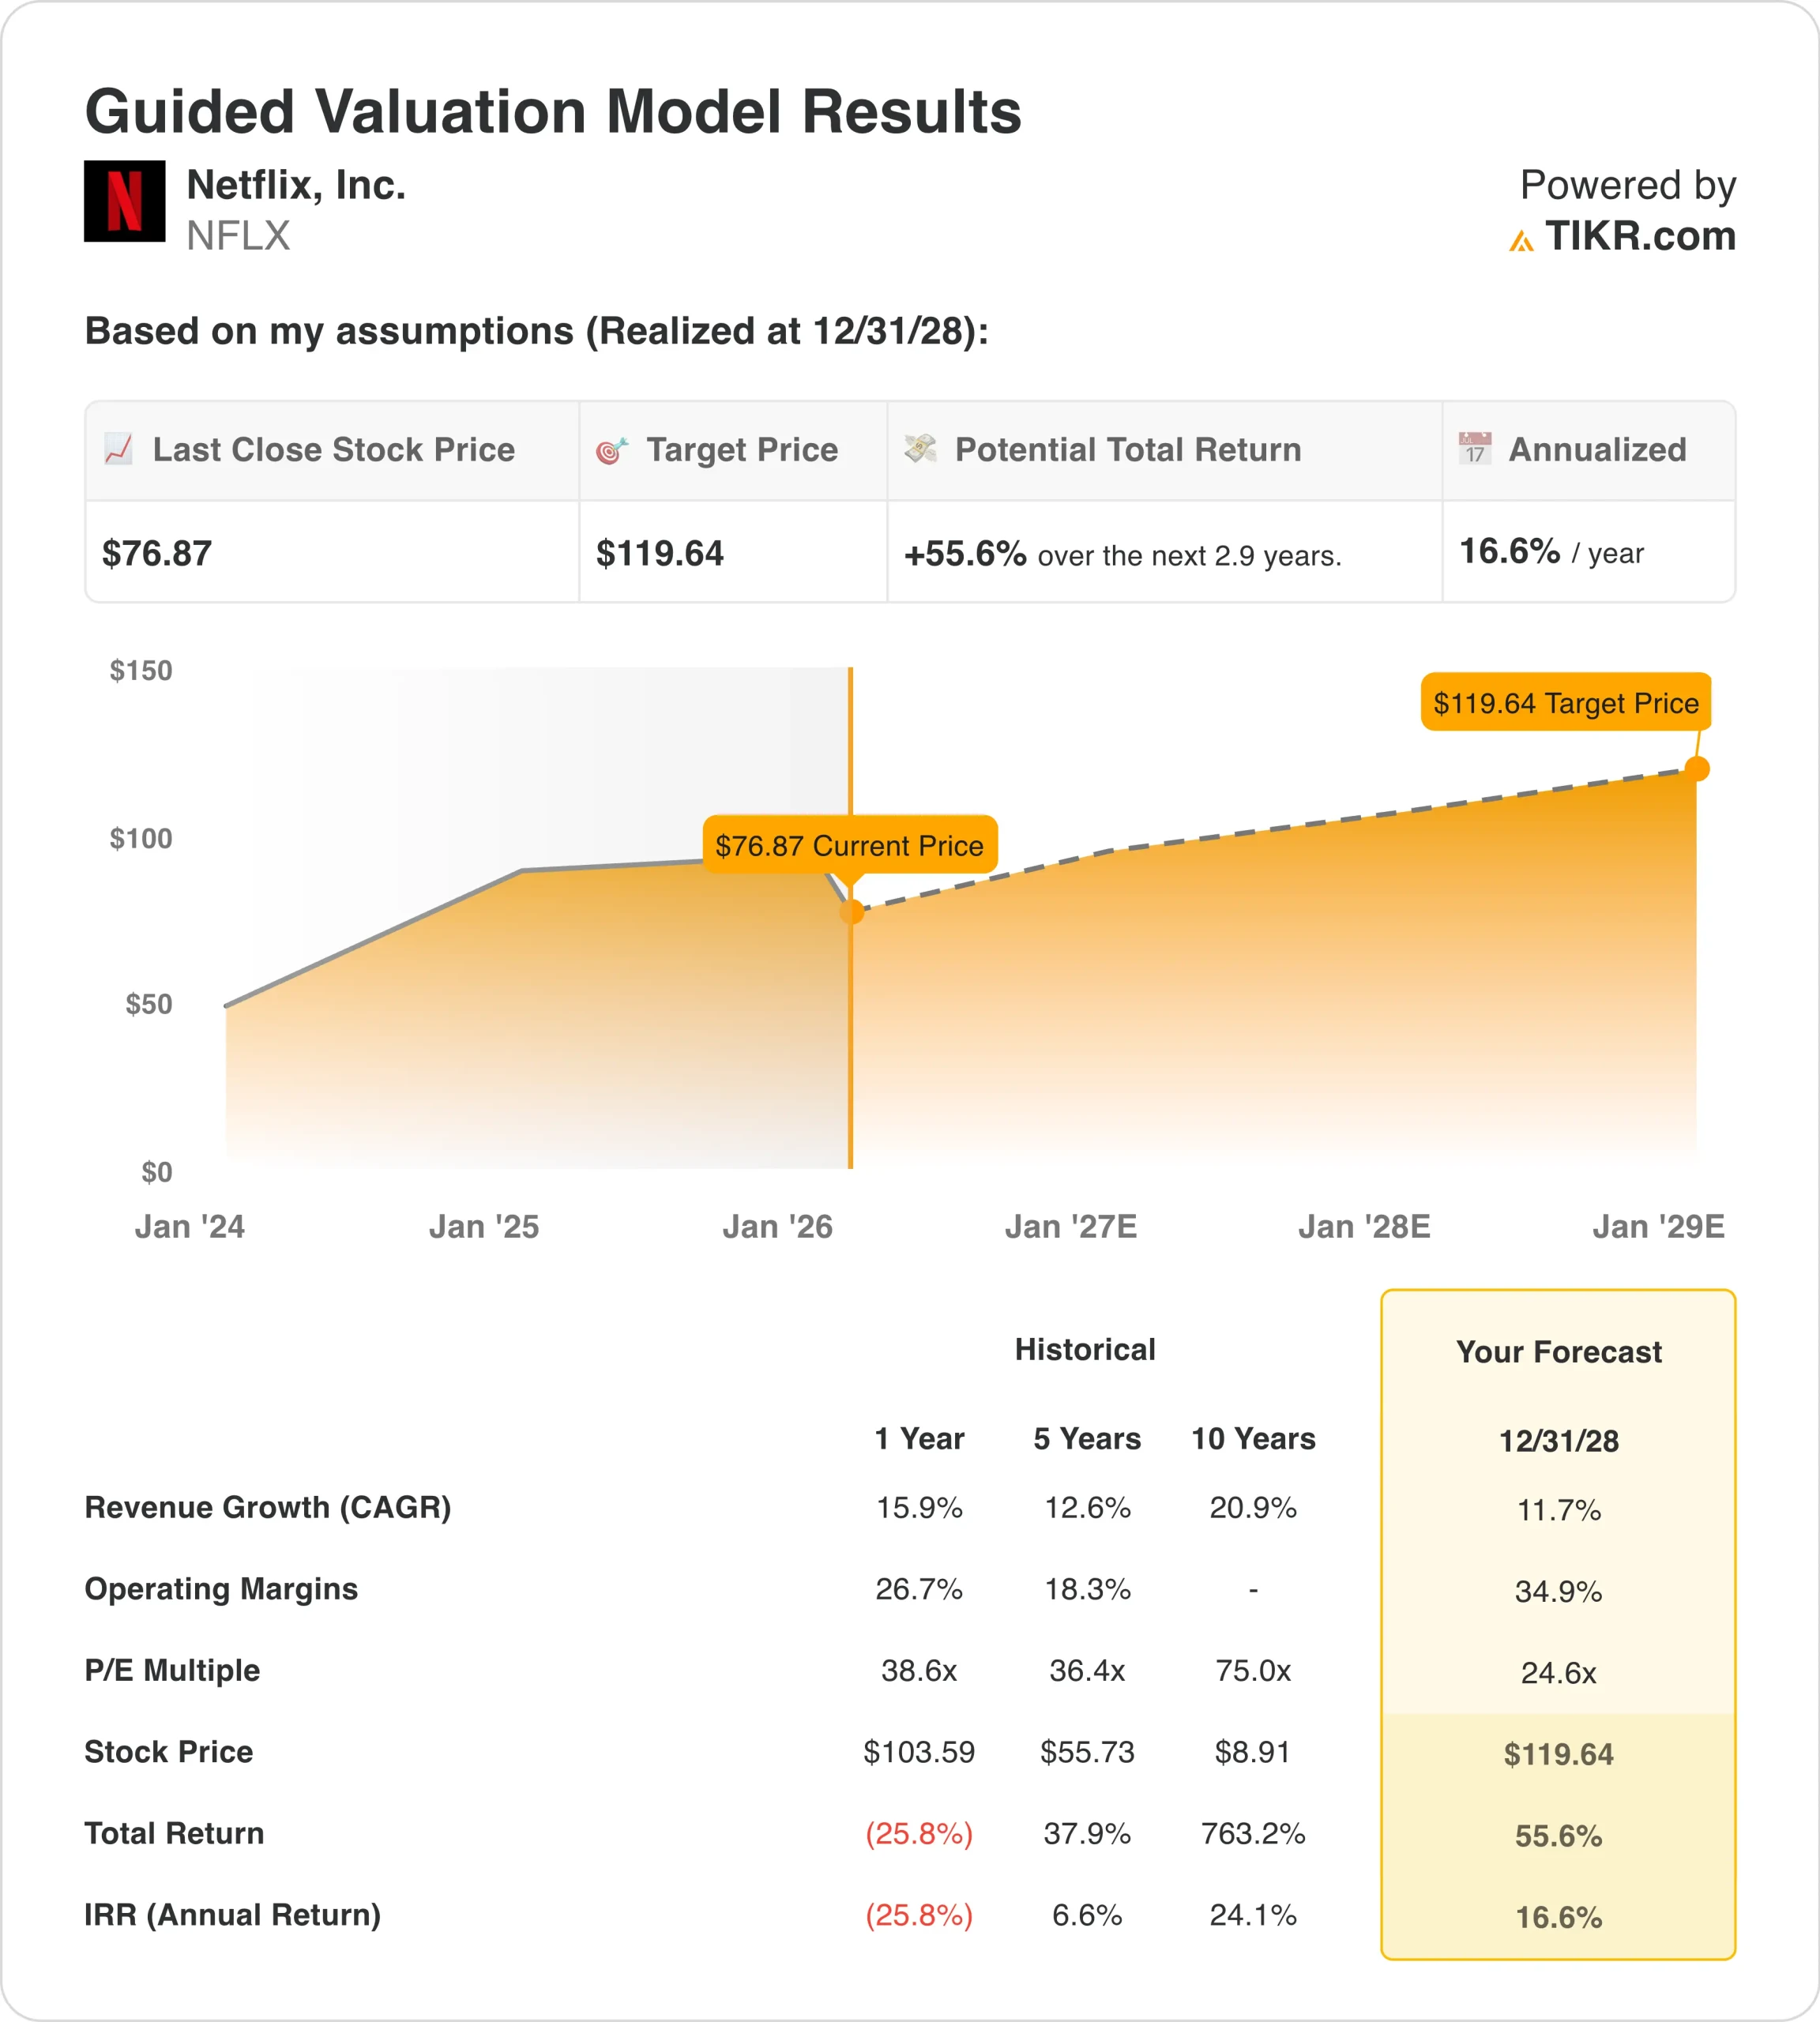
- 52-week range: $75 to $134
- Valuation model target price: $120
- Implied upside: 55.6% over 2.9 years
Value your favorite stocks like PACCAR with 5 years of analysts’ forecasts using TIKR’s new Valuation Model (It’s free) >>>
What Happened?
Netflix (NFLX) stock traded lower this week, with shares recently around $77, as investors digested earnings and broader media-sector developments.
The pullback followed Netflix’s Q4 earnings report on January 20, where results modestly beat expectations but did not reset near-term sentiment. Revenue grew 18% year over year to $12.1 billion, while operating income rose 30% year over year, reflecting continued margin expansion.
However, the stock declined after earnings because recent gains had already priced in much of the margin improvement. The shares also faced pressure as investors rotated away from large-cap media names amid uncertainty tied to industry consolidation and regulatory scrutiny.
News flow during the week remained focused on potential media mergers, including reports around Warner Bros. Discovery and Paramount, which indirectly affected Netflix sentiment. Additionally, headlines around U.S. antitrust investigations into large streaming platforms added to short-term caution.
Importantly, Netflix did not change guidance, subscriber trends, or its long-term strategy during the week. The recent move reflects valuation sensitivity and broader sector noise rather than any deterioration in Netflix’s underlying business.
See analysts’ growth forecasts and price targets for NFLX (It’s free) >>>
Is NFLX Stock Undervalued?
Under the valuation model assumptions realized through 2028, the stock is modeled using:
- Revenue growth (CAGR): 11.7%
- Operating margins: 34.9%
- Exit P/E multiple: 24.6x
Based on these inputs, the model estimates a target price of $119.64, implying a 55.6% total return from the current share price and a 16.6% annualized return over the next 2.9 years.
Netflix’s outlook continues to be supported by steady revenue growth and improving profitability. Trailing twelve-month revenue reached $45.2 billion, up 16% year over year, while operating margins expanded to nearly 30% as content spending discipline improved.
Free cash flow also strengthened, with Netflix generating $9.5 billion over the last twelve months. The company used that cash primarily for share repurchases, buying back over $9 billion of stock in 2025.
Balance sheet strength remains solid. Netflix ended the period with about $9.1 billion in cash and short-term investments, while long-term debt declined modestly to $13.5 billion.
Looking ahead, analysts expect revenue growth to remain in the low-to-mid teens through 2027, while EBITDA and EPS are projected to grow faster due to operating leverage. That dynamic explains why the stock can remain volatile in the short term, even as longer-term fundamentals remain intact.
Estimate a company’s fair value instantly (Free with TIKR) >>>
Value Any Stock in Under 60 Seconds (It’s Free)
With TIKR’s new Valuation Model tool, you can estimate a stock’s potential share price in under a minute.
All it takes is three simple inputs:
- Revenue Growth
- Operating Margins
- Exit P/E Multiple
From there, TIKR calculates the potential share price and total returns under Bull, Base, and Bear scenarios so you can quickly see whether a stock looks undervalued or overvalued.
If you’re not sure what to enter, TIKR automatically fills in each input using analysts’ consensus estimates, giving you a quick, reliable starting point.
See a stock’s true value in under 60 seconds (Free with TIKR) >>>