
Key Stats for TEX Stock
- Price Change for TEX stock: +16.6%
- TEX Share Price as of Feb. 11: $69
- 52-Week High: $69.65
- TEX Stock Price Target: $65
Now Live: Discover how much upside your favorite stocks could have using TIKR’s new Valuation Model (It’s free)>>>
What Happened?
Terex (TEX) stock surged after the company reported fourth-quarter earnings that exceeded analyst expectations, driven primarily by a sharp improvement in profitability despite revenue coming in slightly below consensus forecasts.
Adjusted EPS came in at $1.50, which exceeded analyst estimates of about $1.21, reflecting stronger operating leverage and better-than-expected cost control across the business.
Revenue totaled roughly $1.39 billion for the quarter, which missed estimates by a modest margin, but investors focused more heavily on margin performance rather than top-line growth.
EBITDA margins expanded by more than 300 basis points year over year, as pricing discipline, operational efficiencies, and lower input cost pressure combined to lift profitability.
Management also highlighted a significant improvement in bookings, which rose 32% year over year, signaling healthier demand trends and improved visibility into future revenue.
In addition, Terex completed the sale of its Midwest recreational vehicle business, a move that simplified the company’s portfolio and allowed management to focus more closely on its core materials processing and aerial work platform segments.
Together, these developments helped ease concerns around cyclical pressure and supported the sharp move higher in the stock.
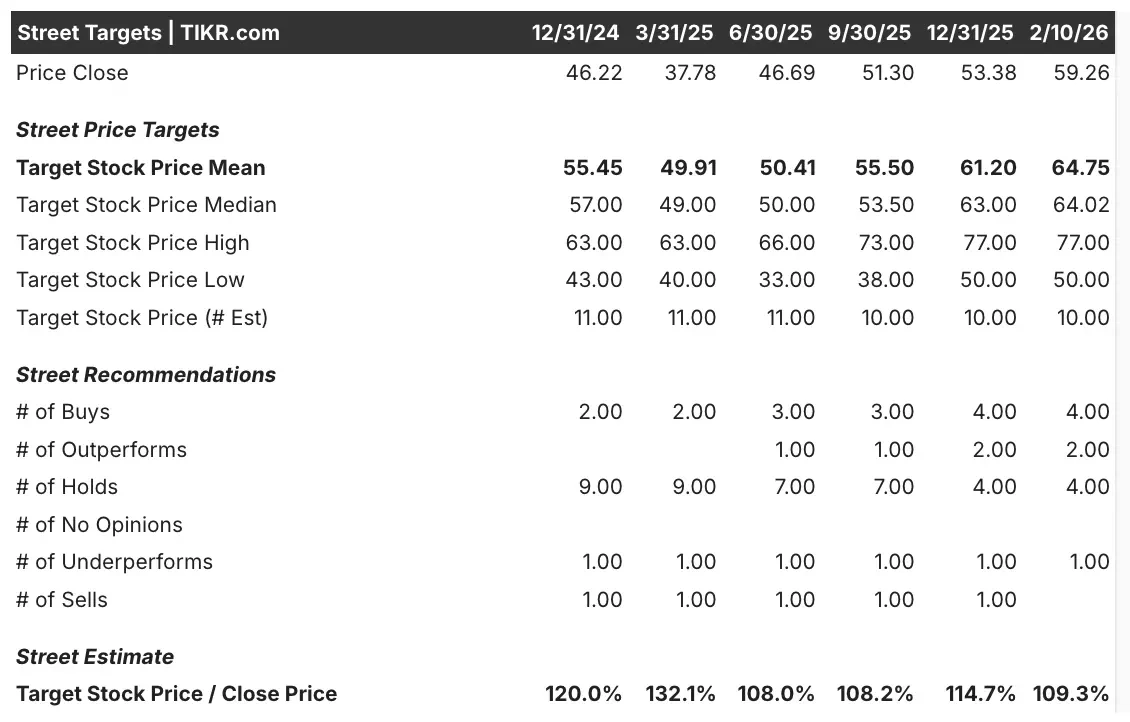
See analysts’ growth forecasts and price targets for TEX stock (It’s free!) >>>
What the Market Is Telling Us About TEX Stock
The strong rally in Terex stock suggests that investors are increasingly confident in the company’s ability to stabilize earnings through margin expansion, even as revenue growth remains relatively modest.
On a trailing twelve-month basis, Terex reports a gross margin near 19% and an operating margin of roughly 8%, both of which reflect meaningful improvement compared to earlier periods.
Operating efficiency has improved as selling, general, and administrative expenses declined as a percentage of revenue, helping offset slower growth in certain end markets.
Terex generated approximately $412 million in operating cash flow over the past year, demonstrating solid cash generation even as capital expenditures remained elevated.
Free cash flow remains positive, which supports ongoing dividends and provides flexibility for debt management.
However, leverage has increased following recent acquisitions, with net debt totaling about $2.1 billion, or roughly 3.3x EBITDA.
While this level of leverage is manageable, it does limit flexibility if end-market demand weakens unexpectedly.
Demand conditions remain mixed, with construction activity holding steady while equipment replacement cycles remain uneven across regions.
Estimate a company’s fair value instantly (Free with TIKR) >>>
How Much Upside Does TEX Stock Have From Here?
With TIKR’s new Valuation Model tool, you can estimate a stock’s potential share price in under a minute.
All it takes is three simple inputs:
- Revenue Growth
- Operating Margins
- Exit P/E Multiple
If you’re not sure what to enter, TIKR automatically fills in each input using analysts’ consensus estimates, giving you a quick, reliable starting point.
From there, TIKR calculates the potential share price and total returns under Bull, Base, and Bear scenarios so you can quickly see whether a stock looks undervalued or overvalued.
See a stock’s true value in under 60 seconds (Free with TIKR) >>>
Looking for New Opportunities?
- See what stocks billionaire investors are buying so you can follow the smart money.
- Analyze stocks in as little as 5 minutes with TIKR’s all-in-one, easy-to-use platform.
- The more rocks you overturn… the more opportunities you’ll uncover. Search 100K+ global stocks, global top investor holdings, and more with TIKR.
Disclaimer:
Please note that the articles on TIKR are not intended to serve as investment or financial advice from TIKR or our content team, nor are they recommendations to buy or sell any stocks. We create our content based on TIKR Terminal’s investment data and analysts’ estimates. Our analysis might not include recent company news or important updates. TIKR has no position in any stocks mentioned. Thank you for reading, and happy investing!