
Key Stats for Bank of New York Mellon Stock
- 6-Month Performance: 16%
- 52-Week Range: $70 to $129
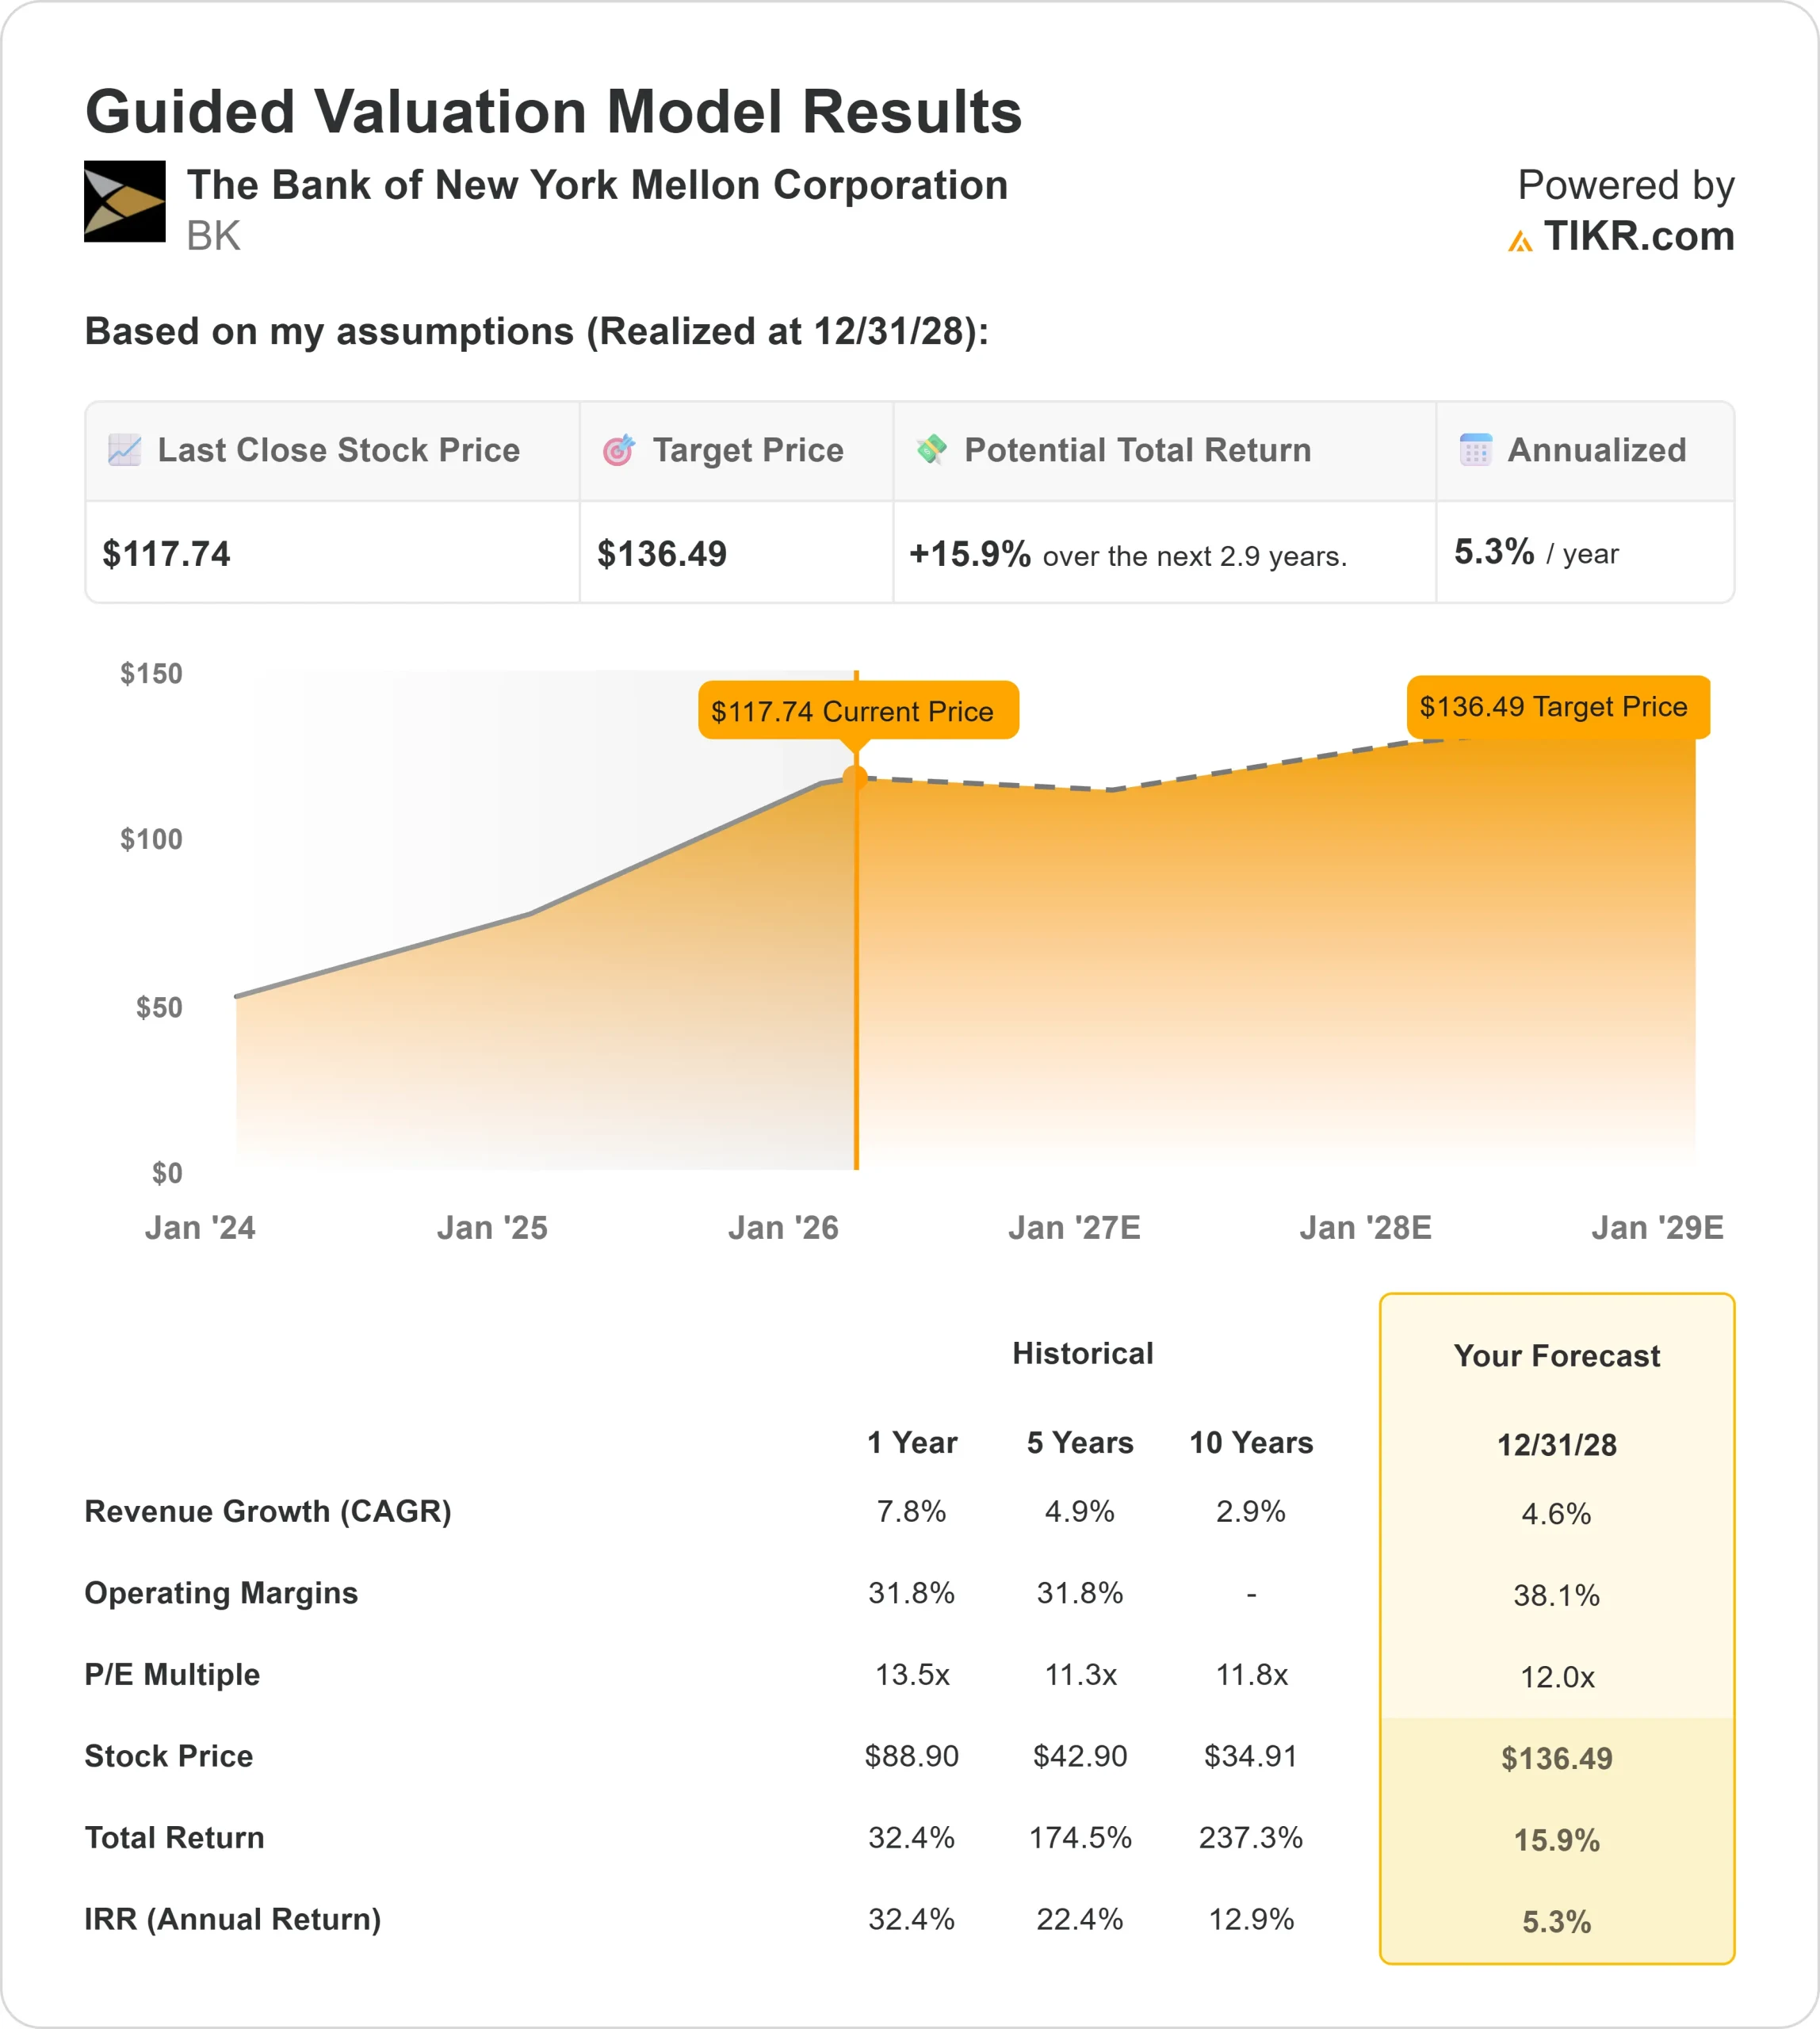
- Valuation Model Target Price: $136
- Implied Upside: 16%
Value your favorite stocks like The Bank of New York Mellon Corporation with 5 years of analysts’ forecasts using TIKR’s new Valuation Model (It’s free) >>>
What Happened?
The Bank of New York Mellon Corporation stock is up about 16% in the last 6 months, finishing near $118 per share as investors rewarded consistent execution, improving efficiency, and durable fee growth.
Shares have steadily climbed toward the upper end of their 52-week range, reflecting growing confidence in the firm’s structural transformation rather than short-term rate speculation.
The stock moved higher because investors gained confidence in BNY’s ability to expand profitability through disciplined expense control and stronger cross-selling across its platform.
Over the past three years, expense growth improved from 8% in 2022 to 2.7%, flat, 1%, and 3%, while organic fee growth reached 3.2% last year with 10% of sales coming from new logos and a 64% increase in clients purchasing three or more products.
That improvement in cost discipline and client penetration suggests earnings growth is becoming more structural and less tied to interest rate swings.
At the Bank of America Financial Services Conference, CFO Dermot McDonogh highlighted that 80% of employees are now aligned under the firm’s platform operating model, with the remaining 20% transitioning this year, and said the company is “only getting started on the platform operating model.”
Management reiterated that deposits are expected to remain relatively flat this year, supporting net interest income stability while the firm expands cross-platform integration, AI-driven capacity creation, and digital asset initiatives.
Institutional positioning has remained active. Todd Asset Management increased its stake by 126.1% to 269,856 shares, Varma Mutual Pension Insurance Co boosted its holdings by 22% to 168,590 shares, and Illinois Municipal Retirement Fund raised its position by 23.9% to 364,870 shares.
While some firms trimmed exposure, institutional investors and hedge funds still own about 85.31% of the stock, reflecting continued professional ownership and long-term conviction in BNY’s execution story.
Is Bank of New York Mellon Undervalued?
Under valuation assumptions, the stock is modeled using:
- Revenue Growth (CAGR): 4.6%
- Operating Margins: 38.1%
- Exit P/E Multiple: 12.0x
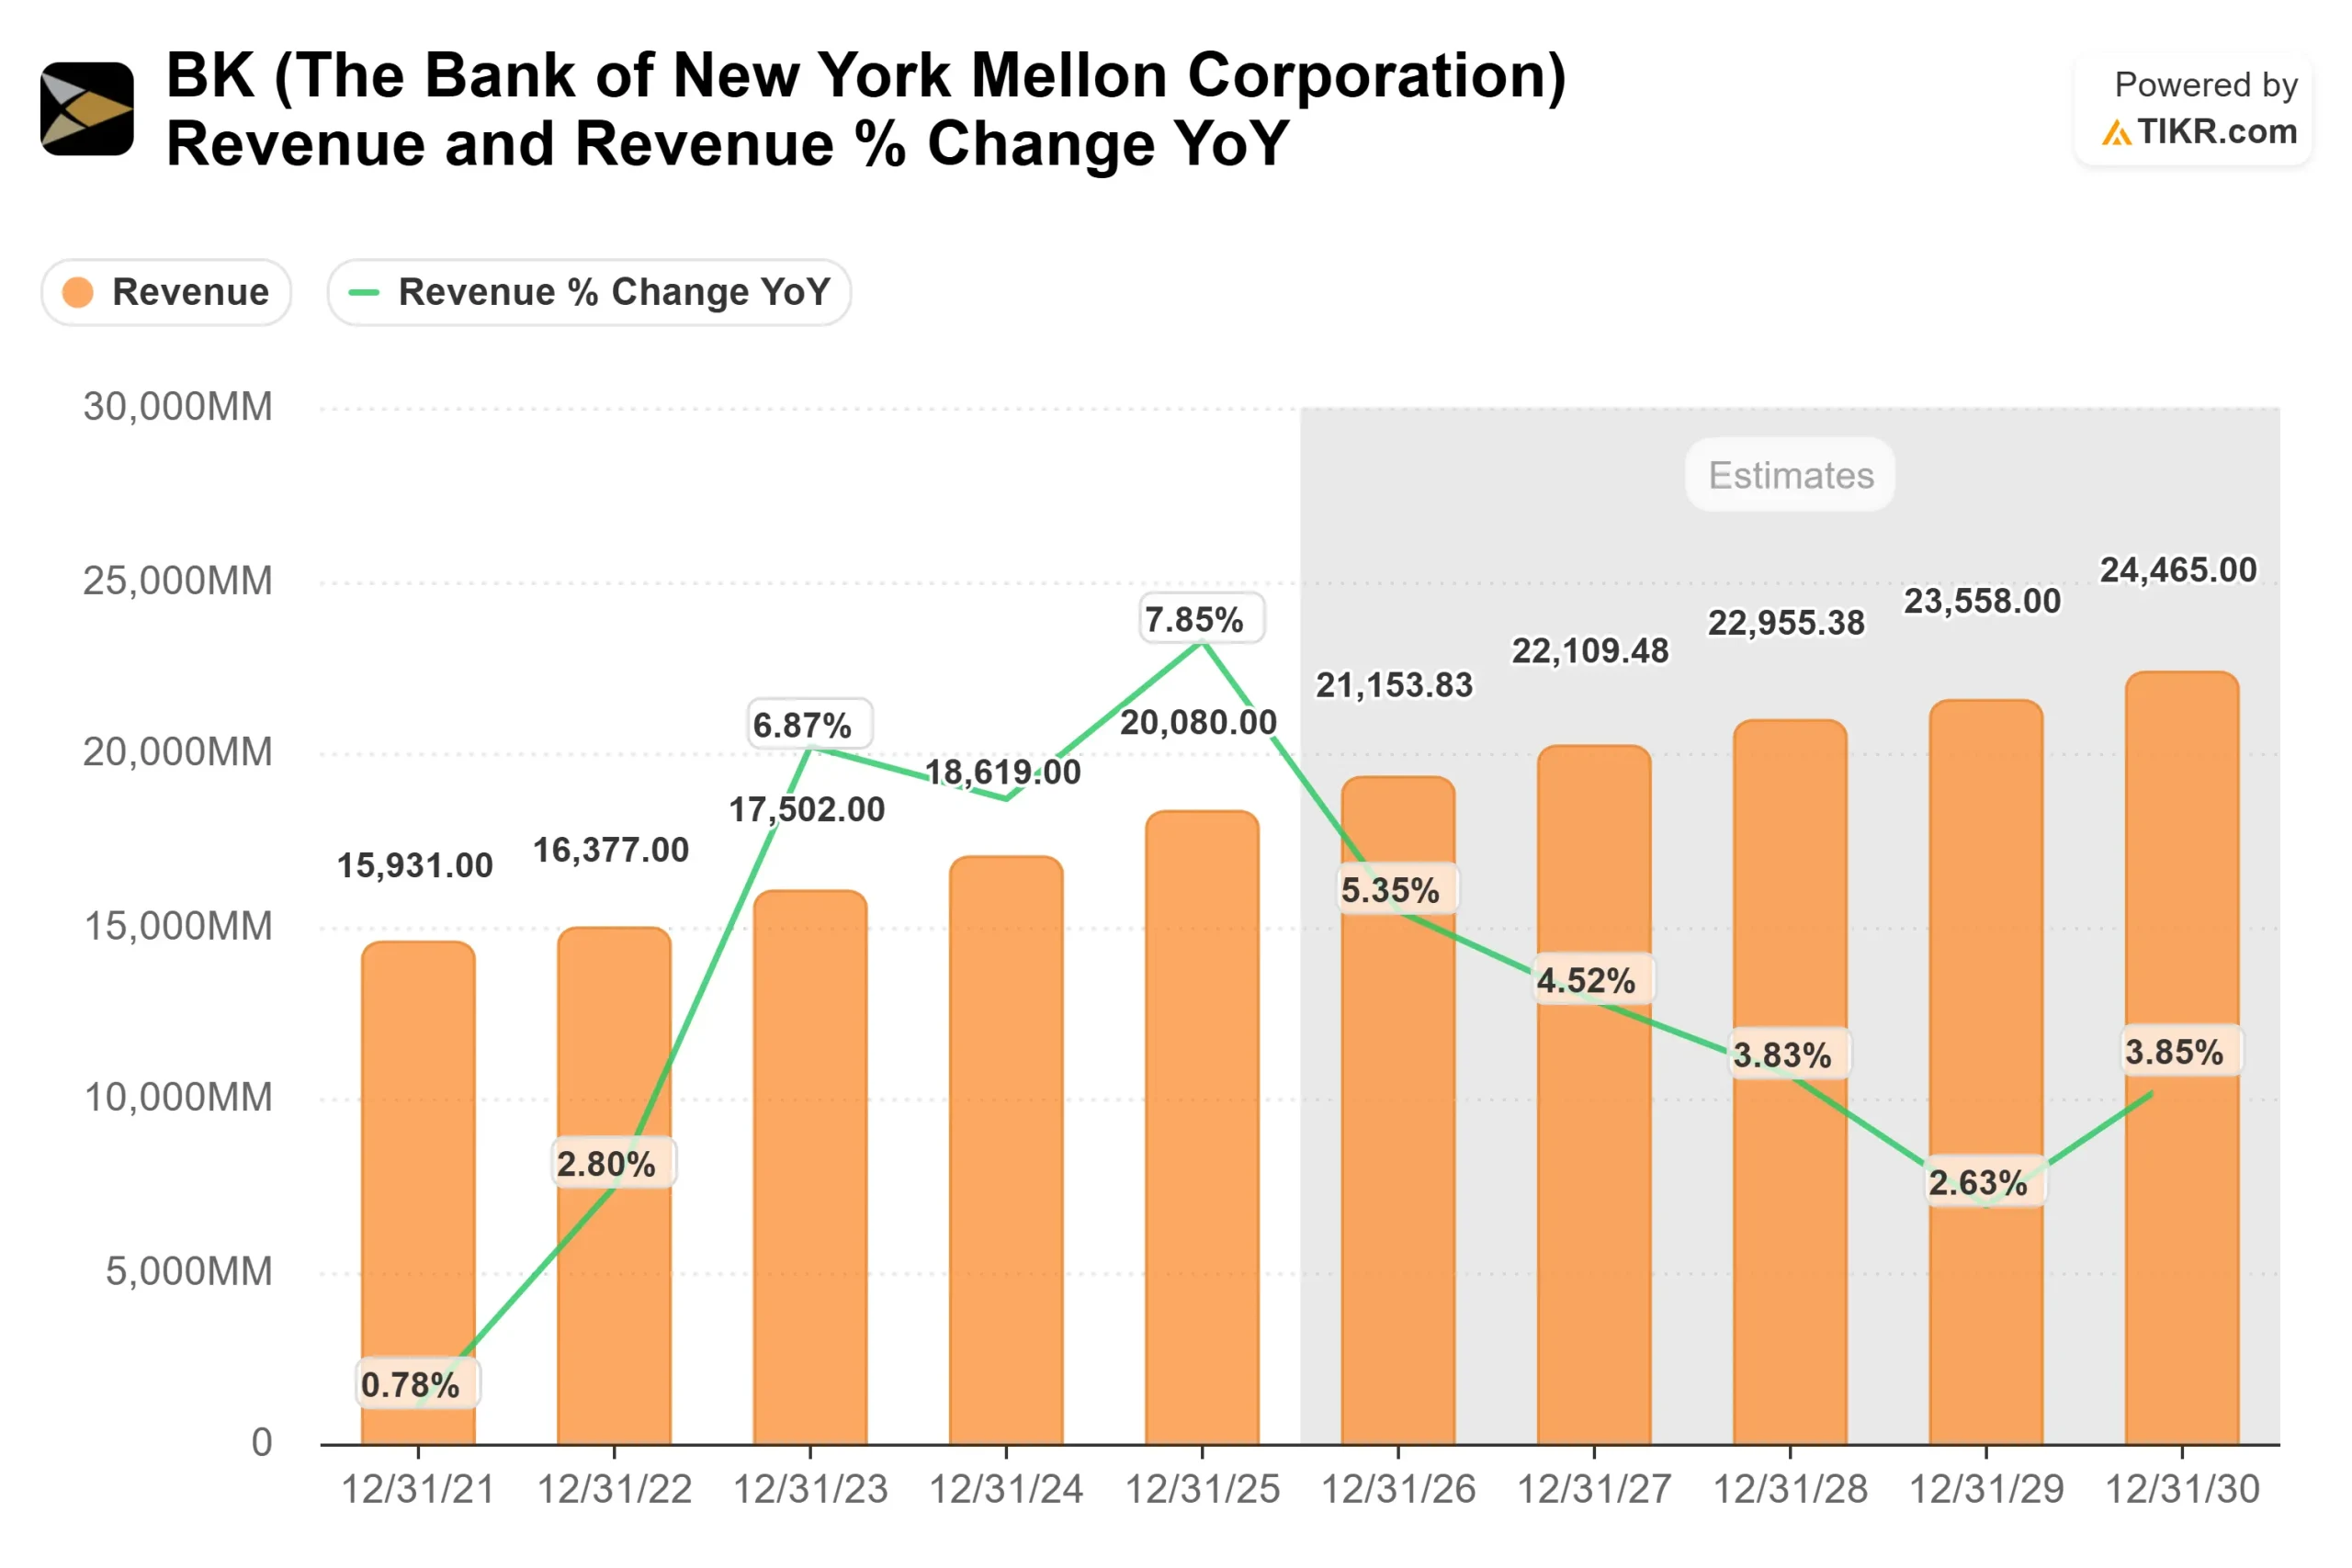
Revenue growth reflects steady expansion across asset servicing, issuer services, and wealth management, supported by cross-selling momentum and a structurally large global asset base.
Forward 2-year revenue CAGR of 4.9% indicates moderate but durable top-line growth anchored in recurring client activity.
Operating margins of 38.1% assume continued efficiency gains from the platform operating model and technology modernization.
As more operations move into unified platforms, incremental revenue has greater potential to translate into profit through improved scale and process harmonization.
Net interest income remains supported by operational deposits that management expects to remain relatively flat this year, helping reduce earnings volatility compared to traditional lending banks.
Additional drivers include deeper product integration, digital asset infrastructure expansion, and AI-enabled workflow improvements that create capacity and accelerate client onboarding.
Applying a 12.0x exit multiple produces a modeled target price of $136, implying about 16% upside over roughly 2.9 years.
At current levels, Bank of New York Mellon appears undervalued, with further gains into 2026 likely driven by margin durability, cross-platform integration, and disciplined capital allocation rather than reliance on rate cycles.
Estimate a company’s fair value instantly (Free with TIKR) >>>
Value Any Stock in Under 60 Seconds (It’s Free)
With TIKR’s new Valuation Model tool, you can estimate a stock’s potential share price in under a minute.
All it takes is three simple inputs:
- Revenue Growth
- Operating Margins
- Exit P/E Multiple
From there, TIKR calculates the potential share price and total returns under Bull, Base, and Bear scenarios so you can quickly see whether a stock looks undervalued or overvalued.
If you’re not sure what to enter, TIKR automatically fills in each input using analysts’ consensus estimates, giving you a quick, reliable starting point.
See a stock’s true value in under 60 seconds (Free with TIKR) >>>