
Key Stats for 3M Company Stock
- 6-Month Performance: 7%
- 52-Week Range: $122 to $177
- Valuation Model Target Price: $203
- Implied Upside: 18%
Value your favorite stocks like 3M Company with 5 years of analysts’ forecasts using TIKR’s new Valuation Model (It’s free) >>>
What Happened?
3M stock is up about 7% over the last six months, recently trading near $172 per share as investors reacted to improving earnings momentum and a clearer path to margin expansion.
Shares are now trading near the top of their $122 to $177 52-week range, reflecting renewed confidence in the company’s operational turnaround.
The move higher followed 3M’s Q4 2025 earnings report, which reassured investors that restructuring and cost initiatives are translating into measurable results.
The company delivered 2.2% organic sales growth, a 21.1% adjusted operating margin, and earnings per share of $1.83, while generating approximately $1.3 billion in adjusted free cash flow with roughly 130% conversion.
CEO Bill Brown said 3M “delivered solid results in Q4,” highlighting 3.8% organic growth in Safety and Industrial and 2.4% growth in Transportation and Electronics, partially offset by a 2.2% decline in Consumer.
Management guided for approximately 3% organic sales growth in 2026 with EPS between $8.50 and $8.70.
That outlook signals continued outperformance versus the broader industrial macro and reinforces the view that cost discipline, pricing governance, and commercial execution are beginning to drive sustained earnings leverage.
While insider selling and selective institutional trimming occurred during the quarter, the broader trend has been supported by strengthening fundamentals.
The stock’s rise over the past six months reflects growing confidence that margin expansion and innovation momentum are gaining traction and could support steady earnings growth into 2026.

See analysts’ growth forecasts and price targets for 3M Company (It’s free) >>>
Is 3M Company Undervalued?
Under valuation assumptions, the stock is modeled using:
- Revenue Growth (CAGR): 3.2%
- Operating Margins: 25.0%
- Exit P/E Multiple: 19x
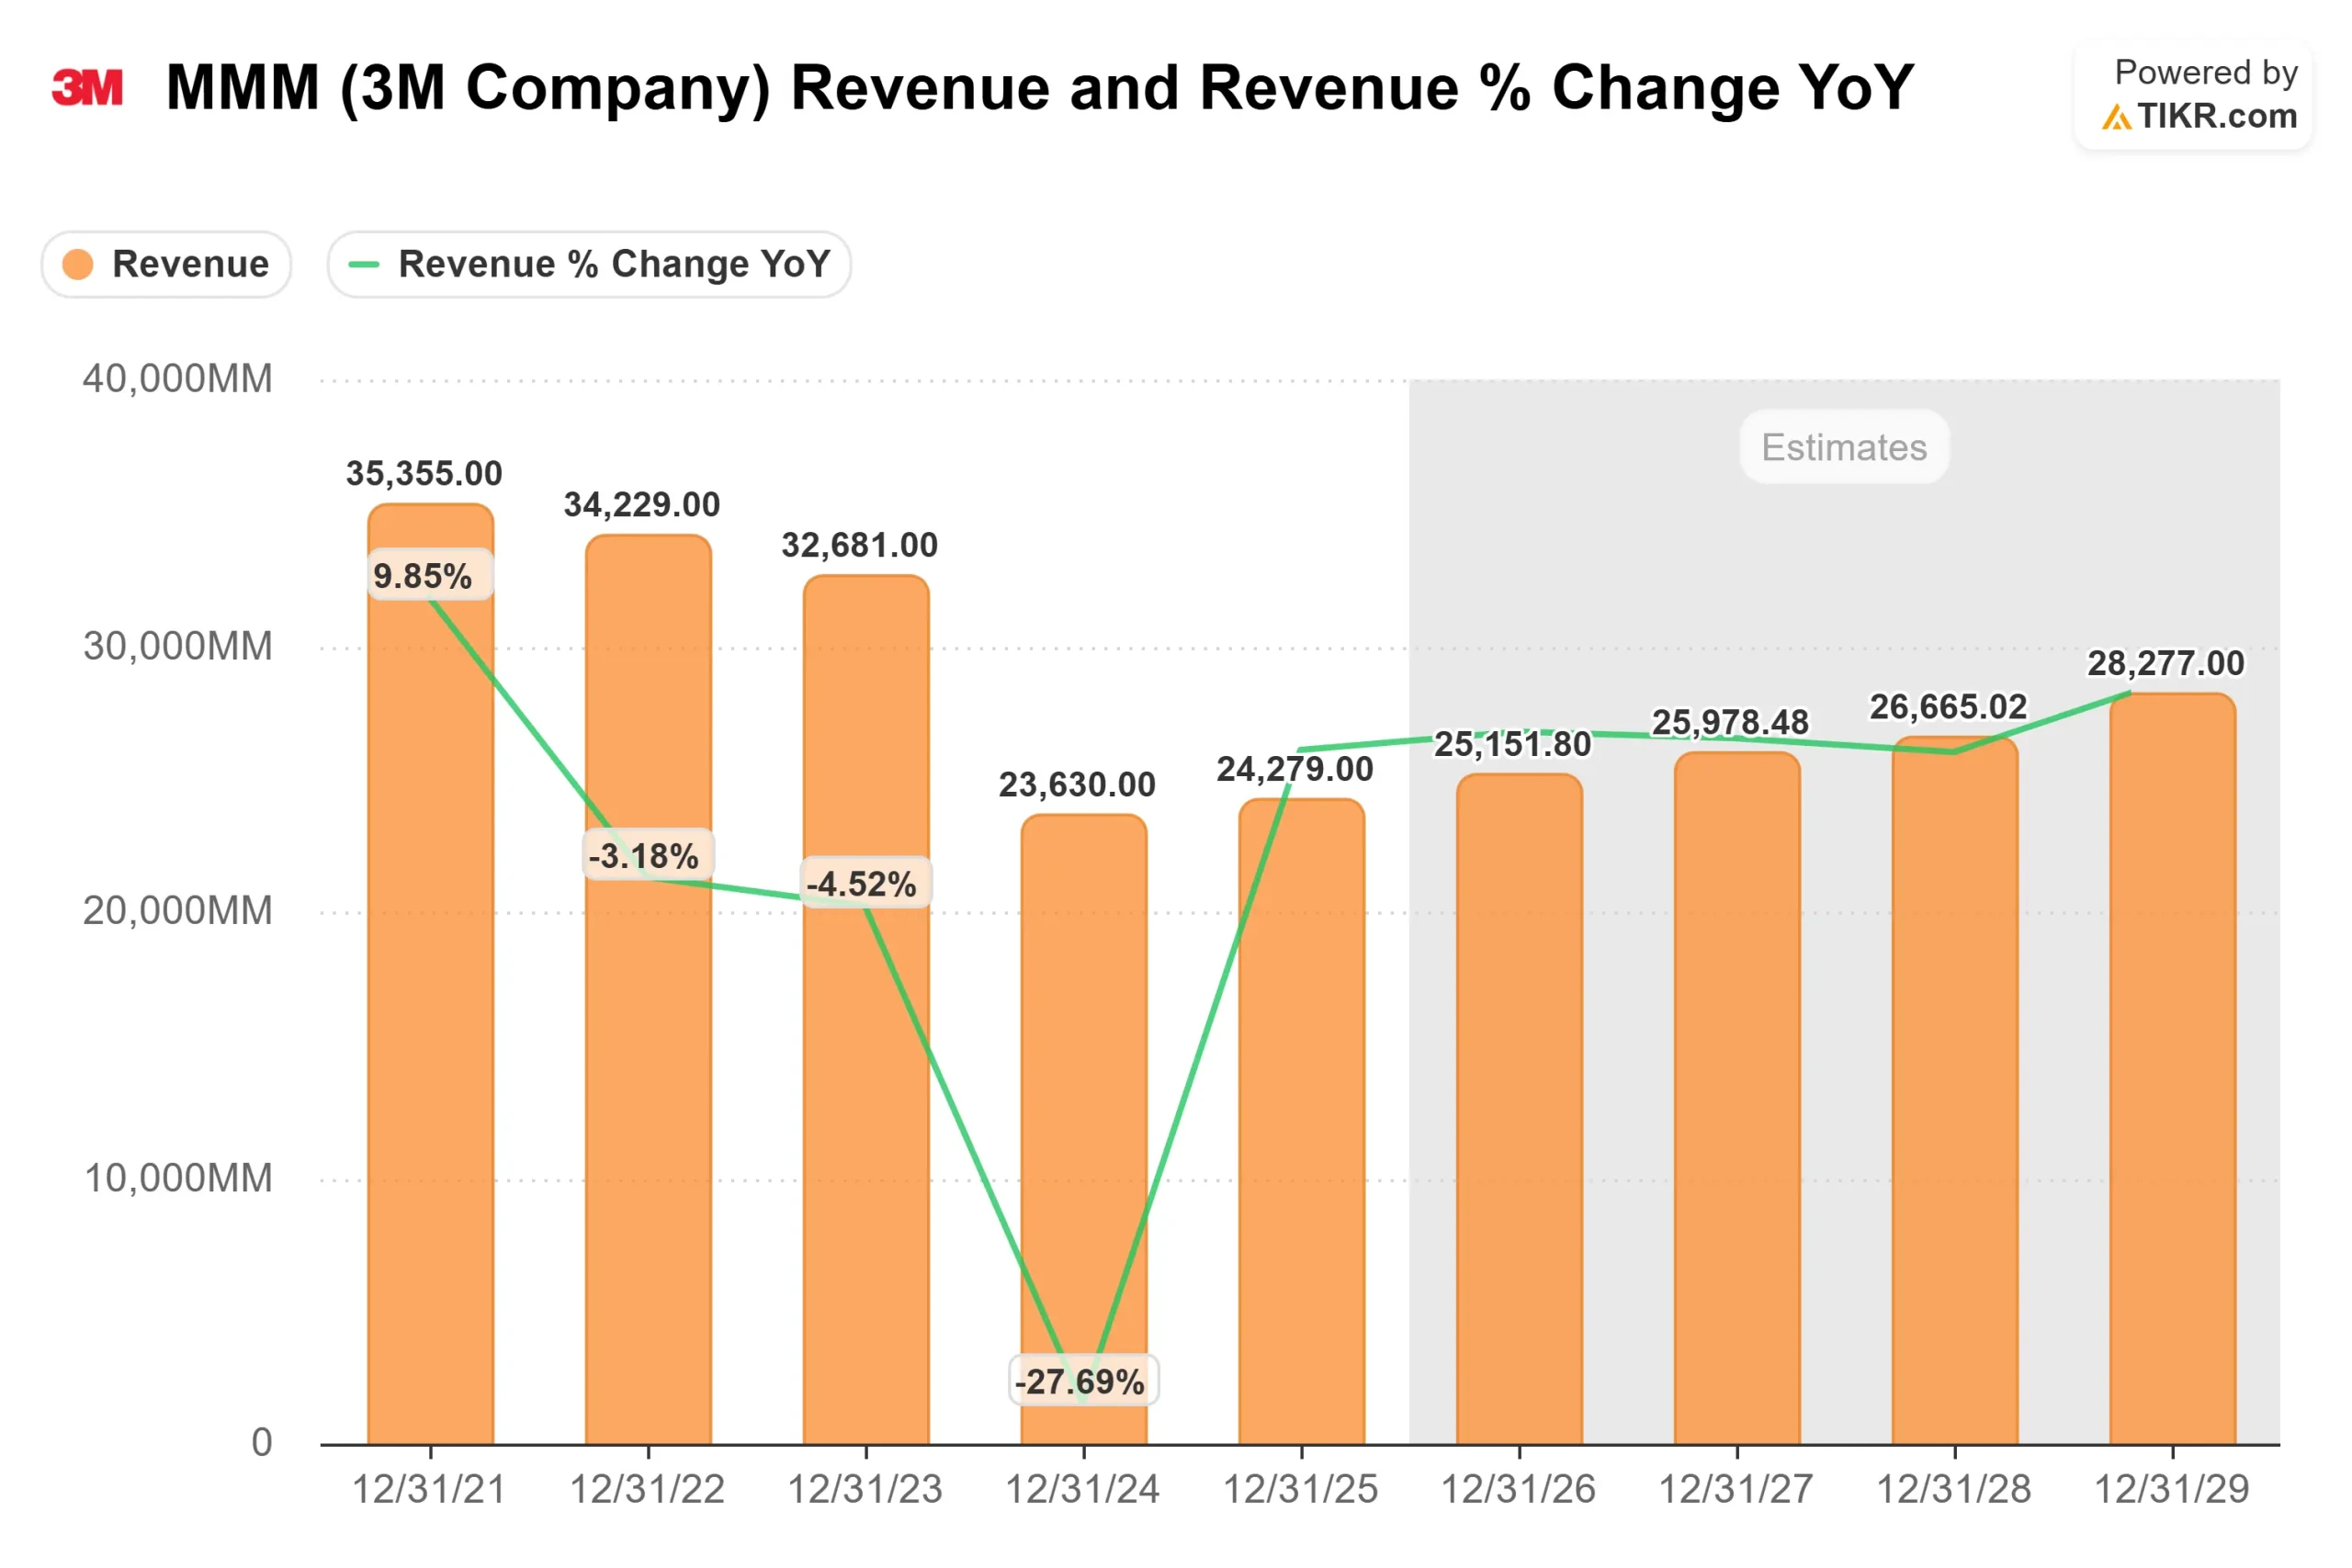
Revenue declined sharply through 2023 and 2024, but forward estimates show stabilization and gradual recovery.
Management expects approximately 3% organic growth in 2026, supported by stronger execution and continued product innovation.
3M launched 284 new products in 2025, up 68% year over year, and expects 350 launches in 2026. Sales from products introduced in the last five years rose 23% in 2025 and exited Q4 at 44%, signaling strengthening portfolio vitality and increasing contribution from newer offerings.
This supports the view that future returns depend less on macro recovery and more on internal execution, particularly commercial excellence initiatives and share gains in Safety, Industrial, and Electronics.
Margin expansion remains the primary earnings lever. Adjusted operating margin reached 23.4% for full-year 2025, up 200 basis points year over year, and management guided for an additional 70 to 80 basis points of expansion in 2026.
Operational drivers including supply chain productivity, improved asset utilization, tighter pricing governance, and lower cost of poor quality create structural earnings leverage even in a muted macro environment.
Strong free cash flow generation, expected to exceed 100% conversion again in 2026, combined with planned share repurchases of approximately $2.5 billion, provides incremental support to per-share earnings growth.
Based on these inputs, the model estimates a target price of $203, implying about 18% total upside from current levels.
At current prices near $172, 3M appears undervalued, with 2026 performance likely driven by sustained margin expansion, innovation execution, portfolio optimization toward higher-growth verticals, and disciplined capital allocation rather than aggressive top-line acceleration.
Estimate a company’s fair value instantly (Free with TIKR) >>>
Value Any Stock in Under 60 Seconds (It’s Free)
With TIKR’s new Valuation Model tool, you can estimate a stock’s potential share price in under a minute.
All it takes is three simple inputs:
- Revenue Growth
- Operating Margins
- Exit P/E Multiple
From there, TIKR calculates the potential share price and total returns under Bull, Base, and Bear scenarios so you can quickly see whether a stock looks undervalued or overvalued.
If you’re not sure what to enter, TIKR automatically fills in each input using analysts’ consensus estimates, giving you a quick, reliable starting point.
See a stock’s true value in under 60 seconds (Free with TIKR) >>>