
Key Takeaways:
- Aviation Capacity Expansion: Garmin acquired a 75,000 square foot hangar complex to add space for 75 associates, expanding aircraft certification and flight-test throughput as Aviation revenue already grew 18% in the latest reported quarter.
- Record Quarter Momentum: Garmin delivered $2 billion of quarterly revenue growth of 12% and $457 million of operating income at a 26% margin, then raised full-year EPS guidance to $8 and reiterated $7 billion revenue.
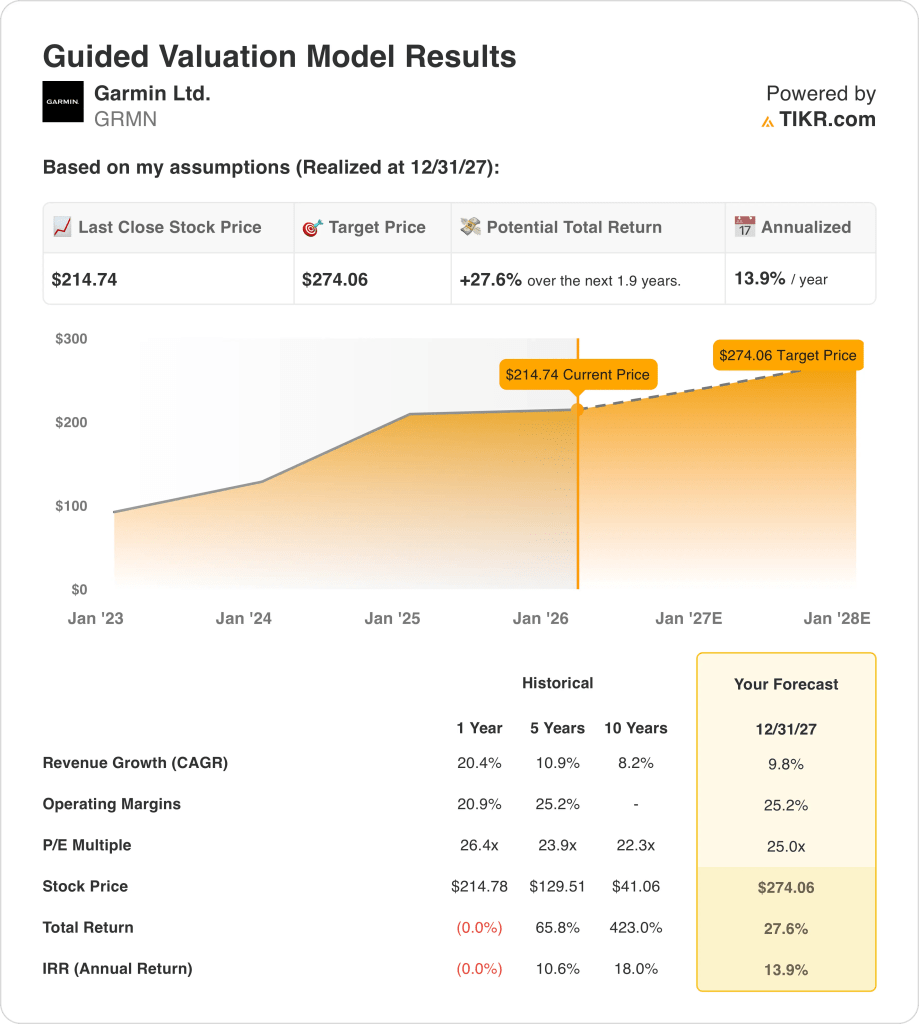
- Price Projection: Garmin stock could reach $274 by 2027 as the model prices in 10% revenue growth, 25% operating margins, and a 25x exit P/E.
- Modeled Upside: Garmin implies 28% total upside from $215 to $274, translating into a 14% annualized return over about 2 years.
Breaking Down the Case for Garmin Ltd.
Garmin Ltd. (GMRN) expanded its Aviation footprint on February 10, 2026 with a 75,000 square foot hangar acquisition in Mesa, positioning the company for higher certification throughput ahead of its February 18, 2026 Q4 earnings release.
In the Q3 earnings call, Garmins cited its revenue reached $2 billion, up 12%, with $457 million of operating income and a 26% operating margin, keeping the company on track for about $7 billion in annual revenue.
Gross margin stood at 59% while operating expense represented 33% of sales, and full-year guidance called for 25% operating margin and $8 of pro forma EPS supported by diversified segment contributions.
Fitness revenue rose 30% to $601 million, Aviation increased 18% to $240 million, Marine climbed 20% to $267 million, while Outdoor declined 5% to $498 million following a strong prior product cycle.
On the Q3 2025 earnings call, CEO Cliff Pemble stated, “Garmin achieved another quarter of outstanding financial results,” referencing 12% revenue growth and double-digit gains in 3 of 5 segments.
With $4 billion of cash, $2 billion of inventory to manage tariff exposure, and a 25x valuation multiple, investor focus now centers on whether 10% revenue growth can be sustained without multiple expansion.
What the Model Says for Garmin Stock
Garmin shows steady demand across Fitness and Aviation, while recent capacity expansion and 25.2% operating margins keep expectations balanced rather than elevated.
The market assumption uses 9.8% revenue growth, 25.2% operating margins, and a 25.0x exit multiple, producing a $274.06 target price aligned with current profitability trends.
That target reflects 27.6% total upside and a 13.9% annualized return, exceeding a 10% equity hurdle rate but offering moderate excess return.
The model signals a Buy, as a 13.9% annualized return under conservative market assumptions supports disciplined capital allocation.
A 13.9% annualized return exceeds a 10% equity hurdle rate and supports capital appreciation, not merely preservation, as market assumption revenue growth and 25.0x valuation justify risk compensation through 2027.
Our Valuation Assumptions
TIKR’s Valuation Model lets you plug in your own assumptions for a company’s revenue growth, operating margins, and P/E multiple, and calculates the stock’s expected returns.
Here’s what we used for Garmin stock:
1. Revenue Growth: 9.8%
Garmin stock posted 20.4% revenue growth in 2024 after 7.6% in 2023 and reversed the 2.5% decline in 2022 as demand strengthened across Fitness, Aviation, and Marine.
Revenue totaled $6.30 billion in 2024, while estimates show $7.14 billion in 2025 and $7.66 billion in 2026 as growth moderates from 13.3% to 7.3%.
The 9.8% revenue growth assumption sits below the recent 20.4% pace and near the 5-year 10.9% CAGR, and it requires stable share gains across wearables and Aviation backlog.
This is below the 1-year historical revenue growth of 20.4%, as tougher comparisons and product cycle normalization limit acceleration and cap valuation expansion.
2. Operating Margins: 25.2%
Garmin stock expanded operating margin to 25.3% in 2024 from 20.9% in 2023 after 21.1% in 2022 as higher-margin segments increased mix weight.
Gross margin held at 58.7% in 2024 while operating income rose to $1.59 billion and operating expenses totaled $2.10 billion, and scale supported earnings resilience.
The 25.2% operating margin assumption aligns with current structure and assumes revenue scales toward $7.66 billion by 2026 while expense growth stays disciplined.
Tariff exposure, currency shifts, and promotional intensity in Q4 introduce cost variability, and any gross margin slippage would compress operating margin below 25%.
This is in line with the 1-year operating margin of 25.3%, as the model assumes stability rather than further structural expansion in profitability.
3. Exit P/E Multiple: 25x
Garmin stock traded at 26.4x 1-year earnings, 23.9x over 5 years, and 22.3x over 10 years, and those levels confirm durable earnings across segments.
The 25× exit multiple capitalizes normalized EPS of $8.72 in 2026 under market assumption and stays near current valuation levels without assuming multiple expansion.
The market assumption for 2026 NTM P/E stands in the mid-20s, and the 25× exit multiple aligns with prevailing sentiment rather than peak enthusiasm.
If revenue growth slows below 9.8% or margin slips under 25.2%, the multiple would likely compress toward the 10-year average near 22x.
This is below the 1-year historical P/E of 26.4x, as earnings durability supports valuation while slower revenue growth constrains multiple expansion.
What Happens If Things Go Better or Worse?
Garmin stock returns are shaped by wearable demand strength, aviation backlog conversion, and margin control across segments through 2029.
- Low Case: If Outdoor cycles soften and cost pressure rises, revenue grows 7.6% and net margins hold near 19.8% → 2.8% annualized return.
- Mid Case: With steady Fitness demand and aviation stability, revenue grows 8.5% and net margins reach 21.3% → 8.9% annualized return.
- High Case: If wearables gain share and mix improves, revenue grows 9.3% and net margins expand to 22.4% → 14.5% annualized return.

How Much Upside Does Garmin Stock Have From Here?
With TIKR’s new Valuation Model tool, you can estimate a stock’s potential share price in under a minute.
All it takes is three simple inputs:
- Revenue Growth
- Operating Margins
- Exit P/E multiple
If you’re not sure what to enter, TIKR automatically fills in each input using analysts’ consensus estimates, giving you a quick, reliable starting point.
From there, TIKR calculates the potential share price and total returns under Bull, Base, and Bear scenarios so you can quickly see whether a stock looks undervalued or overvalued.
Looking for New Opportunities?
- See what stocks billionaire investors are buying so you can follow the smart money.
- Analyze stocks in as little as 5 minutes with TIKR’s all-in-one, easy-to-use platform.
- The more rocks you overturn… the more opportunities you’ll uncover. Search 100K+ global stocks, global top investor holdings, and more with TIKR.
Disclaimer:
Please note that the articles on TIKR are not intended to serve as investment or financial advice from TIKR or our content team, nor are they recommendations to buy or sell any stocks. We create our content based on TIKR Terminal’s investment data and analysts’ estimates. Our analysis might not include recent company news or important updates. TIKR has no position in any stocks mentioned. Thank you for reading, and happy investing!