
Key Stats for CSX Corporation Stock
- 30-Day Performance: 15%
- 52-Week Range: $26 to $42
- Valuation Model Target Price: $49
- Implied Upside: 20%
Value your favorite stocks like CSX Corporation with 5 years of analysts’ forecasts using TIKR’s new Valuation Model (It’s free) >>>
What Happened?
CSX stock rose about 15% in the last 30 days, recently trading near $41 per share as investors reacted to fourth-quarter earnings results and updated 2026 guidance. Shares rebounded as the market shifted its focus from short-term earnings pressure to forward-looking margin expansion.
The stock initially faced pressure after reporting fourth-quarter revenue down 1%, operating income down 9%, and earnings per share down 7% year over year, including approximately $50 million, or $0.02 per share, in charges tied to workforce optimization and technology actions.
Softer industrial demand and negative business mix weighed on profitability, which contributed to near-term weakness.
However, investors responded positively to improving underlying trends and forward guidance. Intermodal revenue increased 7% on 5% volume growth, highlighting network strength.
CEO Steve Angel guided to low single-digit revenue growth in 2026 and stated the company expects “operating margin expansion in the range of 200 to 300 basis points,” signaling meaningful operating leverage ahead.
Management also plans 2026 capital expenditures below $2.4 billion and projects free cash flow growth of at least 50% compared to 2025.
The move in the last 30 days suggests investors are positioning for stronger profitability rather than focusing solely on near-term revenue softness.
See analysts’ growth forecasts and price targets for CSX Corporation (It’s free) >>>
Is CSX Corporation Undervalued?
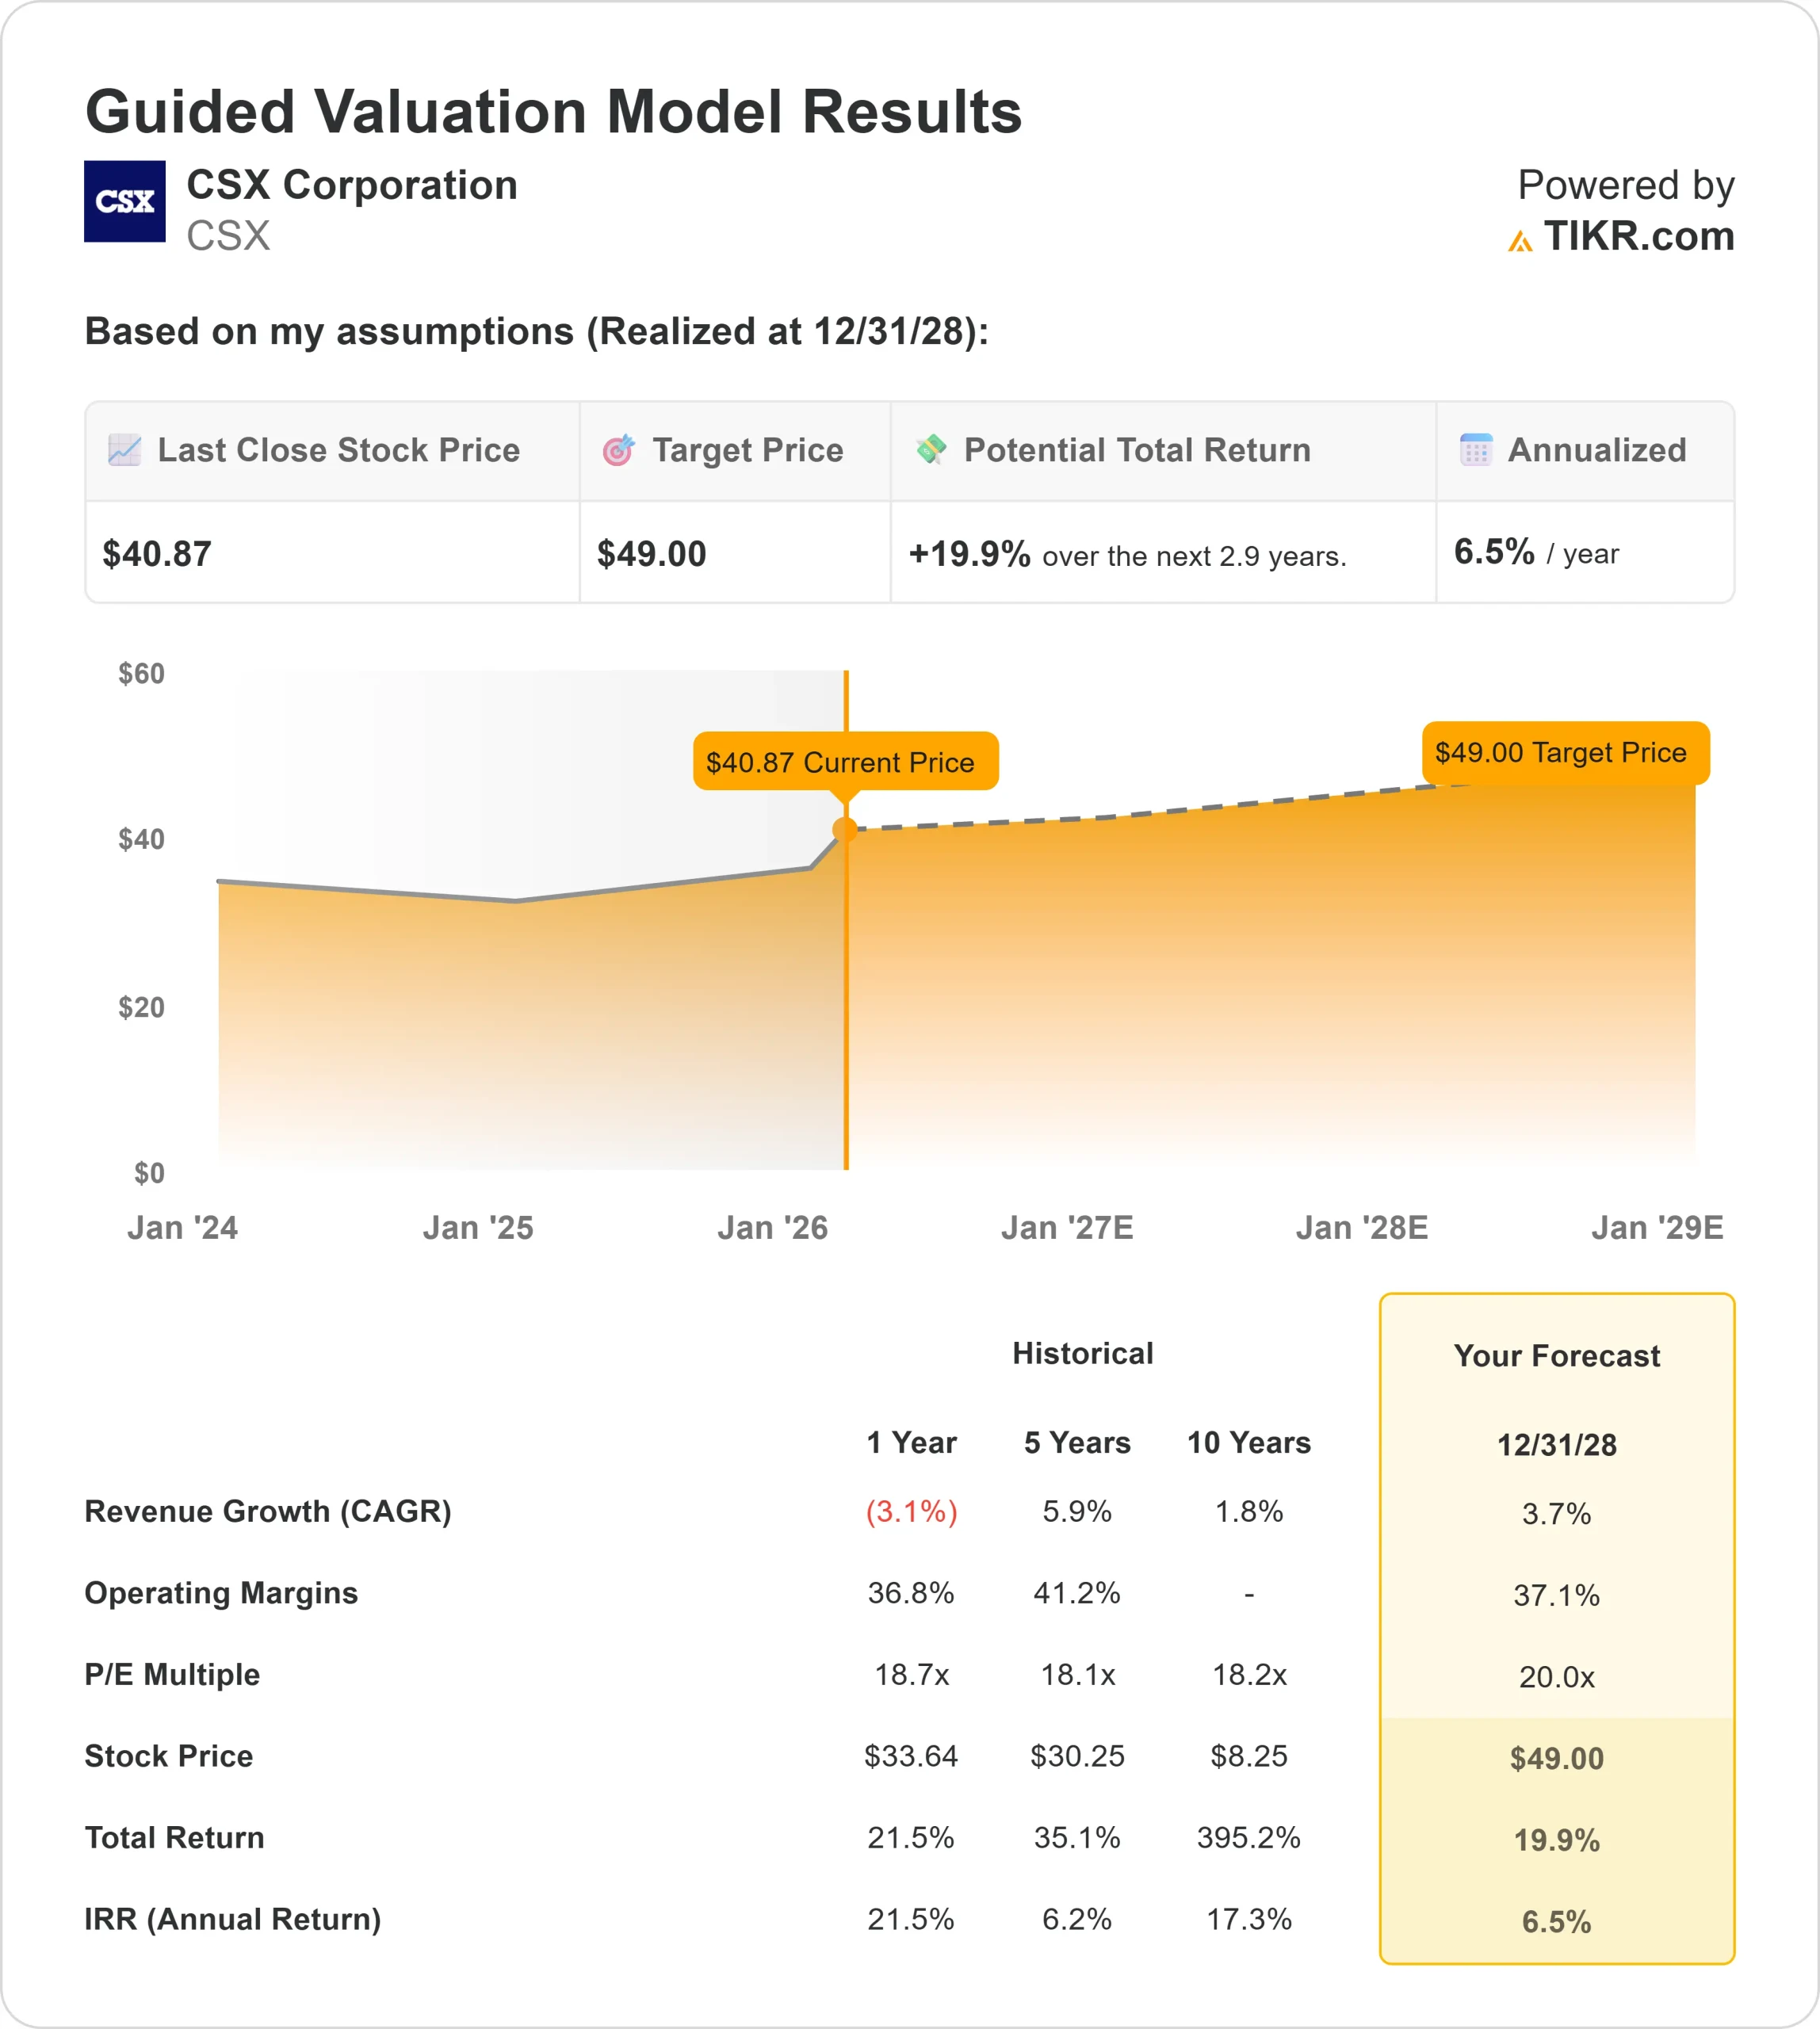
Under valuation assumptions, the stock is modeled using:
- Revenue Growth (CAGR): 3.7%
- Operating Margins: 37.1%
- Exit P/E Multiple: 20x
Revenue growth reflects gradual normalization rather than a cyclical surge. Analyst estimates show revenue increasing from approximately $14.09 billion in 2025 to about $15.73 billion by 2028, consistent with steady pricing execution and modest volume recovery.

Margin expansion remains the central earnings driver. Management’s 200 to 300 basis point operating margin expansion target for 2026 is supported by workforce optimization, more than 100 cost-efficiency initiatives, improved asset utilization, and tighter discretionary spending controls.
Given the railroad’s fixed-cost structure, incremental revenue can translate into outsized earnings growth once volumes stabilize.
Several business drivers support the outlook. Intermodal expansion, domestic utility coal demand supported by higher natural gas prices, infrastructure-related shipments such as aggregates and cement, and ongoing contract repricing efforts all contribute to improving incremental margins.
Capital discipline further strengthens the setup, with planned CapEx below $2.4 billion and projected free cash flow growth of at least 50%, enhancing flexibility for dividends and buybacks.
Based on these inputs, the valuation model estimates a target price of $49, implying about 20% total upside over roughly 2.9 years, or approximately 6.5% annually.
Under the greater-than-6% annual return framework, CSX appears undervalued, with future performance driven by operating leverage, pricing execution, and disciplined capital allocation rather than aggressive top-line acceleration.
Estimate a company’s fair value instantly (Free with TIKR) >>>
Value Any Stock in Under 60 Seconds (It’s Free)
With TIKR’s new Valuation Model tool, you can estimate a stock’s potential share price in under a minute.
All it takes is three simple inputs:
- Revenue Growth
- Operating Margins
- Exit P/E Multiple
From there, TIKR calculates the potential share price and total returns under Bull, Base, and Bear scenarios so you can quickly see whether a stock looks undervalued or overvalued.
If you’re not sure what to enter, TIKR automatically fills in each input using analysts’ consensus estimates, giving you a quick, reliable starting point.
See a stock’s true value in under 60 seconds (Free with TIKR) >>>