
Key Takeaways:
- Leadership Reset: Workday appointed co-founder Aneel Bhusri as CEO on February 9, 2026, an AI-led strategic reset that triggered a 5% share drop and signaled urgency around execution and demand.
- AI Platform Buildout: Workday reinforced its AI push with a $1 billion Sana deal and highlighted 80 GA AI features plus 1 billion AI actions year-to-date, positioning monetization around usage-driven Flex Credits rather than only seats.
- Target Price Framework: Based on 18% revenue growth and 27% operating margins by 2028 with a 15x P/E, Workday stock could reach $209 over the next 2 years as profitability scales off a $9 billion revenue base.
- Modeled Return Profile: Workday’s $209 target implies 36% upside from the $153 current price, translating to a 17% annualized return over 2 years under the valuation assumptions.
Breaking Down the Case for Workday, Inc.
Workday, Inc. (WDAY) reset leadership on February 9, 2026 by naming co-founder Aneel Bhusri CEO, and the stock reaction of about 5% down immediately reframed 2026 as an execution year for its AI-led product cycle.
The business enters that reset with $9 billion of LTM revenue and $7 billion of gross profit, sustaining a 76% gross margin that reflects durable pricing power across enterprise HR and finance workflows.
Cost structure remains the core investor focus, with $6 billion of LTM operating expenses translating into $1 billion of operating income and a 9% operating margin after years of scaling past negative margins in 2022.
Consensus direction for fiscal 2026 points to $10 billion of revenue, $3 billion of EBITDA, and $9 of normalized EPS, setting a clear bar for margin delivery as customers scrutinize tech budgets.
Strategically, management frames a $200 billion TAM with roughly 4% to 5% penetration, and the plan expands beyond core suites into frontline workflows tied to about 3 billion workers plus incremental growth in Europe and India.
AI product strategy now anchors differentiation, with 80 generally available AI features, about 1 billion AI actions year-to-date, and roughly 10 customer-facing agents supported by Flex Credits plus about 3,000 integration connectors from Pipedream.
Last month, Bhusri proudly announced, “AI is a bigger transformation than SaaS (software as a service) — and it will define the next generation of market leaders.”
With the stock around $153 against a $209 model outcome tied to 15x earnings and 27% operating margins by 2028, the debate centers on whether the market discounts AI monetization credibility or simply the pace of near-term margin execution.
What the Model Says for WDAY Stock
Workday stock sustains 75.6% gross margins and 9.4% operating margins, supporting market assumption discipline around capital intensity and competitive positioning.
The model applies market assumption 17.8% revenue growth, 26.8% operating margins, and a 15.0x exit multiple, and targeting a $209.05 target price.
That framework implies 36.4% total upside from $153.23 and a 17.1% annualized return over 2.0 years, supported by the February 9, 2026 CEO transition and acceleration of AI monetization through Flex Credits and 80 GA AI features.
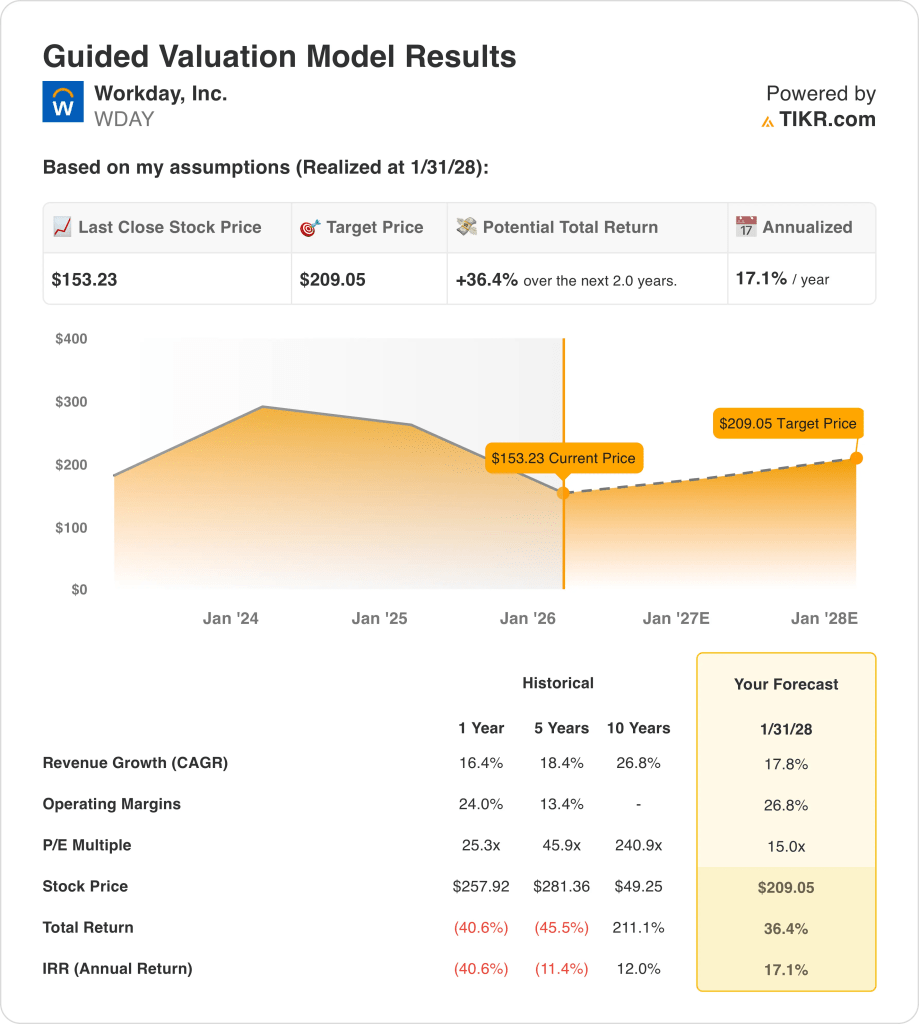
Therefore, the model signals a Buy as 17% annualized return at 15.0x exceeds typical equity hurdles, reflecting execution leverage from 1 billion AI actions year-to-date and disciplined operating expansion toward 26.8% margins.
A 17.1% annualized return exceeds a 10% equity hurdle rate and reflects market assumption 17.8% revenue growth with 26.8% operating margins at a 15.0x exit multiple, reinforced by expansion into a $200 billion TAM and deeper mid-market penetration.
Our Valuation Assumptions
TIKR’s Valuation Model lets you plug in your own assumptions for a company’s revenue growth, operating margins, and P/E multiple, and calculates the stock’s expected returns.
Here’s what we used for Workday stock:
1. Revenue Growth: 17.8%
Workday revenue expanded 19% in 2022, 21% in 2023, 17% in 2024, and 16% in 2025, and LTM revenue reached $9.23 billion as scale increased across enterprise HR and finance customers.
The market assumption for 2026 revenue growth stands at 13%, and the model applies 17.8% as AI monetization, mid-market penetration, and a $200 billion TAM at 4% to 5% share support sustained expansion.
Workday stock requires AI products that already produced over 1 billion annual actions to translate into incremental sales, and slower enterprise budgets would pull growth back toward the 13% market assumption.
This is above the 1-year historical revenue growth of 16.4%, as scale pressures intensify and valuation depends on revenue outperformance rather than normalization toward the 13% market assumption.
2. Operating Margins: 26.8%
Operating margin shifted from negative 3% in 2023 to 9% LTM, while gross margin held at 75.6% and operating expenses totaled $6.11 billion as profitability reemerged after heavy R&D investment near $2.6 billion.
The market assumption for 2026 EBIT margin is 29.1%, and the model selects 26.8% as operating leverage expands but AI reinvestment and integration costs temper peak margin potential.
Workday stock must convert revenue growth near $10 billion into durable cost control, and incremental expense increases would pressure margin expansion below the 26.8% assumption.
This is above the 1-year historical operating margin of 9.4%, as fixed-cost absorption must accelerate and valuation contracts if margins stall near current levels rather than approach the 29.1% market assumption.
3. Exit P/E Multiple: 15x
The market exit P/E assumption declined from 33x in early 2025 to 15x in February 2026, while leveraged free cash flow yield increased to 7.5% as valuation expectations reset.
With that, the model applies a 15× exit P/E, which aligns with the 15.04x market assumption for 2026, and it capitalizes normalized EPS near $9 without assuming multiple expansion for Workday stock.
This valuation level assumes earnings durability at 26.8% operating margins and 17.8% revenue growth, and any earnings miss compresses the multiple further because prior valuation peaked above 33x.
Still. this is below the 1-year historical P/E of 25.3x, as market tolerance for premium software multiples declined and the model assumes normalization rather than a return to elevated valuations.
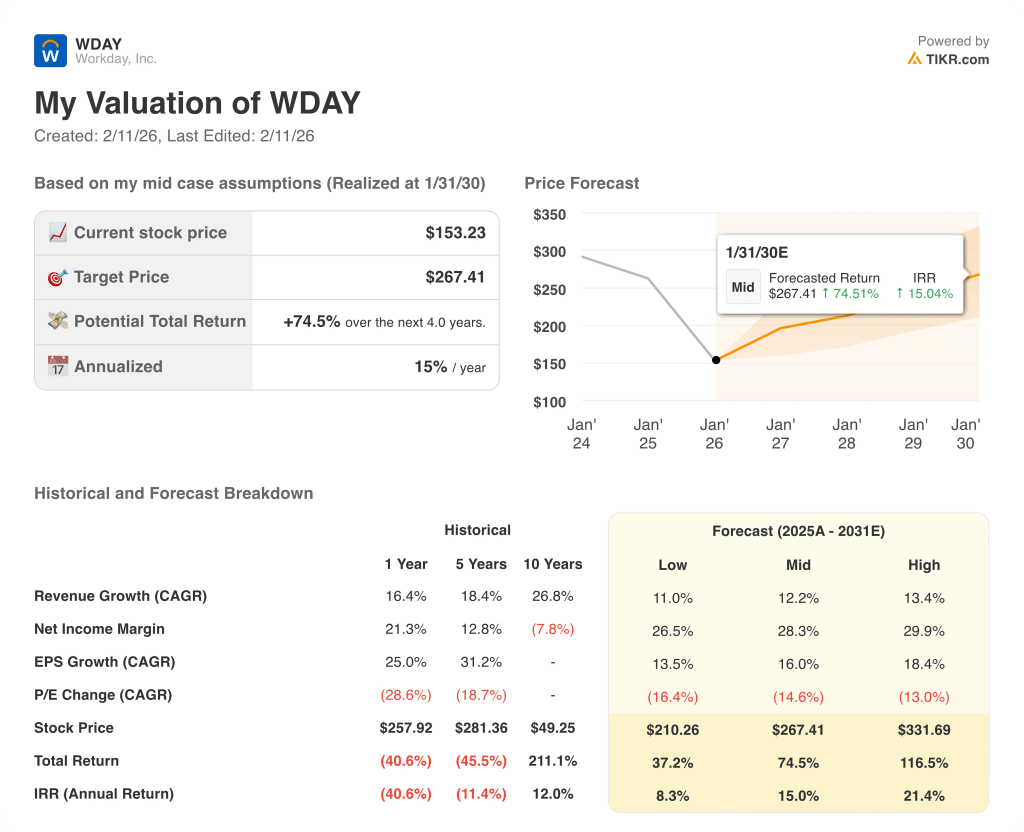
What Happens If Things Go Better or Worse?
Workday stock valuation through 2030 reflects AI monetization traction, enterprise demand stability, and margin discipline across a larger $9 billion revenue base.
- Low Case: If AI adoption slows and enterprise budgets tighten, revenue grows 11.0% and net margin reaches 26.5% → 8.3% annualized return.
- Mid Case: With AI agents scaling and cost control intact, revenue growth reaches 12.2% and net margin improves to 28.3% → 15.0% annualized return.
- High Case: If AI monetization accelerates and operating leverage expands, revenue reaches 13.4% and net margin approaches 29.9% → 21.4% annualized return.
How Much Upside Does Workday Stock Have From Here?
With TIKR’s new Valuation Model tool, you can estimate a stock’s potential share price in under a minute.
All it takes is three simple inputs:
- Revenue Growth
- Operating Margins
- Exit P/E multiple
If you’re not sure what to enter, TIKR automatically fills in each input using analysts’ consensus estimates, giving you a quick, reliable starting point.
From there, TIKR calculates the potential share price and total returns under Bull, Base, and Bear scenarios so you can quickly see whether a stock looks undervalued or overvalued.
Looking for New Opportunities?
- See what stocks billionaire investors are buying so you can follow the smart money.
- Analyze stocks in as little as 5 minutes with TIKR’s all-in-one, easy-to-use platform.
- The more rocks you overturn… the more opportunities you’ll uncover. Search 100K+ global stocks, global top investor holdings, and more with TIKR.
Disclaimer:
Please note that the articles on TIKR are not intended to serve as investment or financial advice from TIKR or our content team, nor are they recommendations to buy or sell any stocks. We create our content based on TIKR Terminal’s investment data and analysts’ estimates. Our analysis might not include recent company news or important updates. TIKR has no position in any stocks mentioned. Thank you for reading, and happy investing!