
A stock can belong to a wonderful business and still be a terrible investment. The difference lies in what the market already expects. When a company’s future growth is fully reflected in today’s price, even excellent execution leaves no room for the stock to appreciate. You own a great business, but earn mediocre returns because you paid for perfection and received only excellence.
This concept trips up many investors because they conflate business quality with investment quality. They find a company with 20% earnings growth, strong competitive advantages, and capable management, then buy without examining what the stock price already assumes.
If the market is pricing in 25% growth, that 20% result will disappoint regardless of how impressive it looks in absolute terms. The stock falls not because the business failed but because it failed to exceed already lofty expectations.
Find out what a stock’s really worth in under 60 seconds with TIKR’s new Valuation Model (It’s free)>>>
The challenge is that expectations are not printed on the stock certificate. The market does not publish a document explaining what growth rate justifies the current price. You have to reverse-engineer it by examining valuation multiples, comparing them to growth rates, and assessing which assumptions would make the current price rational. Only then can you determine whether the market is pricing in realistic, optimistic, or fantasy growth.
Understanding whether growth is priced in separates investors who buy hope from those who buy value. A stock trading at 40x earnings might be cheap if it can sustain 30% growth for a decade. The same stock is expensive if growth is about to decelerate to 10%. The valuation multiple alone tells you nothing. What matters is the relationship between the price you pay and the growth you actually receive.
What “Priced In” Actually Means
A stock price reflects the market’s collective expectation for future cash flows. When investors say growth is “priced in,” they mean the current valuation already assumes a certain level of future earnings expansion. If that growth materializes exactly as expected, the stock should deliver returns roughly equal to the cost of equity, nothing more. Outperformance requires either beating expectations or seeing expectations rise further.
Think of it mathematically. A stock trading at 30x earnings implies investors expect something that justifies paying thirty dollars for every dollar of current profit. That something is growth. If the company grew at 0% forever, no rational investor would pay 30x. The premium multiple reflects anticipated expansion that will make today’s price look reasonable in hindsight. The higher the multiple, the more growth is embedded in the price.
The market is not always right about growth expectations, which creates opportunity. Sometimes it underestimates a company’s potential, pricing in 15% growth when 25% is achievable. These situations offer asymmetric returns because hitting expectations earns a decent return while exceeding them generates outsized gains. Other times the market overestimates, pricing in 25% growth when 15% is realistic. These situations offer asymmetric risk because meeting expectations produces mediocre returns while missing them triggers significant declines.
Your job as an investor is to form an independent view of realistic growth and compare it to what the market assumes. When your estimate exceeds the implied expectation, the stock may be undervalued even at a high multiple. When your estimate falls short, the stock may be overvalued even if the multiple looks reasonable. The comparison between your view and the market’s view determines whether growth is priced in, underpriced, or overpriced.
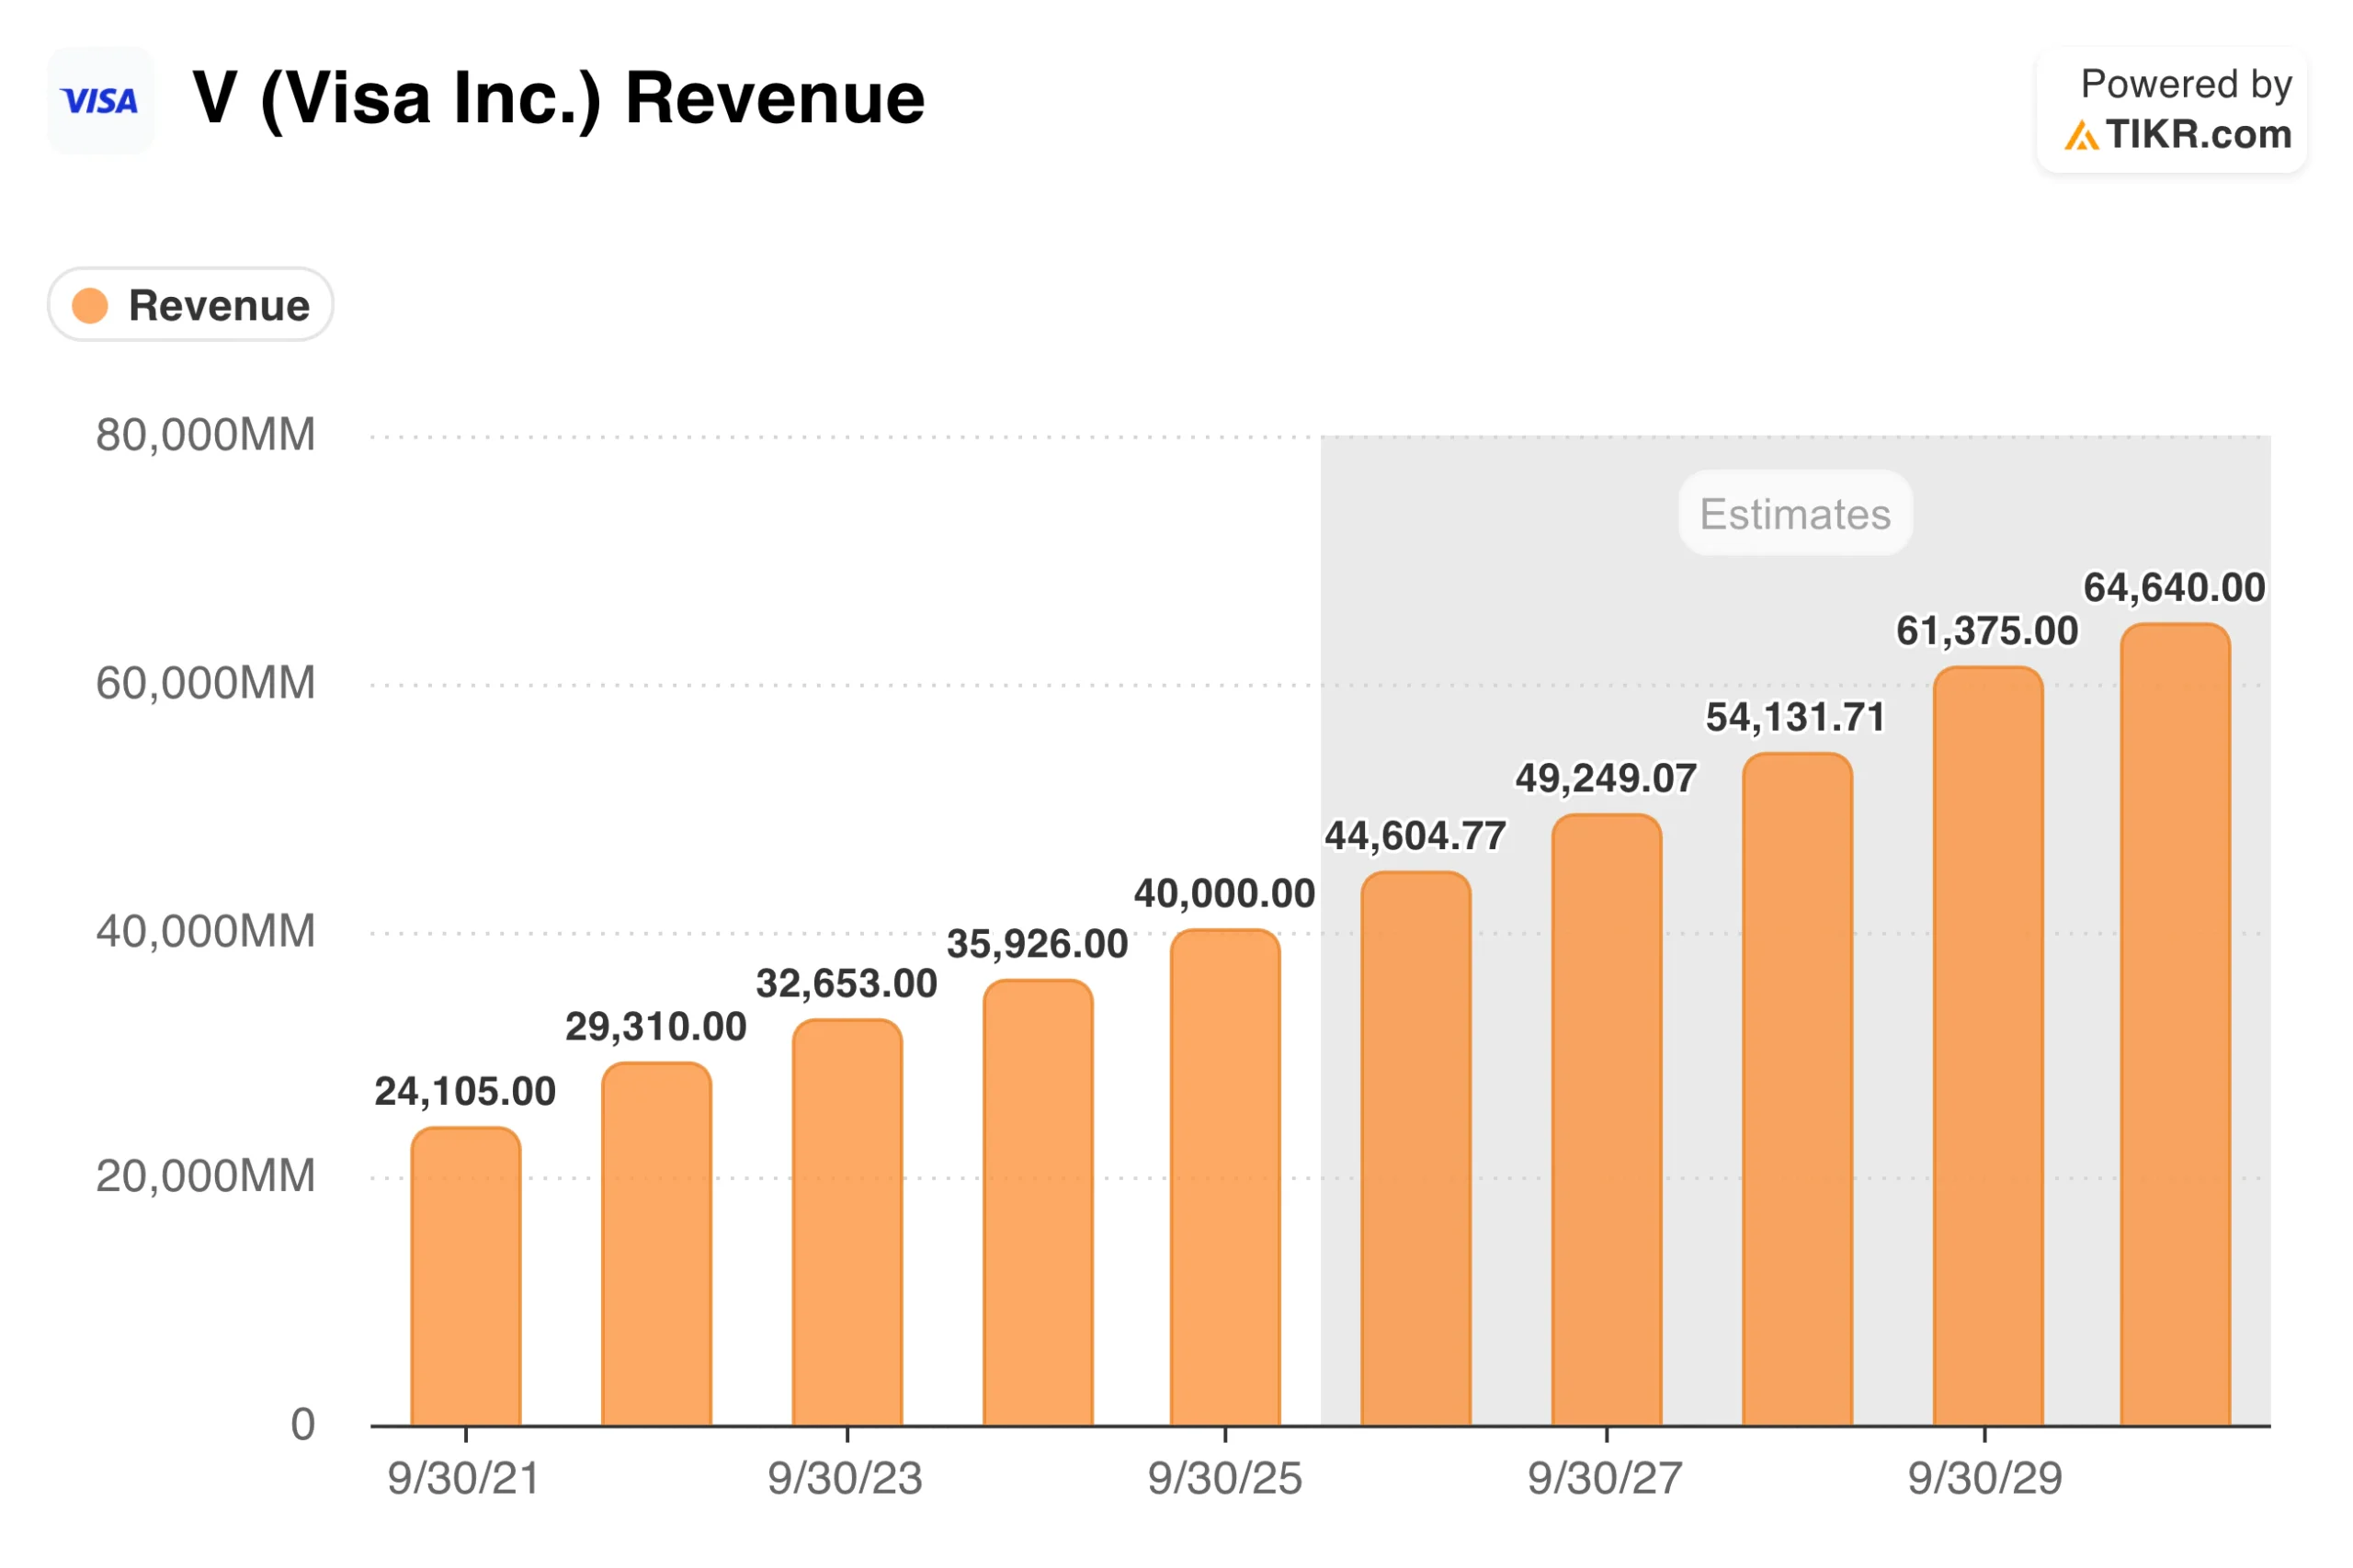
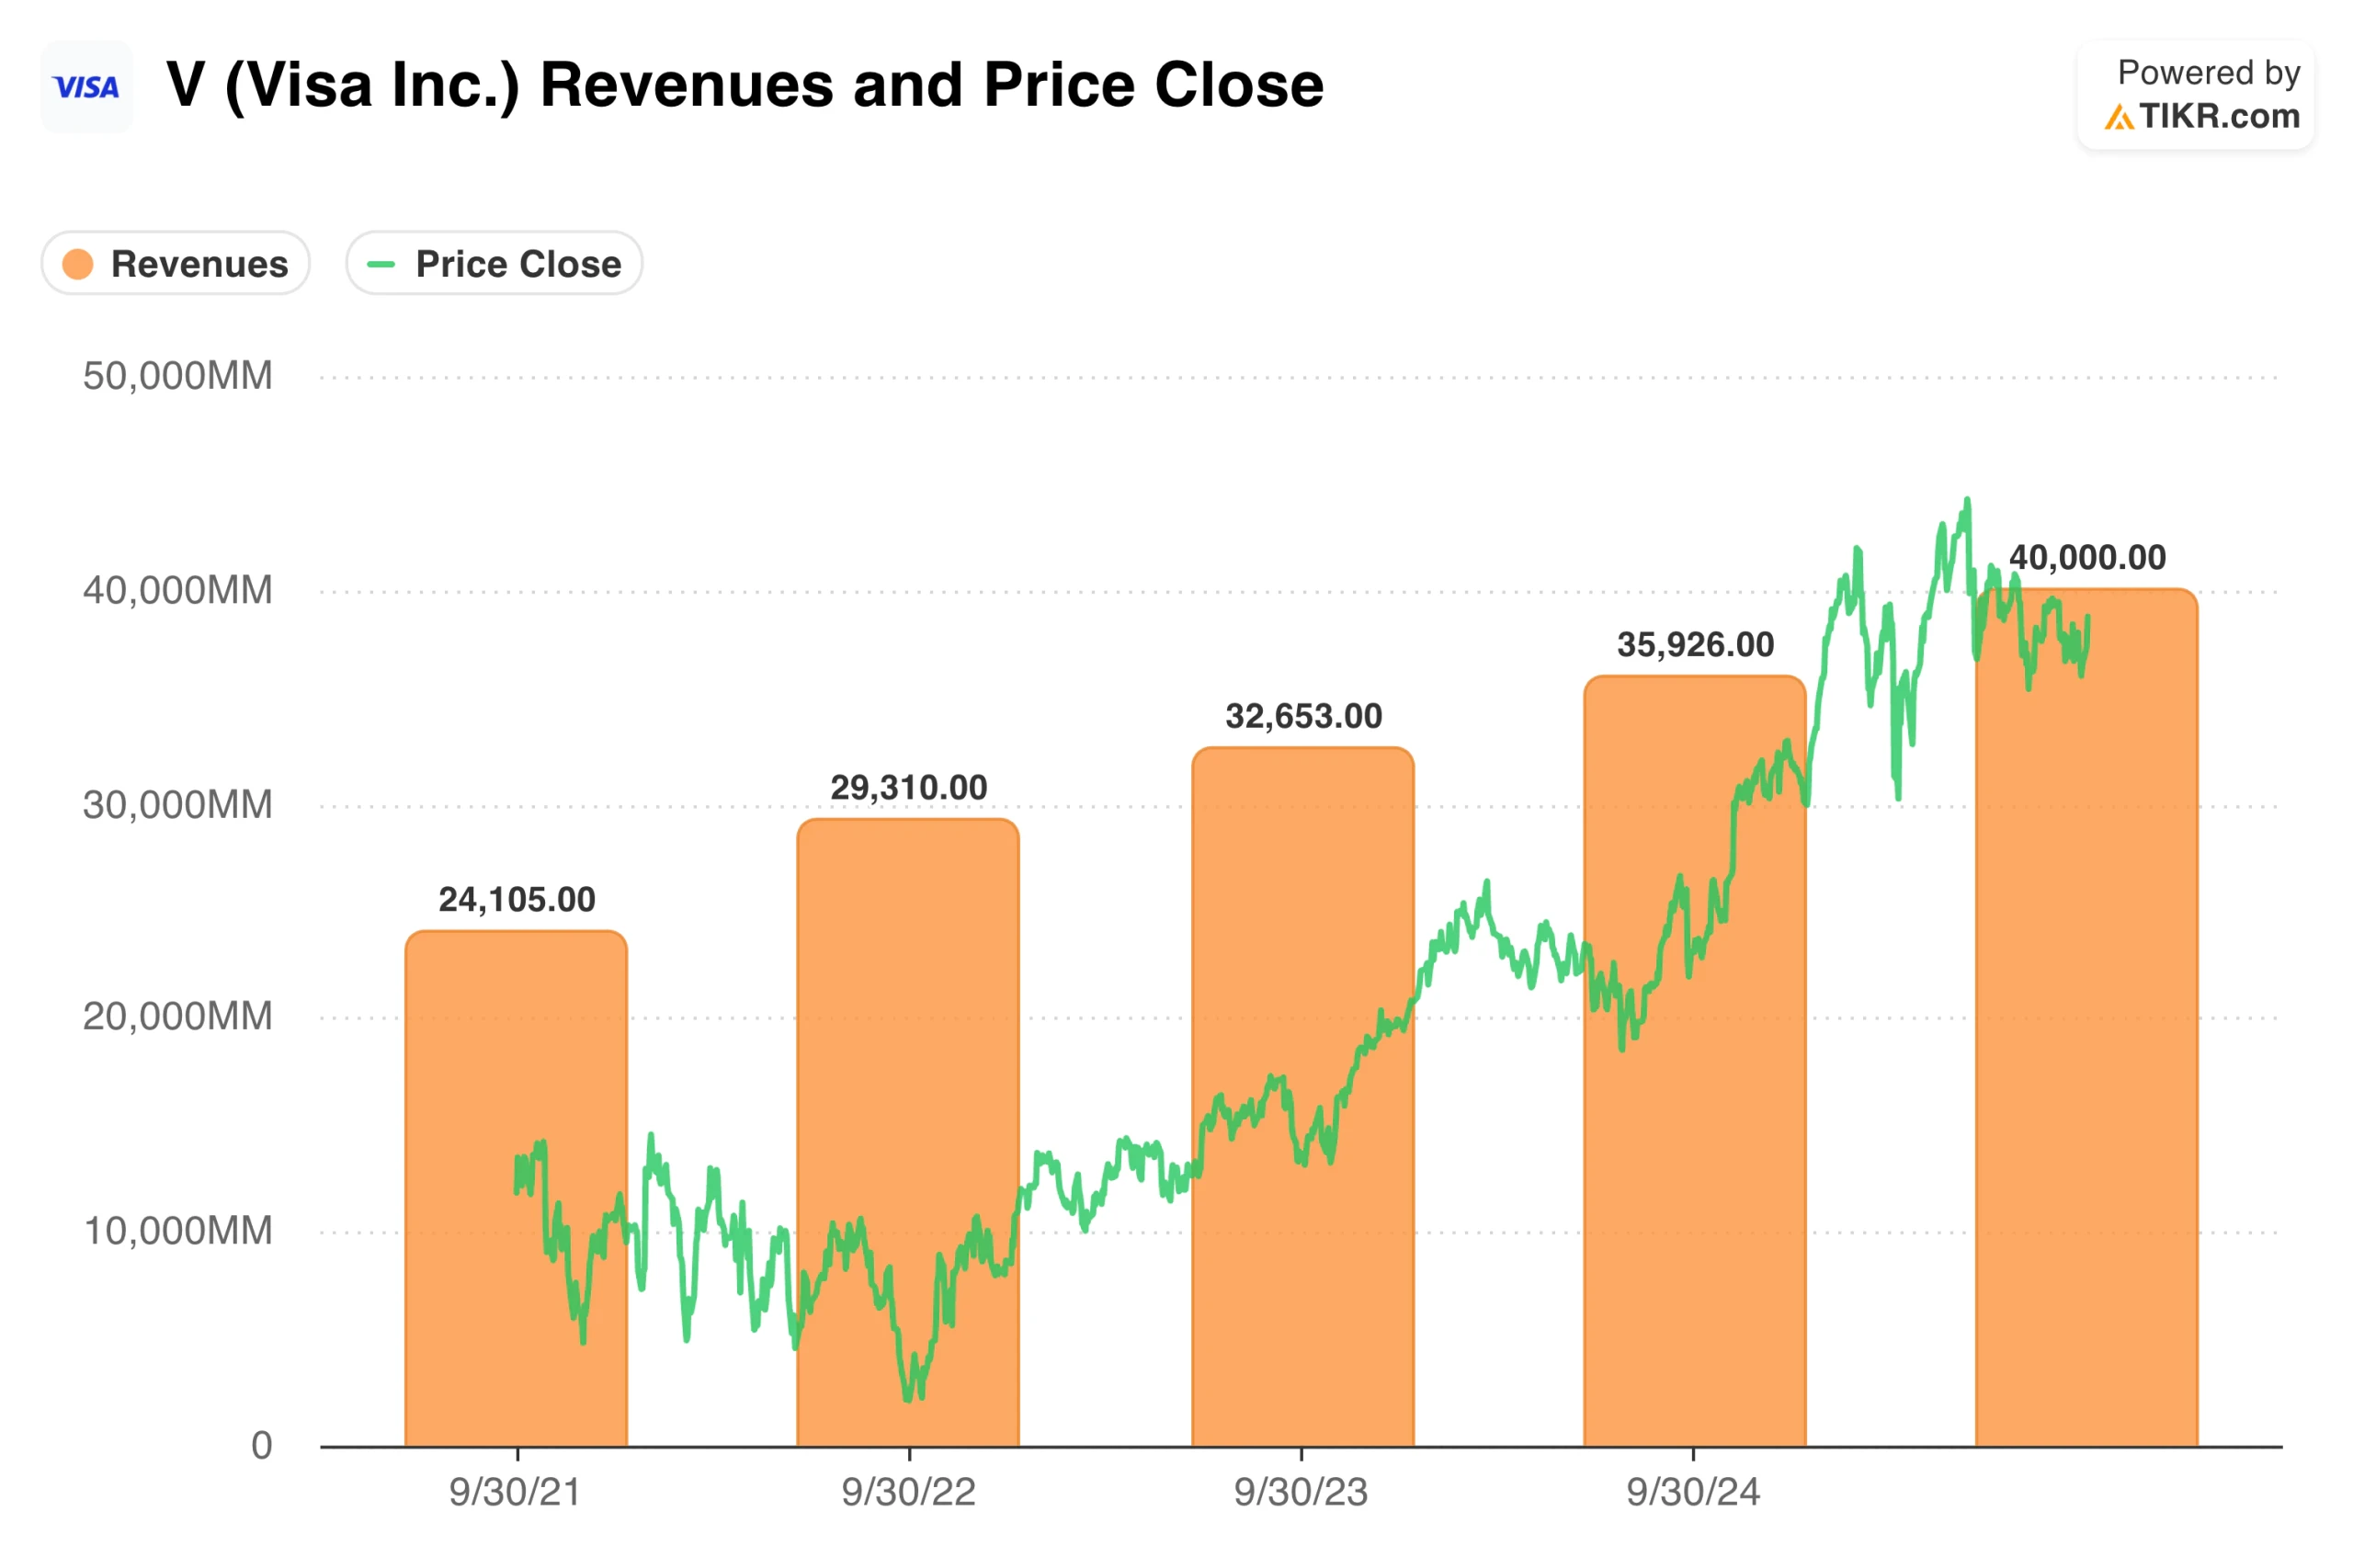
TIKR tip: TIKR’s Estimates tab shows analyst consensus expectations for revenue and earnings growth for companies like Visa (V). These estimates reflect the baseline assumptions embedded in current prices and provide a starting point for assessing what growth the market expects.
Estimate a company’s stock pricing power instantly (Free with TIKR) >>>
Reverse Engineering Market Expectations
You can estimate what growth rate the market is pricing in by working backward from the current valuation. If a stock trades at 35x forward earnings, you can calculate what growth rate would justify that multiple given a required rate of return. The math is not precise, but it provides a useful framework for understanding what assumptions underlie the current price.
A simplified approach uses the PEG ratio concept. If you believe a fair PEG ratio is 1.0, a stock at 35x earnings implies the market expects roughly 35% earnings growth. If you think a fair PEG is 1.5 for a high-quality business, that 35x multiple implies around 23% expected growth. The exact fair PEG depends on business quality, interest rates, and risk, but the exercise reveals the magnitude of growth required to justify the price.
More sophisticated approaches discount expected future cash flows and solve for the growth rate that produces a present value equal to the current stock price. If you assume a 10% discount rate and a terminal multiple of 15x in year ten, you can determine what growth rate between now and then would justify paying today’s price. Online calculators and spreadsheets make this reverse DCF analysis straightforward.
Compare the implied growth rate to what the business can realistically achieve. A company that has grown earnings 15% annually for a decade is unlikely to suddenly accelerate to 30%. One that is entering new markets or launching successful products might exceed its historical rate. The question is whether the implied growth rate falls within a realistic range given everything you know about the company and its industry.
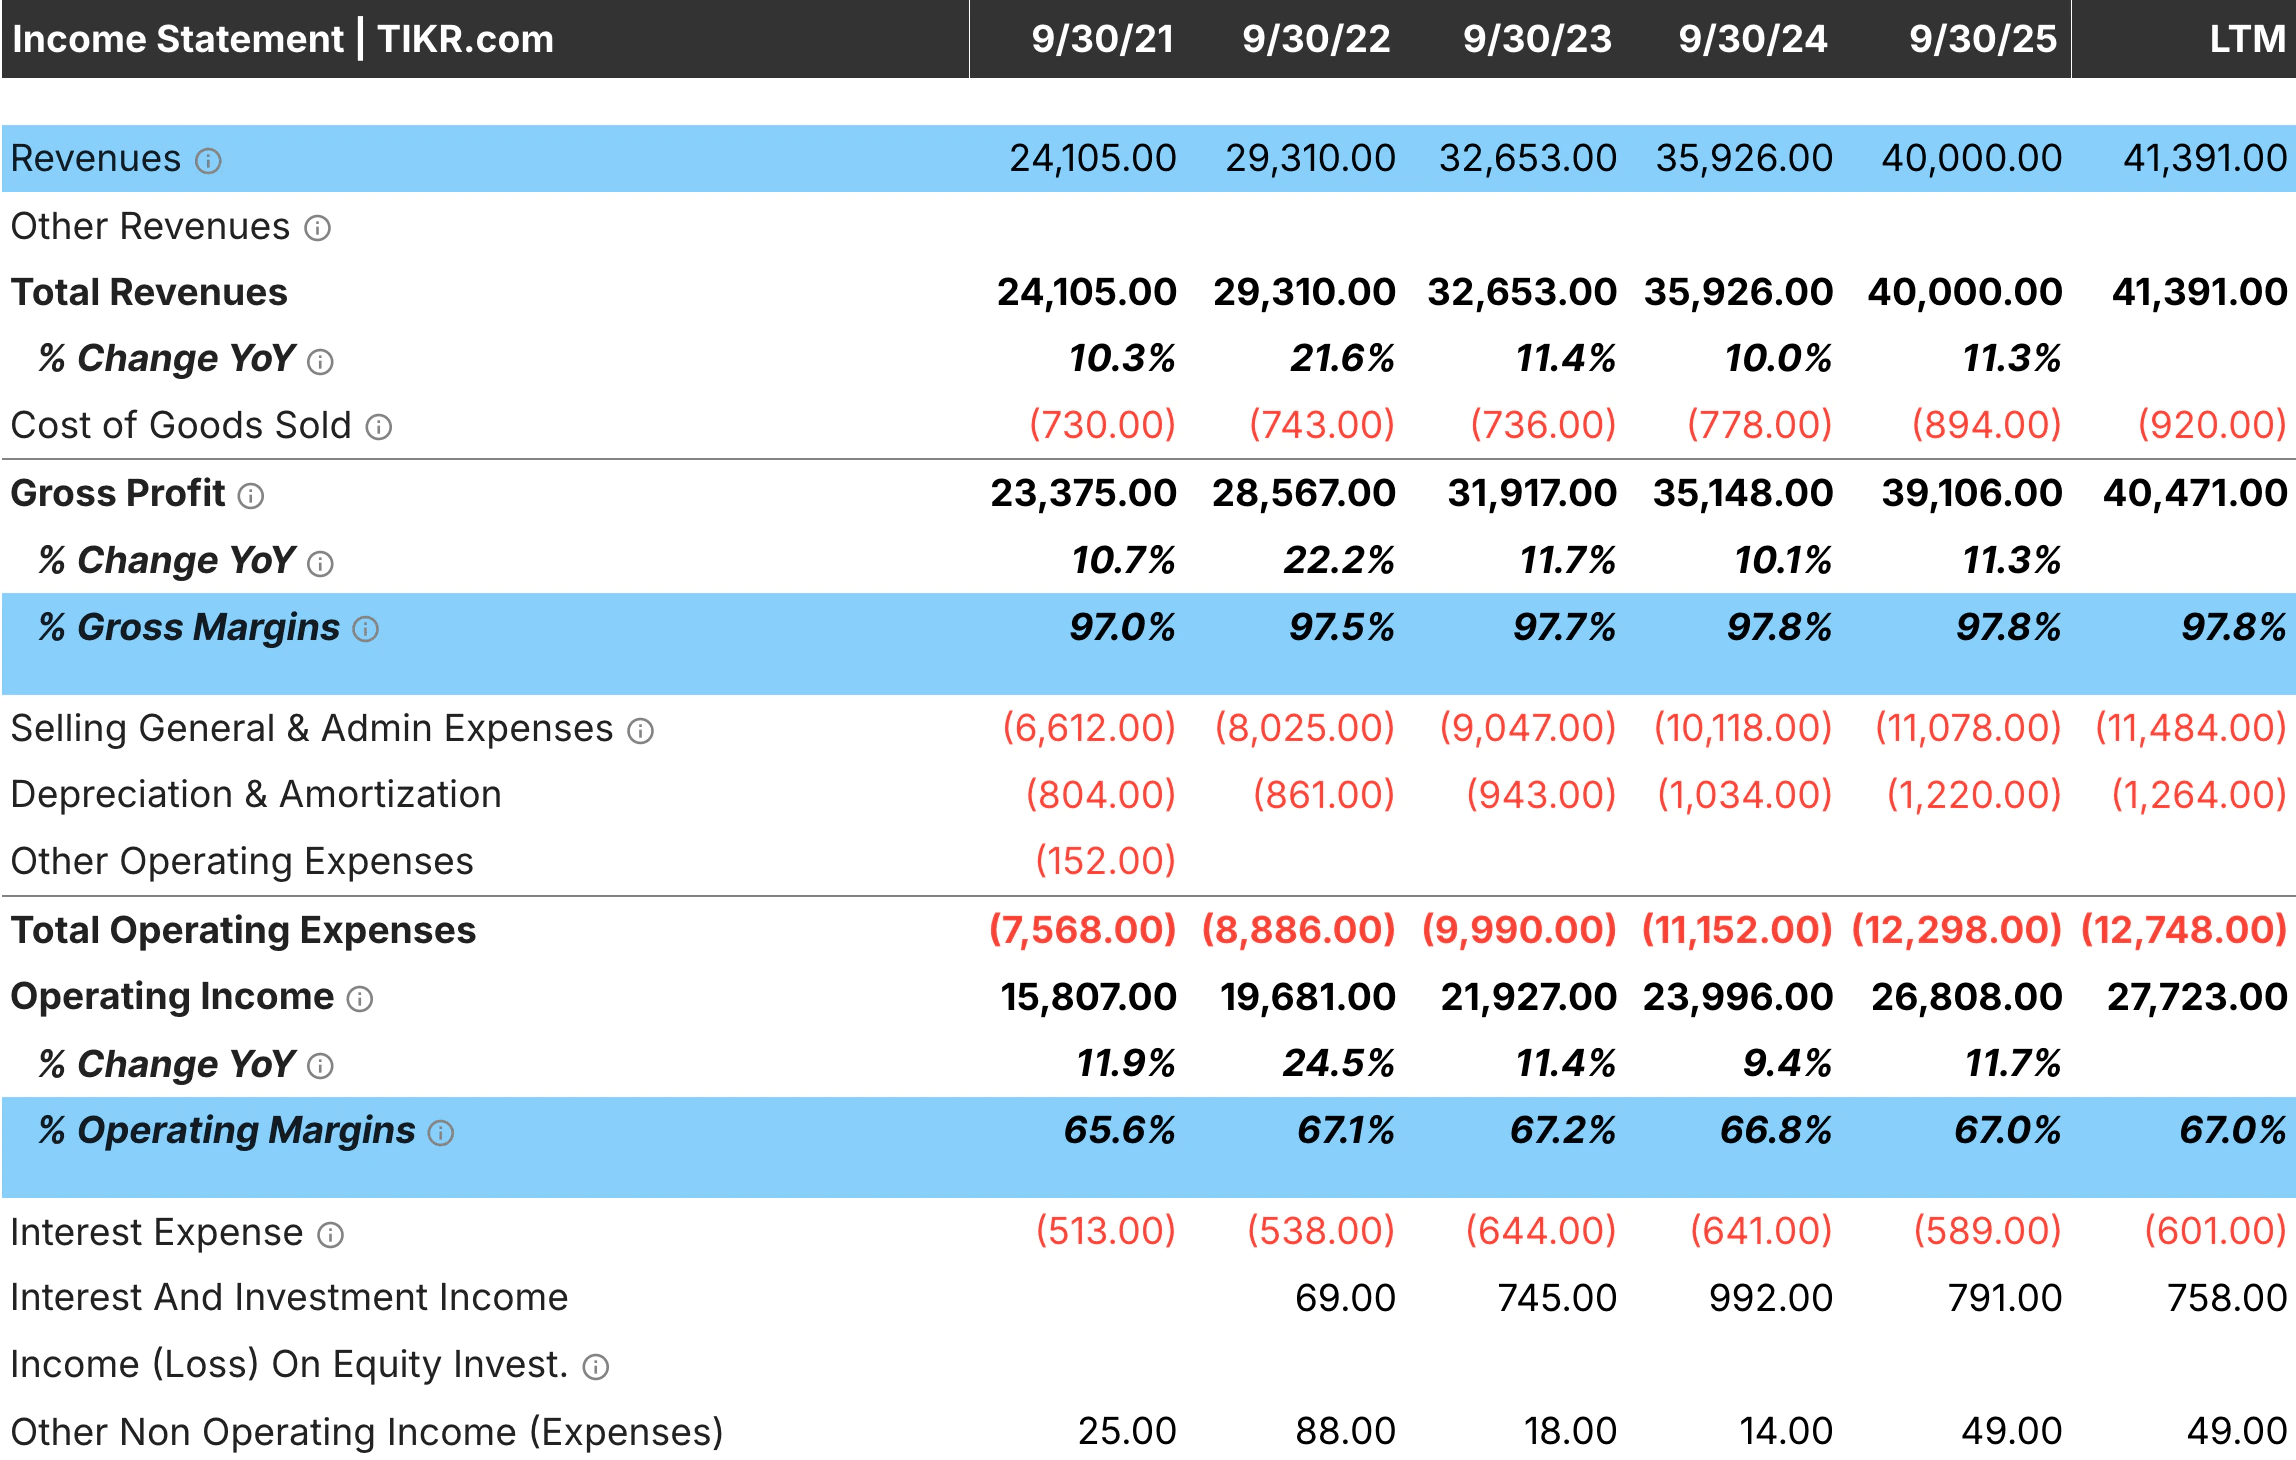
TIKR tip: Use TIKR’s historical growth rates in the Detailed Financials to assess what the company has actually achieved. Compare this to the implied growth rate from current valuation to see whether the market is extrapolating realistic performance or assuming acceleration.
Warning Signs of Excessive Expectations
Certain patterns suggest the market is pricing in growth that will be difficult or impossible to achieve. Recognizing these warning signs helps avoid stocks where disappointment is likely regardless of business quality.
Valuation multiples at historic highs relative to the company’s own history indicate elevated expectations. A stock that has traded between 15x and 25x earnings for a decade and now trades at 40x is priced for something unusual. Either the business has fundamentally improved to justify a higher multiple, or expectations have become detached from reality. Absent clear evidence of structural change, reversion to historical norms is more likely than sustained premium valuation.
Growth deceleration accompanying high valuations creates particular risk. A company that grew 30% annually for five years but has slowed to 20% may still trade on its historical growth rate. The market often lags in adjusting expectations, maintaining premium multiples even as the growth engine cools. These situations tend to resolve painfully when investors finally accept that the glory days are over.
Analyst estimates clustered at optimistic levels suggest groupthink rather than independent analysis. When every analyst expects 25% growth and none expect 15%, the consensus may reflect hope rather than rigorous forecasting. Examine whether estimates have been consistently too high in recent years. If the company has missed estimates repeatedly while analysts maintain optimistic projections, current expectations may be similarly unrealistic.
Narrative-driven valuations often exceed what fundamentals support. A company riding a popular theme like artificial intelligence, clean energy, or digital transformation can see its multiple expand far beyond what its actual growth rate would justify. The story becomes more important than the numbers. These situations occasionally work out when the narrative proves correct, but more often they end with multiple compressions when enthusiasm fades.
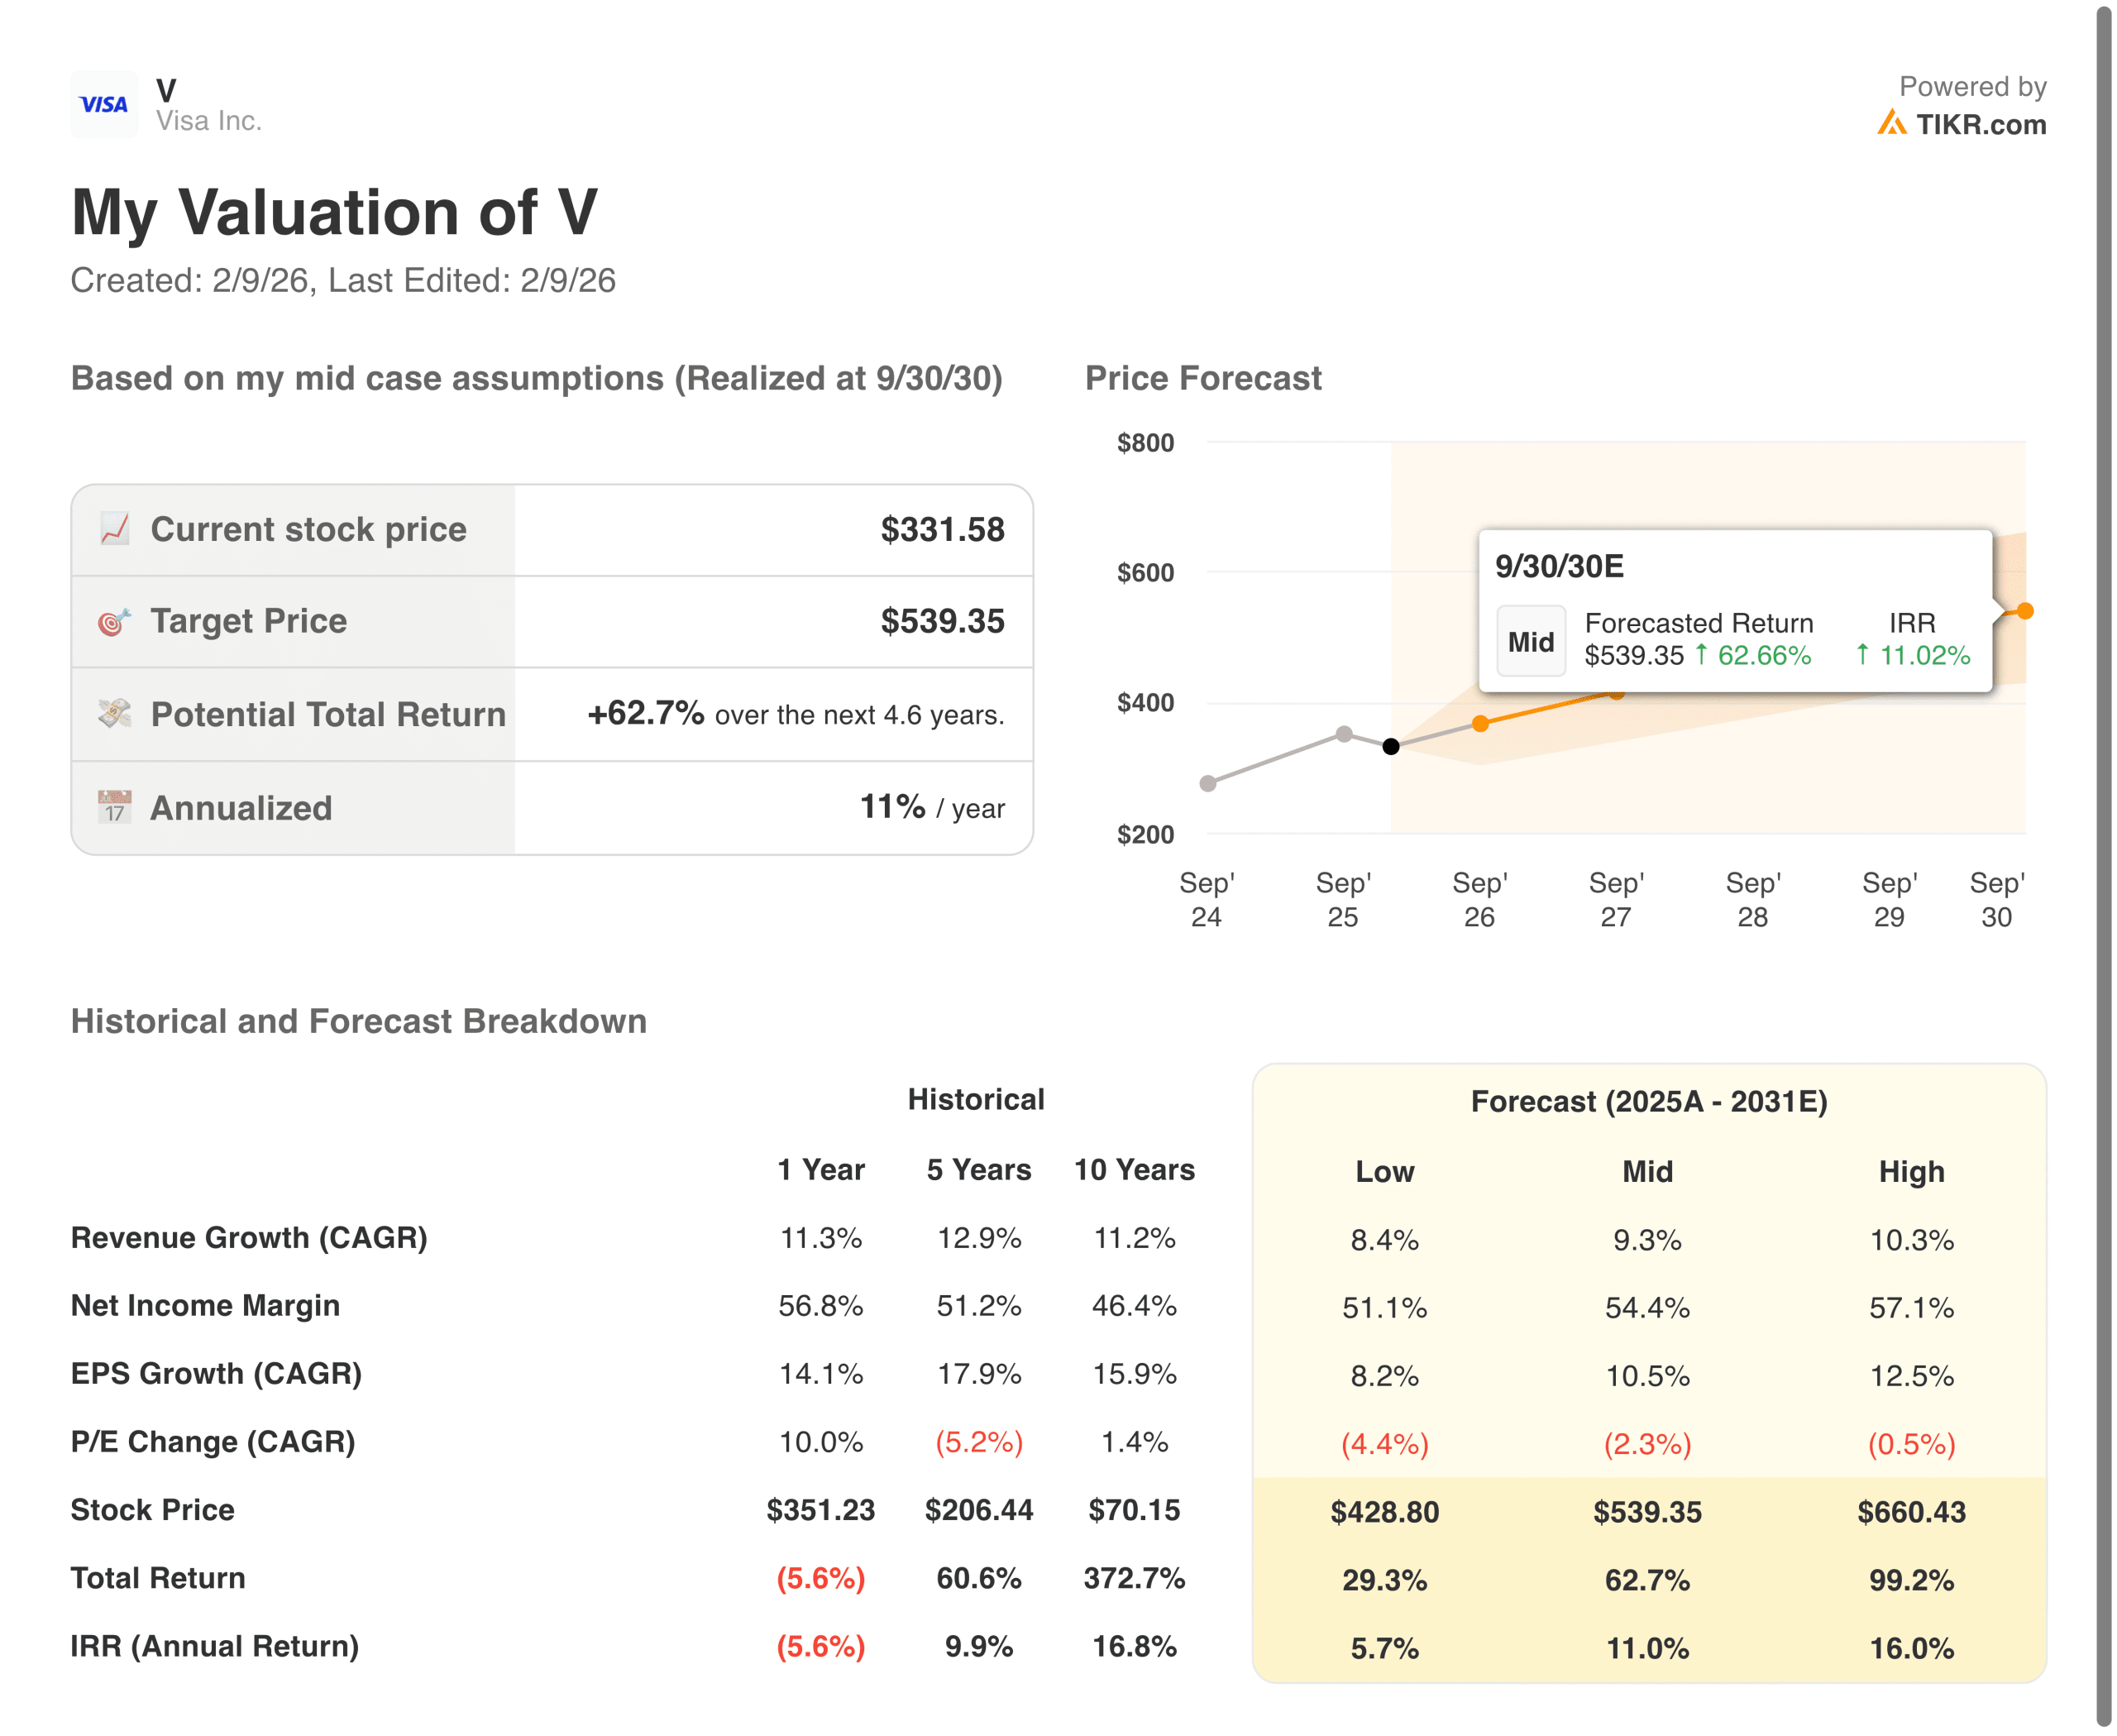
TIKR tip: TIKR’s Valuation models can help show current multiples alongside five-year and ten-year averages. A stock trading well above its historical range without corresponding fundamental improvement may have growth expectations that are too high.
Get the most up-to-date financial snapshots of thousands of stocks with TIKR (It’s free) >>>
When High Valuations Might Be Justified
Not every expensive-looking stock has growth fully priced in. Some companies genuinely deserve premium valuations because their growth is more durable, more certain, or higher quality than the market appreciates. Distinguishing these situations from overvaluation requires examining what makes the growth sustainable.
Durable competitive advantages support premium valuations because they increase confidence that growth will continue. A company with network effects, high switching costs, or irreplaceable brands can sustain growth longer than competitors without these protections. The market may correctly assign a higher multiple to this durability, but it may also underestimate just how long the growth can persist. When moats are truly wide, even premium multiples can prove cheap.
Reinvestment runway matters as much as current growth rate. A company growing 20% annually with opportunities to redeploy capital at high returns for another decade is worth more than one growing 20% but approaching market saturation. The first company’s growth has years to compound. The second’s growth may slow sharply once expansion opportunities dry up. A high multiple on the first might be justified while the same multiple on the second is excessive.
Margin expansion potential creates growth beyond revenue. A company growing revenue 15% while expanding operating margins from 15% to 25% over five years will see earnings grow far faster than sales. If the market focuses on revenue growth and misses the margin opportunity, it may underprice the true earnings growth potential. These situations reward investors who look beyond the top line.
Secular tailwinds can extend growth longer than historical patterns suggest. A company benefiting from demographic shifts, technology adoption, or regulatory changes may sustain above-average growth well beyond what comparable companies achieved historically. The market often anchors to historical norms and underestimates how long favorable conditions can persist.

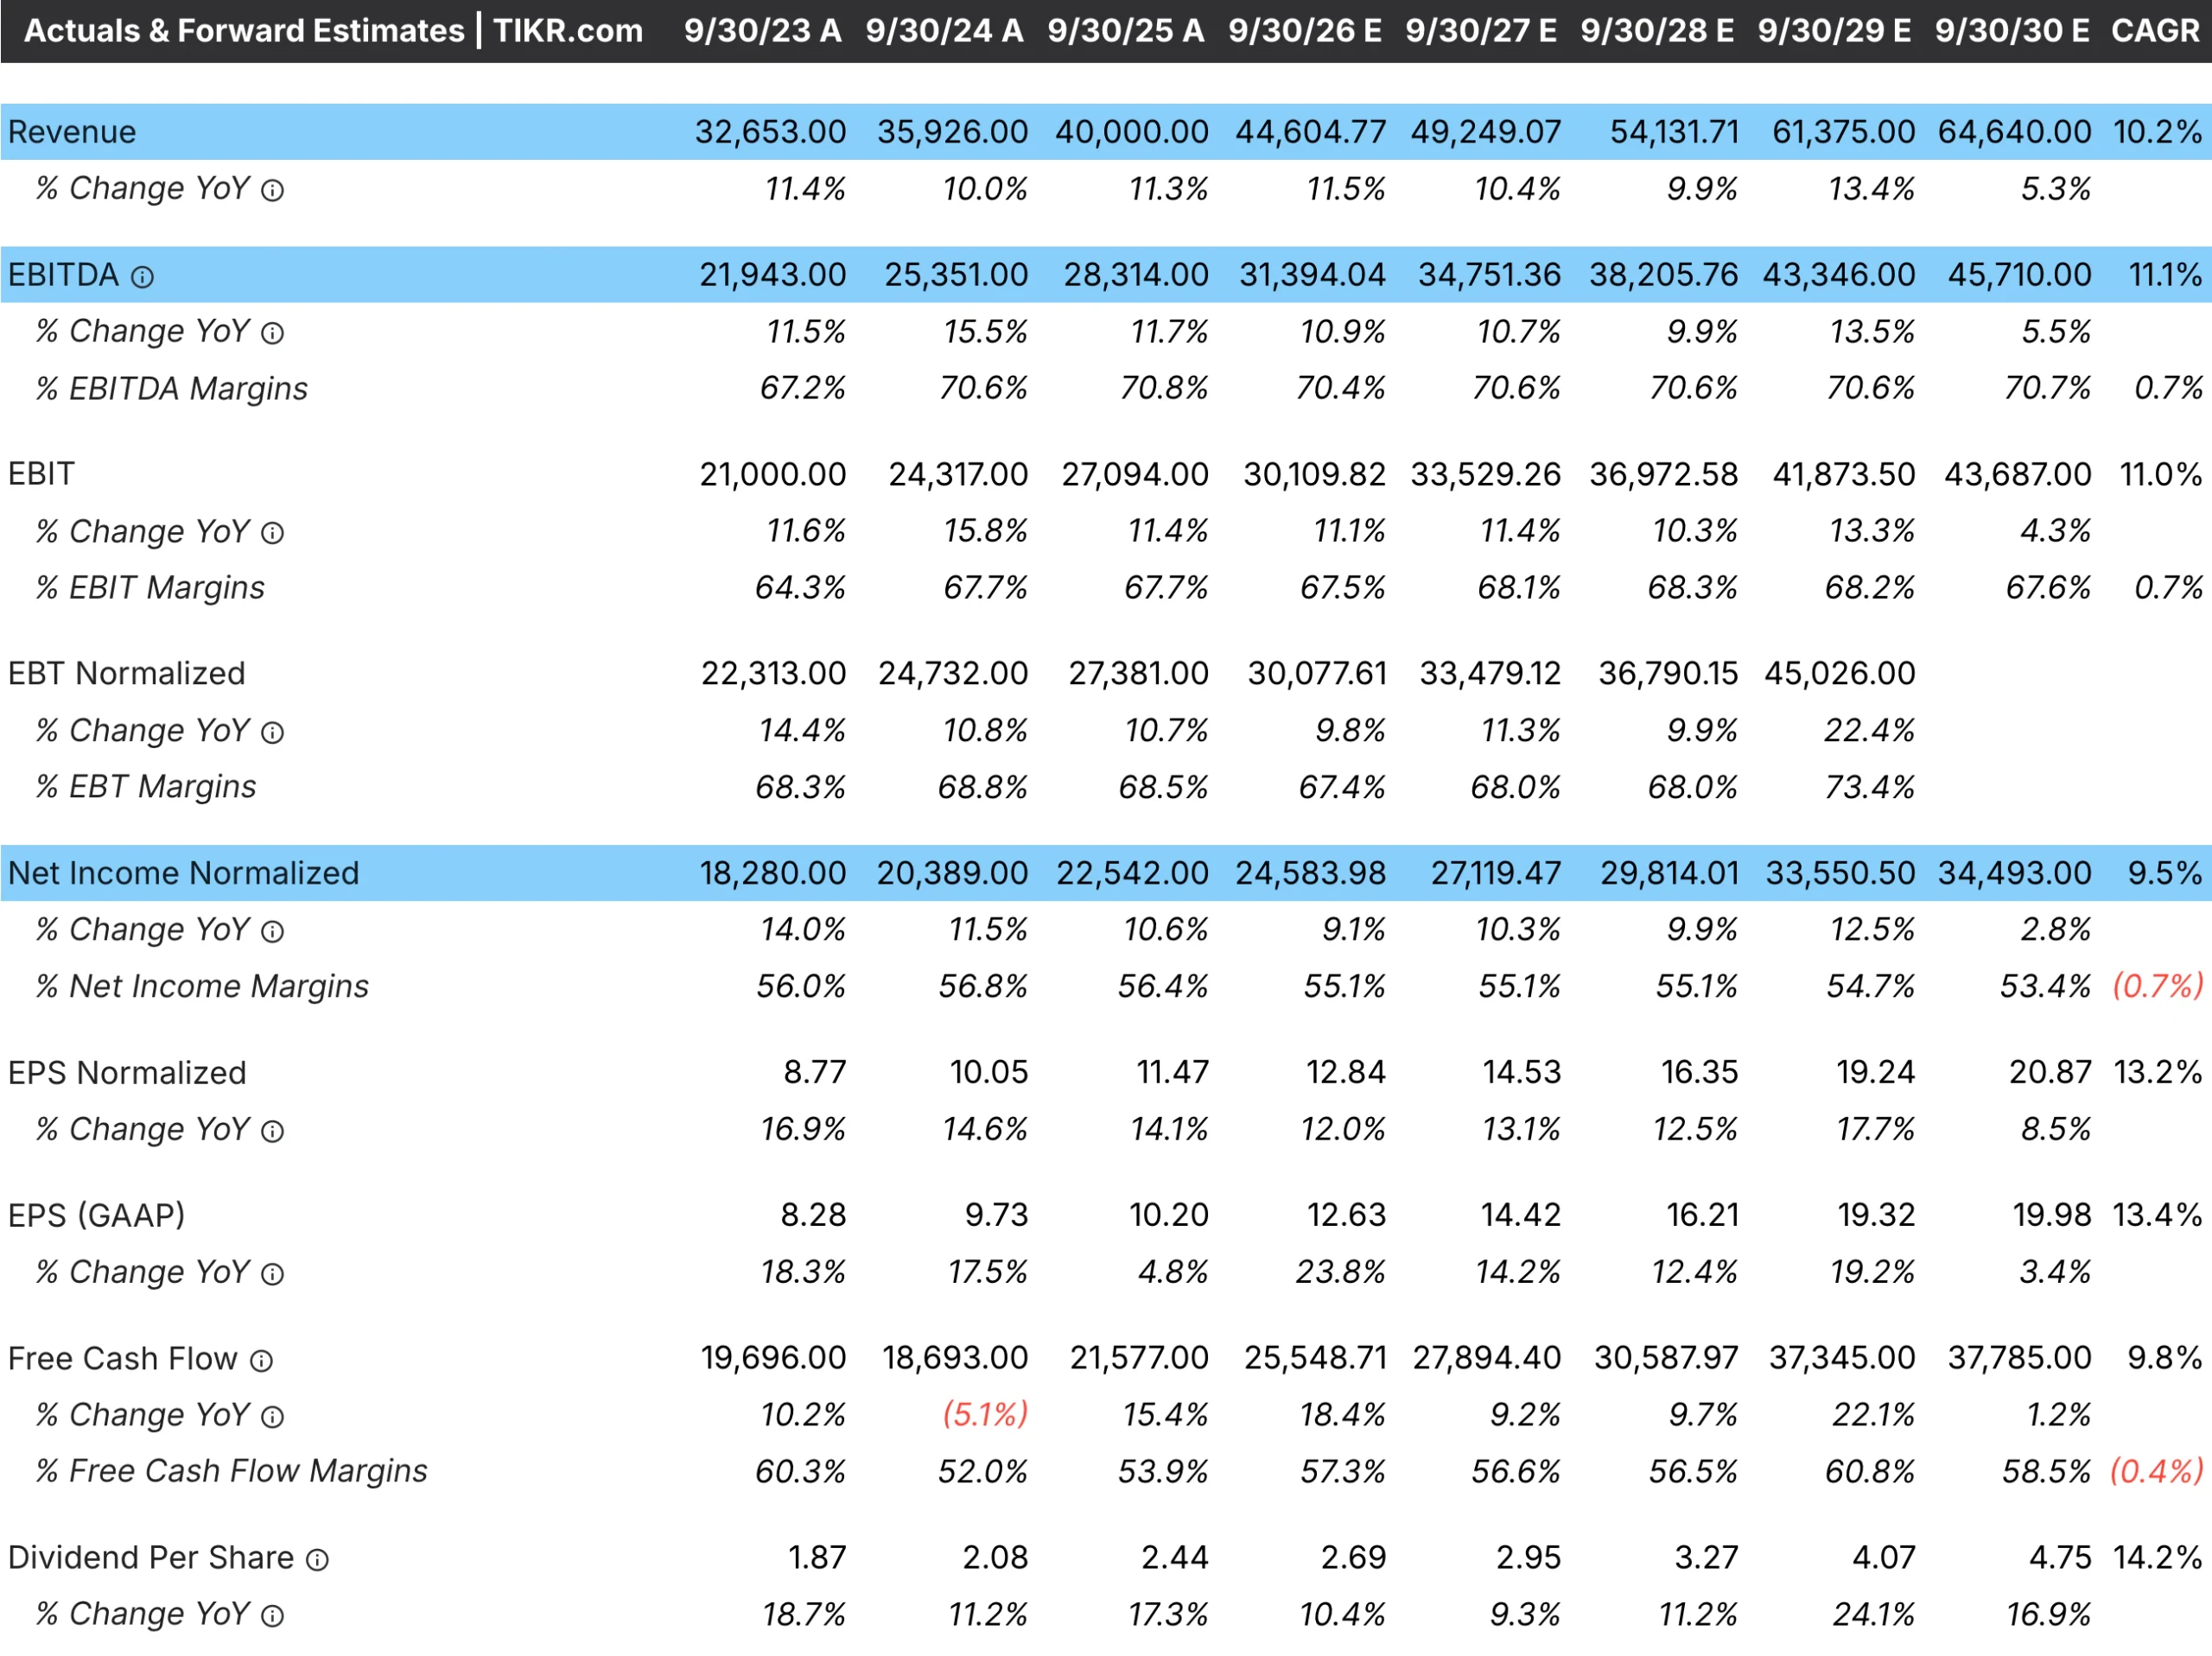
TIKR tip: Review margin trends and analyst expectations for margin expansion in TIKR. A company with both revenue growth and margin expansion potential may have more earnings growth than the market appreciates.
The Role of Estimate Revisions
Stock prices respond not just to whether companies hit expectations but to whether expectations are rising or falling. A stock with growth priced in can still appreciate if analysts keep raising estimates. Conversely, a stock with reasonable expectations can decline if estimates are cut even when the company performs adequately.
Rising estimates create a virtuous cycle. Analysts raise forecasts, which makes the valuation look more reasonable, which attracts buyers, which pushes up the price, which is then justified by the higher estimates. Stocks in this cycle can run further than valuation alone would suggest because the goalpost keeps moving.
Falling estimates create the opposite dynamic. Analysts cut forecasts, making the valuation look stretched, which triggers selling, which pushes down the price, which prompts more estimate cuts as sentiment sours. Even a stock with reasonable starting expectations can suffer extended declines when the estimate revision cycle turns negative.
The direction of estimate revisions often matters more than the absolute level for near-term stock performance. A company expected to grow 20% that sees estimates rise to 22% will likely outperform one expected to grow 25% that sees estimates fall to 23%. The first is beating rising expectations, while the second is missing falling ones, even though the second company’s growth is higher in absolute terms.
Monitoring the estimate momentum helps identify whether growth expectations are likely to rise or fall from current levels. Consistent upward revisions suggest the market is still catching up to the company’s true potential. Consistent downward revisions suggest the market is belatedly recognizing that growth is slowing.
TIKR tip: Track estimate revisions over time in TIKR’s Estimates tab. Companies with consistently rising estimates may have growth that is still underappreciated. Those with falling estimates may have growth that was overpriced.
Run a competitor analysis on TIKR for the top stocks in your portfolio (It’s free) >>>
Assessing Your Own Growth Expectations
The market’s expectations only matter relative to your own view. To determine whether growth is priced in, you need an independent assessment of what growth the company can realistically achieve over your investment horizon.
Build your growth estimate from the bottom up rather than extrapolating historical rates. Examine the drivers of revenue growth: volume increases, price increases, new products, geographic expansion, and market share gains. Assess the sustainability of each driver. A company that has grown through price increases may face limits if customers become price-sensitive. One gaining share in a growing market may have more runway.
Consider the base effect. A company that has grown from $1 billion to $10 billion in revenue faces a harder task growing another 10x than it did achieving its initial growth. Large companies find it increasingly difficult to sustain high percentage growth rates because the absolute dollar growth required becomes enormous. A 20% growth rate that was easy at $1 billion requires $20 billion of incremental revenue at $100 billion.
Examine what management says about growth expectations and their track record of meeting guidance. Leaders who consistently forecast 15% growth and deliver 18% have a pattern of under-promising and over-delivering. Those who forecast 25% and deliver 15% have a pattern of disappointing. Past accuracy helps calibrate how much weight to give current guidance.
Apply appropriate skepticism. Companies always paint optimistic pictures of their futures. Analysts often accept management narratives uncritically. Your job is to identify where reality might fall short of expectations and where it might exceed them. A conservative growth estimate that proves accurate is more valuable than an optimistic one that disappoints.
TIKR tip: Use TIKR’s historical financials to ground your growth assumptions in the company’s actual performance. Compare your estimate to consensus expectations to see whether you are more or less optimistic than the market.
Track company financials to quickly review pricing power with TIKR (It’s free) >>>
The TIKR Takeaway
Determining whether growth is priced in is essential for avoiding the trap of buying great businesses at terrible prices. A high-quality company can still generate poor investment returns if the stock price already reflects all the growth that will materialize. Your return depends not on absolute growth but on growth relative to expectations.
The assessment requires reverse-engineering the market’s growth assumptions, comparing them to realistic expectations based on business fundamentals, and monitoring for warning signs that expectations have become excessive. High valuations relative to history, decelerating growth, clustered analyst optimism, and narrative-driven enthusiasm all suggest growth may be fully or over-priced. Durable competitive advantages, long reinvestment runways, and margin expansion potential can justify premium valuations when properly understood.
TIKR provides the data to make this assessment systematically. Historical financials reveal what growth the company has actually achieved. Analyst estimates reflect market expectations. Valuation history indicates whether current multiples are elevated. Together, these tools help you determine whether you are paying a fair price for future growth or overpaying for expectations that may never materialize.
The best investments combine genuine growth potential with reasonable expectations. Finding them requires understanding both what the business can achieve and what the stock price already assumes.
Find undervalued stocks in less than 60 seconds with TIKR’s new Valuation Model (It’s free) >>>
Value Any Stock in Under 60 Seconds with TIKR
With TIKR’s new Valuation Model tool, you can estimate a stock’s potential share price in under a minute.
All it takes is three simple inputs:
- Revenue Growth
- Operating Margins
- Exit P/E Multiple
If you’re not sure what to enter, TIKR automatically fills in each input using analysts’ consensus estimates, giving you a quick, reliable starting point.
From there, TIKR calculates the potential share price and total returns under Bull, Base, and Bear scenarios so you can quickly see whether a stock looks undervalued or overvalued.
See a stock’s true value in under 60 seconds (Free with TIKR) >>>
Looking for New Opportunities?
- Discover which stocks billionaire investors are purchasing, so you can follow the smart money.
- Analyze stocks in as little as 5 minutes with TIKR’s all-in-one, easy-to-use platform.
- The more rocks you overturn… the more opportunities you’ll uncover. Search 100K+ global stocks, global top investor holdings, and more with TIKR.
Disclaimer:
Please note that the articles on TIKR are not intended to serve as investment or financial advice from TIKR or our content team, nor are they recommendations to buy or sell any stocks. We create our content based on TIKR Terminal’s investment data and analysts’ estimates. Our analysis might not include recent company news or important updates. TIKR has no position in any stocks mentioned. Thank you for reading, and happy investing!