
Key Takeaways:
- Logistics Expansion: Carvana expanded same-day delivery to Eugene on February 3, 2026, extending coverage across more than 20 states and reinforcing throughput after Q3 retail unit sales reached 156000 vehicles.
- Insider Activity: Carvana disclosed on February 3, 2026 that both its CFO and COO disposed of common shares, an event occurring after a 54% stock increase over the past 12 months and material multiple expansion.
- Valuation Framework: Carvana could reach $641 by December 2027 based on 32% revenue CAGR and 10% operating margins, supporting earnings power consistent with a 51x terminal P/E multiple.
- Return Profile: Carvana’s $641 target represents 64% upside from the current $392 price, equating to a 30% annualized return over roughly 2 years based on valuation compounding math.
Breaking Down the Case for Carvana
Carvana Co. (CVNA) expanded same-day vehicle delivery to Eugene on February 3, 2026, a move extending logistics coverage across more than 20 states and positioning the company to support higher retail unit volumes in 2026.
That expansion follows $18 billion in last twelve month revenue and $4 billion in gross profit with a 21% gross margin, reflecting improved vehicle sourcing discipline after revenue declined to $11 billion in 2023.
Over the last 12 months, roughly $2 billion in cost discipline translated into Carvana stock’s $2 billion of operating income and a 9% operating margin, marking a sharp turnaround from the negative 11% margin posted in 2022.
In Q3 2025, Carvana reported $6 billion in revenue and 156000 retail units, yet shares declined 14% after earnings of $1 per share missed expectations and Q4 guidance pointed to just above 150000 units.
On February SEC filings showed both the CFO and COO disposed of common shares following a 54% rally over the prior 12 months, while analysts maintain a $492 average price target and a $600 high target against a $392 current price.
Chief Executive Officer Ernie Garcia stated, “Our focus remains on driving profitable growth and increasing operational efficiency,” reinforcing management’s emphasis on sustaining margins near 10% while scaling revenue toward $20 billion in 2025.
With shares trading near 66x trailing earnings and a market value of $90 billion, investors are weighing 46% projected revenue growth in 2025 against valuation sensitivity if quarterly volumes stall near 150000 units.
What the Model Says for CVNA Stock
Carvana reflects elevated expectations after 26.9% revenue growth and margin recovery, positioning capital intensity against competitive execution in a consolidating used vehicle market.
The model assumes 31.9% revenue growth, 10.2% margins, and a 51.3x exit multiple, producing a $640.84 target price grounded in sustained operating leverage.
This framework implies 63.6% total upside from $391.69 and a 29.8% annualized return, materially exceeding typical equity return thresholds over 1.9 years.
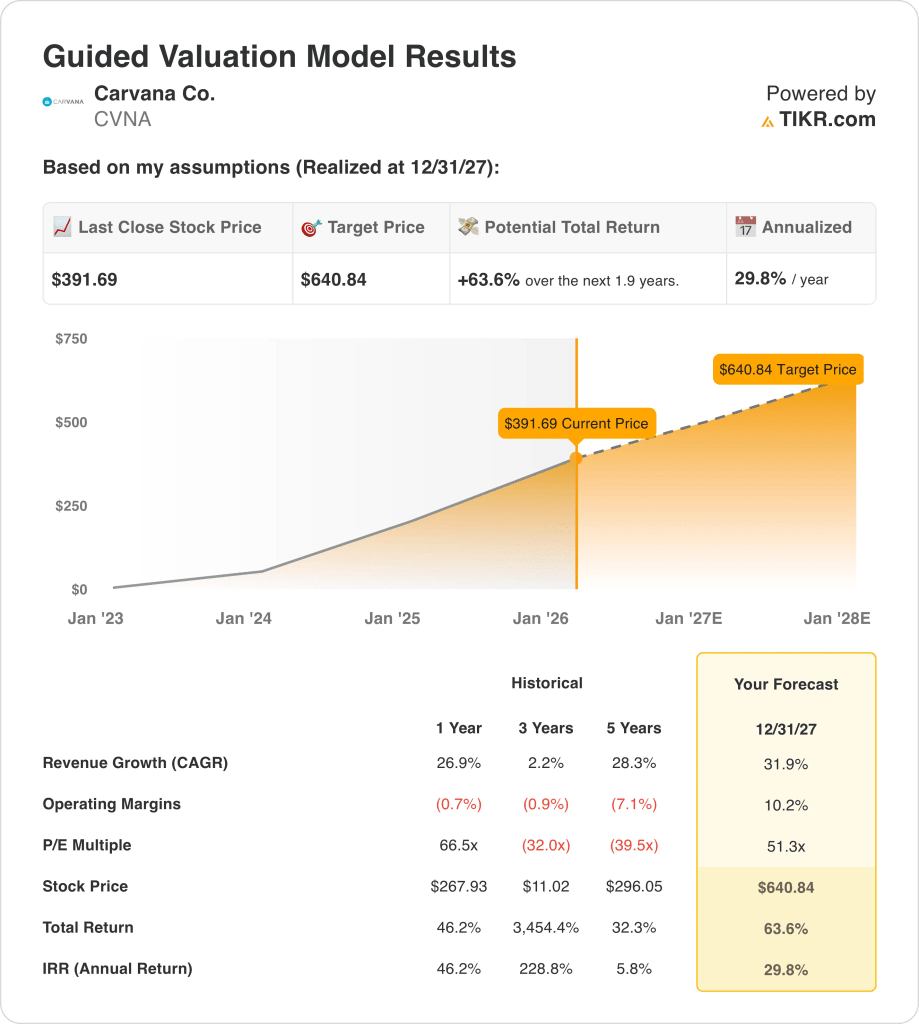
The model indicates a Buy, as a 29.8% annualized return justifies equity risk despite a 51.3x exit multiple requiring sustained margin and growth execution.
With a 29.8% annualized return versus a 10% equity hurdle rate, the model indicates risk-adjusted capital appreciation rather than preservation, as valuation assumes 31.9% growth and 10.2% margins sustain operational normalization.
Our Valuation Assumptions
TIKR’s Valuation Model lets you plug in your own assumptions for a company’s revenue growth, operating margins, and P/E multiple, and calculates the stock’s expected returns.
Here’s what we used for Carvana stock:
1. Revenue Growth: 31.9%
Carvana stock’s revenue grew 26.9% over the last year after contracting 20.8% in 2023, showing recovery but also highlighting cyclicality in used vehicle demand and sensitivity to financing conditions.
Last twelve month revenue reached $18 billion with Q3 2025 revenue of $6 billion and 156000 retail units, providing volume momentum that supports a 31.9% forward growth path.
Now, sustaining 31.9% requires continued unit expansion above 150,000 quarterly levels and stable pricing, while any slowdown in consumer demand or credit tightening compresses revenue quickly given operating leverage.
This exceeds the 1-year historical growth rate of 26.9%, as sustained unit recovery and expanding logistics density must translate into incremental throughput, leaving limited tolerance for cyclical demand normalization.
2. Operating Margins: 10.2%
Carvana stock’s operating margins improved from negative 11% in 2022 to 9% over the last twelve months, demonstrating material cost resets and fixed-cost leverage.
Gross margin reached 21% on $18 billion of revenue while operating income rose to $2 billion, supporting a 10.2% margin assumption tied to scale and expense discipline.
Achieving 10.2% depends on holding gross margins near 21% and controlling $2 billion of operating expenses, while competitive pricing or higher reconditioning costs pressure earnings rapidly.
This sits above the 1-year operating margin of 9%, as fixed-cost leverage and higher unit contribution must persist, leaving limited flexibility if pricing pressure or cost inflation compresses profitability.
3. Exit P/E Multiple: 51.3x
Shares currently trade at 56.84x NTM Price to Normalized Earnings as of 2/10/26, with trailing earnings multiples near 66x, showing elevated market expectations for sustained profitability.
The model applies a 51.3× exit multiple to normalized earnings under a 31.9% growth and 10.2% margin framework, capitalizing terminal profits without assuming further re-rating beyond execution.
This multiple sits below the 56.84x market assumption for 2026, because current pricing already capitalizes recovery momentum, and the model reduces expansion risk by normalizing valuation toward execution durability.
This is below the 1-year historical P/E of 66.5x, because earnings stabilization lowers speculative premium, and the model assumes compression that limits valuation cushion if growth or margins underperform.
What Happens If Things Go Better or Worse?
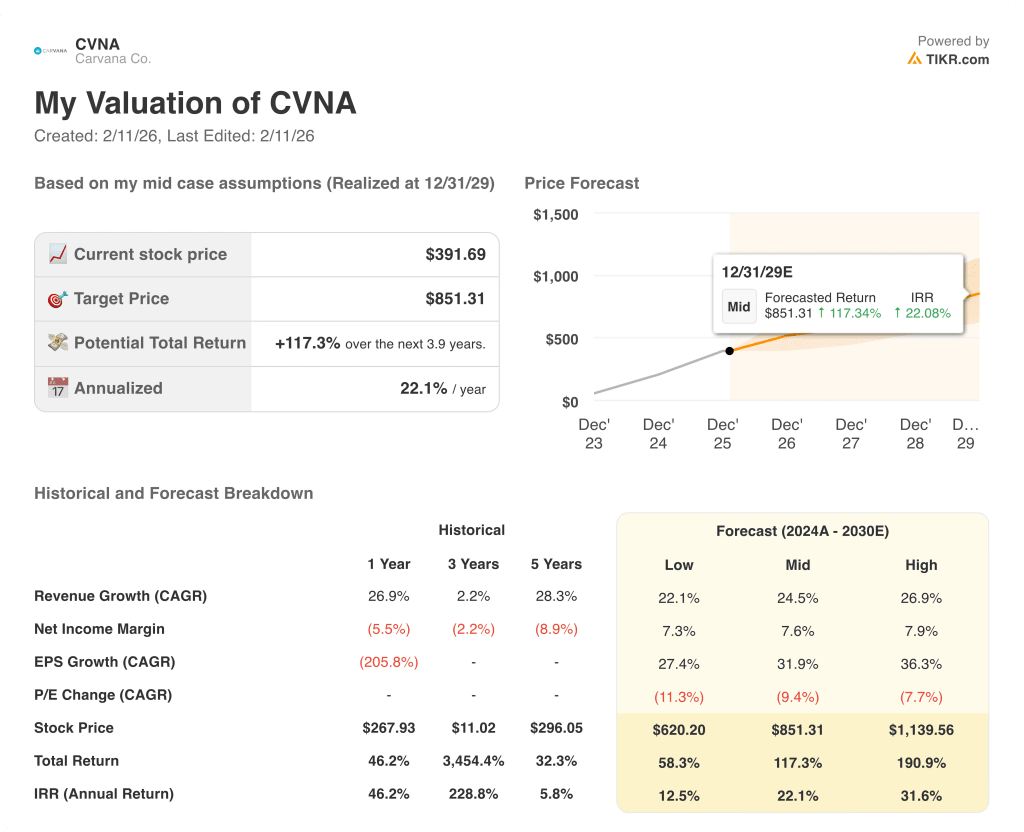
Carvana stock valuation reflects execution in unit growth, margin normalization, and capital discipline, creating a defined range through 2029.
- Low Case: If used vehicle demand softens and cost leverage stalls, revenue grows around 22.1% and net margins hold near 7.3% → 12.5% annualized return.
- Mid Case: With retail volumes scaling and operating discipline maintained, revenue growth near 24.5% and net margins improving toward 7.6% → 22.1% annualized return.
- High Case: If logistics density improves and unit economics expand further, revenue reaches about 26.9% and net margins approach 7.9% → 31.6% annualized return.
How Much Upside Does Carvana Stock Have From Here?
With TIKR’s new Valuation Model tool, you can estimate a stock’s potential share price in under a minute.
All it takes is three simple inputs:
- Revenue Growth
- Operating Margins
- Exit P/E multiple
If you’re not sure what to enter, TIKR automatically fills in each input using analysts’ consensus estimates, giving you a quick, reliable starting point.
From there, TIKR calculates the potential share price and total returns under Bull, Base, and Bear scenarios so you can quickly see whether a stock looks undervalued or overvalued.
Looking for New Opportunities?
- See what stocks billionaire investors are buying so you can follow the smart money.
- Analyze stocks in as little as 5 minutes with TIKR’s all-in-one, easy-to-use platform.
- The more rocks you overturn… the more opportunities you’ll uncover. Search 100K+ global stocks, global top investor holdings, and more with TIKR.
Disclaimer:
Please note that the articles on TIKR are not intended to serve as investment or financial advice from TIKR or our content team, nor are they recommendations to buy or sell any stocks. We create our content based on TIKR Terminal’s investment data and analysts’ estimates. Our analysis might not include recent company news or important updates. TIKR has no position in any stocks mentioned. Thank you for reading, and happy investing!