Key Takeaways:
- Finance Leadership Change: The Trade Desk appointed Tahnil Davis as Interim CFO on January 24, and shares fell 7% to $34 as investors reacted to leadership transition during a year when the stock declined 68%.
- Guidance Reaffirmed: The Trade Desk reaffirmed Q4 revenue of at least $840 million and adjusted EBITDA of $375 million.
- Price Projection: The Trade Desk stock could reach $36 by 2027 as the model assumes 17% revenue growth, 22% operating margins, and a 14x exit P/E consistent with normalized earnings durability.
- Modeled Upside: The Trade Desk target implies 29% upside from the current $28 price, translating to a 15% annualized return over roughly 2 years if execution stabilizes.
The Trade Desk, Inc. (TTD) provides a self-service cloud platform that enables advertisers and agencies to purchase and optimize digital advertising across video, display, audio, and connected TV, supporting $2.8 billion in LTM revenue.
Trade Desk’s revenue expanded from $1.2 billion in 2021 to $2.4 billion in 2024, while gross profit reached $2.2 billion at a 79% margin and operating income rose to $0.5 billion with an 19% margin.
TTD’s operating expenses increased to $1.7 billion LTM as the company scaled R&D to $0.5 billion and SG&A to $1.2 billion, yet EBIT margins improved from 7% in 2022 to 19% LTM.
Last month, management appointed Tahnil Davis as Interim CFO effective January 24, and shares declined 7% to $34 even as the company reaffirmed Q4 revenue of at least $840 million and adjusted EBITDA of $375 million.
CEO Jeff Green stated, “Tahnil is an exceptionally strong operator and leader who understands our business inside and out,”.
Meanwhile, last January 6, Trade Desk announced OpenAds with support from publishers including Hearst and the Guardian, positioning the platform around transparent auctions and supply chain economics.
With revenue expected to reach $3.3 billion in 2026 and EBIT margins projected above 20%, the debate centers on whether a 14x multiple fairly values a platform that once traded above 60x during faster growth cycles.
What the Model Says for Trade Desk Stock
The Trade Desk combines 25.6% historical revenue growth with 10.3% margins, while LTM revenue reached $2.79 billion and operating income rose to $0.53 billion, supporting elevated but moderated expectations after a 67.7% stock decline in 2025.
The model assumes 16.5% revenue growth and 22.2% margins, below recent 25.6% growth but above the 17.0% 5-year margin average, and applies a 14.3x exit multiple just like how the market’s assumption for NTM P/E for a $36.36 target price.
That implies 29.2% total upside from $28.13 and a 14.6% annualized return over 1.9 years, compared with Street mean targets that fell from $130.94 to $53.48 as expectations reset.

The model signals a Buy, as a 14.6% annualized return exceeds a 10% equity hurdle and compensates for volatility in a stock that compressed from 64.45x NTM P/E to 14.28x within 12 months.
With a 14.6% annualized return above a 10% hurdle rate, the expected appreciation reflects earnings normalization rather than multiple expansion, as valuation already declined from 64.45x to 14.28x and embeds prior compression risk.
Our Valuation Assumptions
TIKR’s Valuation Model lets you plug in your own assumptions for a company’s revenue growth, operating margins, and P/E multiple, and calculates the stock’s expected returns.
Here’s what we used for Trade Desk stock:
1. Revenue Growth: 16.5%
TTD stock’s revenue expanded 25.6% over the past year and 29.9% over 5 years, while total revenue increased from $1.20 billion in 2021 to $2.44 billion in 2024 and $2.79 billion LTM.
Current execution includes Q4 revenue guidance of at least $840 million and EBITDA margins above 40%, which support continued double-digit expansion as connected TV adoption scales.
Sustaining 16.5% requires continued share gains against walled gardens and stable ad budgets, because any slowdown compresses operating leverage and reduces the margin expansion embedded in the model.
This is below the 1-year historical revenue growth of 25.6%, because scale increases and advertiser concentration limit incremental acceleration, and valuation depends on steady compounding rather than reacceleration.
2. Operating Margins: 22.2%
Trade desk stock’s operating margins improved from 10.3% in 2023 to 18.9% LTM as revenue scale absorbed fixed costs across R&D of $0.52 billion and operating expenses of $1.67 billion.
The model assumes 22.2% margins as revenue approaches $3.35 billion in 2026 and EBIT growth of 27.3% supports incremental leverage beyond current 18.9% levels.
Margin expansion requires disciplined expense control and sustained gross margins near 79%, while weaker demand or higher compensation costs reduce earnings sensitivity quickly.
This is above the 1-year operating margin of 10.3%, because fixed-cost leverage and EBITDA margins near 40% already sit in earnings, and further gains require consistent execution without cost slippage.
3. Exit P/E Multiple: 14.3x
The 14.3× exit multiple for TTD stock capitalizes normalized earnings under a maturing ad-tech profile with 16.5% revenue growth and 22.2% margins.
Market values NTM Price for Normalized Earnings at 14.3×, and the model also sets 14.3×.
The multiple reflects durable cash flow as EBITDA margins exceed 40%, and it avoids double counting optimism because growth and margin expansion already sit in earnings forecasts.
However, this is below the 1-year historical P/E of 30.2×, because investor risk tolerance reset after a 67.7% stock decline, and valuation expansion requires consistent earnings delivery without renewed volatility.
What Happens If Things Go Better or Worse?
The Trade Desk stock hinges on connected TV adoption, advertiser budget cycles, and disciplined expense control through 2029.
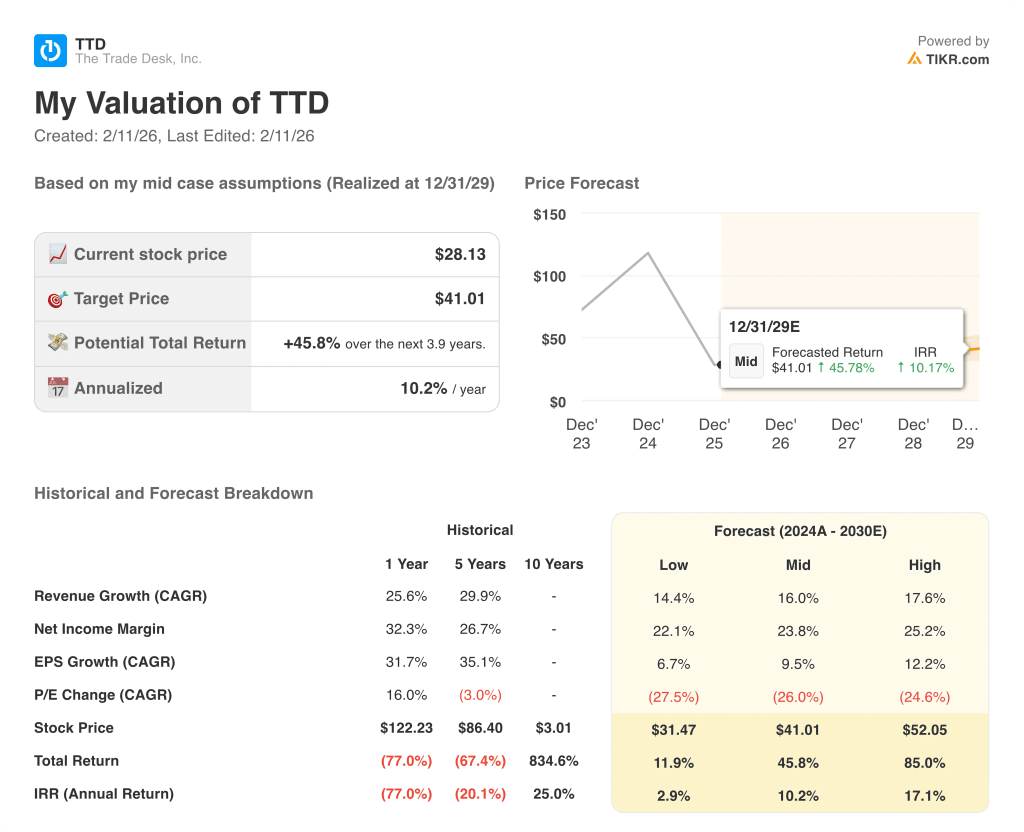
- Low Case: If ad budgets soften and competition intensifies, revenue grows 14.4% and net margins hold near 22.1% with valuation pressure → 2.9% annualized return.
- Mid Case: With steady CTV share gains and cost discipline, revenue grows 16.0% and net margins reach 23.8% under stable multiples → 10.2% annualized return.
- High Case: If OpenAds adoption accelerates and operating leverage expands, revenue grows 17.6% and net margins approach 25.2% with firmer sentiment → 17.1% annualized return.
How Much Upside Does Trade Desk Stock Have From Here?
With TIKR’s new Valuation Model tool, you can estimate a stock’s potential share price in under a minute.
All it takes is three simple inputs:
- Revenue Growth
- Operating Margins
- Exit P/E multiple
If you’re not sure what to enter, TIKR automatically fills in each input using analysts’ consensus estimates, giving you a quick, reliable starting point.
From there, TIKR calculates the potential share price and total returns under Bull, Base, and Bear scenarios so you can quickly see whether a stock looks undervalued or overvalued.
Looking for New Opportunities?
- See what stocks billionaire investors are buying so you can follow the smart money.
- Analyze stocks in as little as 5 minutes with TIKR’s all-in-one, easy-to-use platform.
- The more rocks you overturn… the more opportunities you’ll uncover. Search 100K+ global stocks, global top investor holdings, and more with TIKR.
Disclaimer:
Please note that the articles on TIKR are not intended to serve as investment or financial advice from TIKR or our content team, nor are they recommendations to buy or sell any stocks. We create our content based on TIKR Terminal’s investment data and analysts’ estimates. Our analysis might not include recent company news or important updates. TIKR has no position in any stocks mentioned. Thank you for reading, and happy investing!