
Key Takeaways:
- CEO Transition Reset: Walt Disney Company set a March 2026 CEO handoff to Josh D’Amaro, with Bob Iger staying through December 31, tightening accountability around a 3 segment model spanning Entertainment, Sports, and Experiences.
- Balance Sheet Flexibility: Walt Disney filed for a 4 part notes offering on February 10 which is a funding move that supports high-capex park expansion and streaming product investment while rates and credit spreads remain key variables.
- Price Target Framework: Disney stock could reach $134 by 2028 as the model builds in 5% revenue growth, 20% operating margins, and a 16x exit P/E consistent with a more profitable streaming mix.
- Modeled Return Profile: Disney stock target implies 22% upside from the current $110 price, translating to about 8% annualized returns over roughly 3 years as earnings scale under a higher-margin cost structure.
The Walt Disney Company (DIS) owns film and TV franchises, runs ESPN sports distribution, and monetizes premium IP through theme parks and cruise experiences, supporting about $96 billion of LTM revenue across 3 segments.
Its scale matters because global studios, direct-to-consumer video, and destination experiences monetize the same characters across multiple touchpoints, and the business still attracts mass audiences at $6 billion box office levels in 2025.
Disney stock’s LTM gross profit reached about $36 billion on $60 billion of costs, and operating expenses of about $22 billion left operating income near $14 billion and an operating margin around 15%.
Company’s profitability also improved from $3 billion of operating income in 2021 to $14 billion in 2025 as gross margin expanded from about 33% to about 38%, signaling better mix and cost discipline during a multi-year reset.
On the first earnings call in 2026, Iger framed IP strength against peers by saying, “We have a great hand,” tying Disney’s 37 $1 billion films to downstream monetization in parks, streaming, and consumer products.
Management outlined new distribution levers including ESPN Unlimited, an NFL Network and RedZone acquisition, and an OpenAI Sora license covering 250 characters and 30 second videos over 3 years, aiming to lift engagement without replacing core content.
At roughly $110 per share versus a $134 2028 model target that assumes a 16x multiple and 20% operating margins, investors still debate whether the market prices durable IP cash flows or discounts execution risk in streaming and capex.
What the Model Says for DIS Stock
Disney’s capital intensive parks expansion and streaming investments anchor expectations around disciplined execution and margin recovery toward 19.6%.
The model’s expectations reflect 5.2% revenue growth, 19.6% operating margins, and a 15.7x exit multiple, yielding a $133.73 modeled target price.
From the current base, this equates to 21.6% total upside and a 7.7% annualized return, limited against broader equity benchmarks.
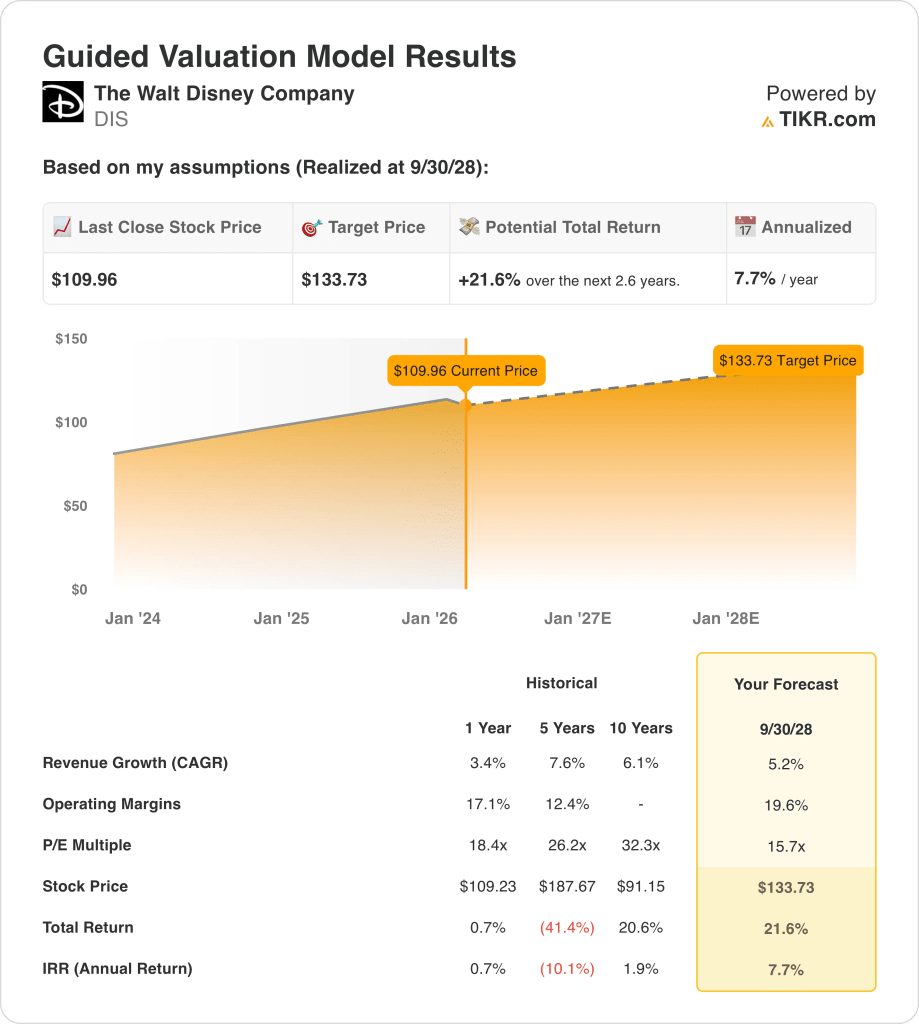
Therefore, the valuation model signals a Sell, as a 7.7% annualized return does not adequately compensate for business cyclicality and capital intensity.
At 7.7% annually versus a 10% equity hurdle, the modeled return profile favors capital preservation over appreciation, indicating risk-adjusted compensation remains insufficient and supporting a Sell under disciplined valuation standards.
Our Valuation Assumptions
TIKR’s Valuation Model lets you plug in your own assumptions for a company’s revenue growth, operating margins, and P/E multiple, and calculates the stock’s expected returns.
Here’s what we used for Disney stock:
1. Revenue Growth: 5.2%
Revenue expanded 3% in the past year and 8% over 5 years, while LTM sales reached $96 billion across parks, studios, and streaming distribution.
Current momentum includes $6 billion of 2025 box office, bookings up 5%, and Q1 revenue of $26 billion, which supports moderate top-line durability.
Sustaining 5.2% requires consistent park attendance, advertising stability, and franchise execution, while cyclical demand or content misfires compress revenue quickly given fixed-cost exposure.
This is above the 1-year revenue growth of 3%, because experiences pricing and streaming monetization must offset mature linear declines, and valuation weakens quickly if revenue reverts toward recent levels.
2. Operating Margins: 19.6%
Operating margins improved from 5% in 2021 to 15% LTM as gross margin rose from 33% to 38% and operating income reached $14 billion.
Streaming moved from a $4 billion annual loss to double-digit margin guidance, while parks surpassed $10 billion quarterly revenue, strengthening fixed-cost absorption.
Achieving 19.6% depends on disciplined content spend, stable park volumes, and NFL integration, while margin slippage reintroduces earnings volatility given high capital intensity.
This is above the 1-year operating margin of 17%, because streaming profitability and pricing leverage must persist, and even modest cost creep pressures equity valuation under a fixed multiple.
3. Exit P/E Multiple: 15.7x
The model applies a 15.7× exit multiple to Disney stock to capitalize normalized earnings within a mature media and experiences portfolio that carries moderate growth prospects and cyclical exposure.
The market assumption for NTM P/E is 15.74×, and this places the exit multiple at current pricing because the model does not assume re-rating expansion.
The multiple assumes earnings durability at 19.6% margins and 5.2% growth, while disappointment in streaming scale or park returns leads to compression rather than expansion.
This is below the 1-year historical P/E of 18×, because margin gains already sit in earnings expectations and valuation remains capped by capital intensity and execution risk.
Build your own Valuation Model to value any stock (It’s free!) >>>
What Happens If Things Go Better or Worse?
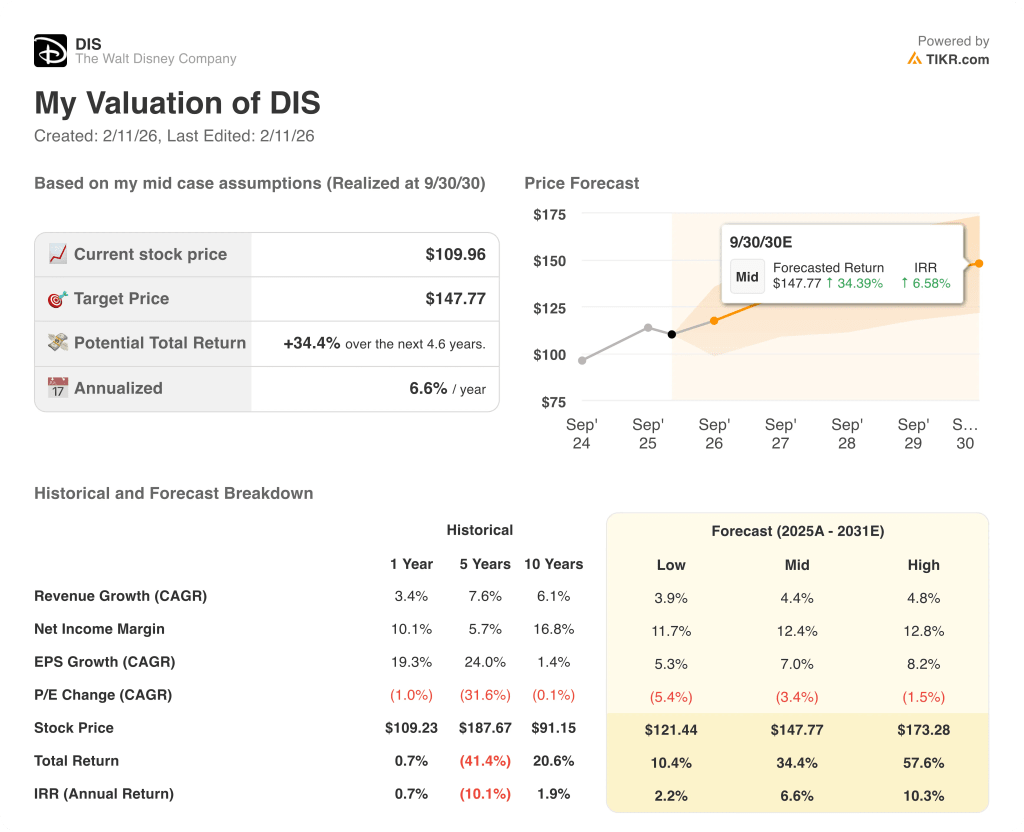
Disney stock valuation through 2030 reflects streaming margin recovery, park capacity expansion, and franchise monetization across film and consumer ecosystems.
- Low Case: If park demand softens and streaming leverage stalls, revenue grows 3.9% and net margins reach 11.7% → 2.2% annualized return.
- Mid Case: With parks scaling, streaming profitable, and franchises sustaining demand, revenue grows 4.4% and net margins reach 12.4% → 6.6% annualized return.
- High Case: If pricing holds, costs stay disciplined, and IP cycles align globally, revenue reaches 4.8% and net margins approach 12.8% → 10.3% annualized return.
How Much Upside Does Disney Stock Have From Here?
With TIKR’s new Valuation Model tool, you can estimate a stock’s potential share price in under a minute.
All it takes is three simple inputs:
- Revenue Growth
- Operating Margins
- Exit P/E multiple
If you’re not sure what to enter, TIKR automatically fills in each input using analysts’ consensus estimates, giving you a quick, reliable starting point.
From there, TIKR calculates the potential share price and total returns under Bull, Base, and Bear scenarios so you can quickly see whether a stock looks undervalued or overvalued.
Looking for New Opportunities?
- See what stocks billionaire investors are buying so you can follow the smart money.
- Analyze stocks in as little as 5 minutes with TIKR’s all-in-one, easy-to-use platform.
- The more rocks you overturn… the more opportunities you’ll uncover. Search 100K+ global stocks, global top investor holdings, and more with TIKR.
Disclaimer:
Please note that the articles on TIKR are not intended to serve as investment or financial advice from TIKR or our content team, nor are they recommendations to buy or sell any stocks. We create our content based on TIKR Terminal’s investment data and analysts’ estimates. Our analysis might not include recent company news or important updates. TIKR has no position in any stocks mentioned. Thank you for reading, and happy investing!