
Key Takeaways:
- Earnings Momentum: CVS delivered Q4 adjusted EPS of $1 and adjusted operating income of $3 billion, and this beat supported management’s 2026 guidance floor of $7 as Aetna margins recover.
- Regulatory Pressure: CVS Health faced renewed antitrust scrutiny in January 2026, and this risk weighs on valuation as PBM oversight intensifies alongside $25 billion of branded drug price increases.
- Price Target: Based on 5% revenue growth and 4% operating margins with an 11x exit P/E, CVS stock could reach $97 by 2027 as earnings normalize from 2024 levels.
- Return Math: The $97 target implies 28% upside from CVS’s $76 price, and that equates to a 14% annualized return over about 2 years.
CVS Health Corporation (CVS) integrates insurance, pharmacy benefit management, and retail pharmacy services, addressing healthcare access and affordability for employers, governments, and consumers across the United States.
The company serves more than 26 million medical members and processes prescriptions at national scale, positioning CVS Health as a critical intermediary within the $392 billion domestic healthcare delivery system.
Financially, revenue expanded from $291 billion in 2021 to $392 billion on a trailing basis, while gross profit remained near $52 billion as gross margins compressed to 13%.
Operating expenses increased to $42 billion on a trailing basis, reducing operating income to $10 billion and compressing operating margins from 5% in 2021 to roughly 3%.
CVS Management described 2025 as a turning point year, with CEO David Joyner stating, “branded manufacturers have made more than 750 drug price increases, adding $25 billion of cost.”
Fourth quarter results included $105 billion of revenue and $3 billion of adjusted operating income, and management reaffirmed 2026 adjusted EPS guidance beginning at $7.
The investment tension centers on whether CVS Health’s earnings recovery justifies valuation normalization above an 11x multiple, as regulatory pressure continues to influence market perception.
What the Model Says for CVS Health Stock
The model assumes 4.7% revenue growth, 3.6% operating margins, and an 11.4x exit multiple, producing a $96.82 target price.
This valuation delivers 27.8% total upside and a 13.8% annualized return, offering moderate compensation for diversified healthcare equity risk.

Based on modeled returns exceeding equity hurdles, the model signals a Buy, favoring capital appreciation over preservation.
With a 13.8% annualized return exceeding a typical 10% equity hurdle, the model supports capital appreciation rather than preservation, as the $96.82 target reflects adequate risk compensation, justifying a Buy.
Our Valuation Assumptions
TIKR’s Valuation Model lets you plug in your own assumptions for a company’s revenue growth, operating margins, and P/E multiple, and calculates the stock’s expected returns.
Here’s what we used for CVS Health stock:
1. Revenue Growth: 4.7%
CVS Health stock’s revenue history shows deceleration from a 10.3% ten-year CAGR to 4.2% over the last year as scale, payer mix, and regulatory exposure temper expansion.
Current execution supports 4.7% growth because Aetna margin recovery, pharmacy script share gains, and stabilized Medicare enrollment offset slower industry volume growth.
Forward progress requires sustained pricing discipline and medical cost control, while regulatory pressure or utilization shocks would pull consolidated growth below modeled levels.
This sits above the 1-year revenue growth of 4.2%, because diversified healthcare services provide incremental volume stability, and upside remains constrained by mature end markets.
2. Operating Margins: 3.6%
CVS Health stock historically operated with thin margins, with operating margins at 4.9% over the last year and 6.0% across five years due to insurance and pharmacy economics.
The 3.6% margin assumption reflects ongoing reinvestment, Medicare Advantage recovery costs, and pharmacy reimbursement pressure despite operational improvements across segments.
Margin durability depends on disciplined cost control and Aetna execution, while medical cost volatility or regulatory reimbursement changes would compress profitability quickly.
This is below the 1-year operating margin of 4.9%, because margin normalization already embeds recovery efforts, and further expansion requires sustained execution without adverse utilization trends.
3. Exit P/E Multiple: 11.4x
CVS Health’s valuation history centers near market-level multiples, with a 1-year P/E of 11.1x and a 10-year average of 10.7x reflecting mature cash flows.
The 11.4x exit multiple capitalizes normalized earnings without assuming re-rating, as margin recovery and growth normalization already sit within projected fundamentals.
Terminal valuation depends on earnings stability and cash flow visibility, while disappointment in margins or regulatory clarity would translate into multiple compression.
This is slightly above the 1-year P/E of 11.1x, because diversified earnings streams support modest normalization, and upside remains capped by healthcare policy risk.
What Happens If Things Go Better or Worse?
CVS Health stock depends on insurance margin recovery, pharmacy reimbursement stability, and disciplined execution across integrated healthcare services through 2029.
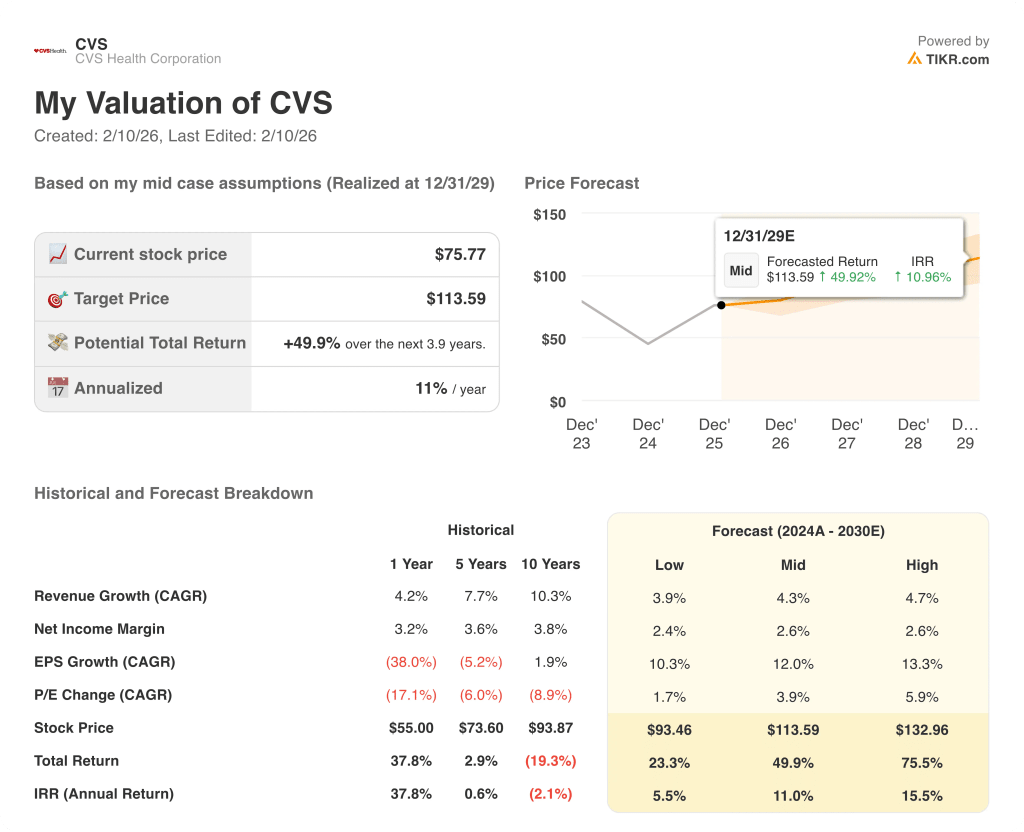
- Low Case: If Medicare pressure persists and retail reimbursement tightens, revenue grows 3.9% and net margins hold near 2.4% → 5.5% annualized return.
- Mid Case: With insurance normalization and pharmacy stability, revenue grows 4.3% and net margins improve toward 2.6% → 11.0% annualized return.
- High Case: If Aetna recovery and pharmacy scale gains materialize, revenue reaches 4.7% and net margins approach 2.6% → 15.5% annualized return.
How Much Upside Does CVS Health Stock Have From Here?
With TIKR’s new Valuation Model tool, you can estimate a stock’s potential share price in under a minute.
All it takes is three simple inputs:
- Revenue Growth
- Operating Margins
- Exit P/E multiple
If you’re not sure what to enter, TIKR automatically fills in each input using analysts’ consensus estimates, giving you a quick, reliable starting point.
From there, TIKR calculates the potential share price and total returns under Bull, Base, and Bear scenarios so you can quickly see whether a stock looks undervalued or overvalued.
Looking for New Opportunities?
- See what stocks billionaire investors are buying so you can follow the smart money.
- Analyze stocks in as little as 5 minutes with TIKR’s all-in-one, easy-to-use platform.
- The more rocks you overturn… the more opportunities you’ll uncover. Search 100K+ global stocks, global top investor holdings, and more with TIKR.
Disclaimer:
Please note that the articles on TIKR are not intended to serve as investment or financial advice from TIKR or our content team, nor are they recommendations to buy or sell any stocks. We create our content based on TIKR Terminal’s investment data and analysts’ estimates. Our analysis might not include recent company news or important updates. TIKR has no position in any stocks mentioned. Thank you for reading, and happy investing!