Key Takeaways:
- Legal Overhang: BlackRock faces a shareholder derivative lawsuit filed on February 10, 2026 in Texas that names CEO Larry Fink and CFO Martin Small, introducing governance and headline risk alongside $14 trillion of client assets.
- Platform Buildout: BlackRock is hosting a U.S. Infrastructure Summit on March 11, 2026 with Global Infrastructure Partners, keeping infrastructure and private markets in focus as the firm scales $676 billion in alternatives.
- Price Path: BlackRock stock could reach $1,680 by December 2028 as the model assumes 13% revenue growth, 40% operating margins, and a 20x P/E that capitalizes steadier fee growth.
- Return Math: BlackRock’s $1,680 target implies 55% upside from the current $1,088 price, translating to a 16% annualized return over roughly 3 years.
Breaking Down the Case for BlackRock
BlackRock, Inc. (BLK) is entering 2026 under heightened legal scrutiny after a February 10 shareholder lawsuit alleged antitrust exposure tied to climate-related engagement.
The firm oversees more than $14 trillion in client assets across ETFs, active strategies, private markets, and Aladdin technology, anchoring revenue that reached $24 billion over the last twelve months with gross profit of $12 billion.
BlackRock stock’s operating expenses of approximately $3 billion supported operating income of $9 billion and a 36% operating margin.
Meanwhile, their organic base fee growth reached 9% for 2025 and accelerated to 12% in Q4, while iShares delivered $530 billion of organic asset growth and Aladdin posted 16% ACV expansion, highlighting diversified fee engines.
Private markets now total $676 billion in assets, and management continues to prioritize fundraising toward long-term revenue expansion while integrating GIP, HPS, and Preqin into a broader public-private platform strategy.
With CFO, Martin Small stating, “we feel really comfortable that we’re kind of clicking along at 6%, 7%,” signaling confidence in sustainable organic base fee growth even as the firm balances margin targets above 45%.
Shares trade at $1,088 while the valuation model points to $1,680 by 2028 based on 13% revenue growth and 40% operating margins, leaving investors to weigh structural fee durability against litigation risk embedded in a 20x multiple.
What the Model Says for BLK Stock
BlackRock combines 18.7% 1-year revenue growth with 37.1% operating margins, supporting elevated expectations given scale and 14 trillion in client assets.
The model assumes 13.2% revenue growth, 40.2% operating margins, and a 20.0x exit multiple, producing a $1,680.28 target price by 2028.
That implies 54.5% total upside from $1,088 and a 16.2% annualized return over 2.9 years, exceeding typical 10% equity hurdle rates.
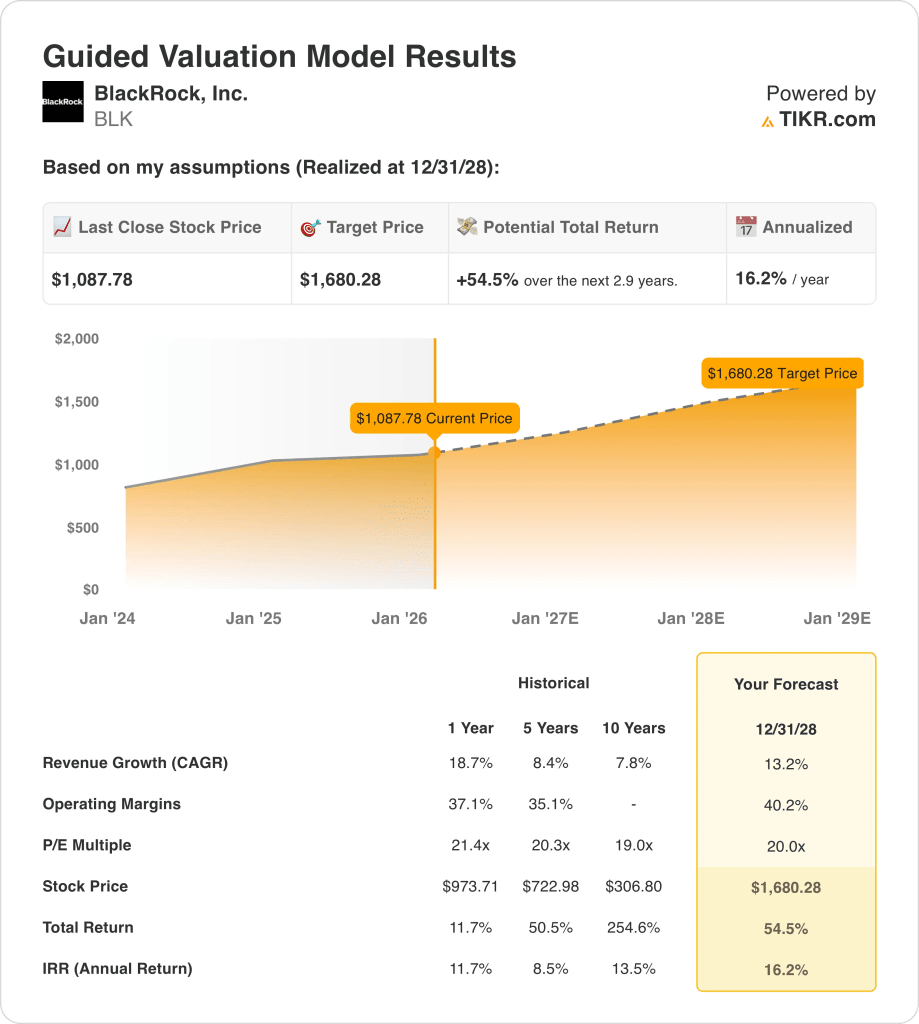
Therefore, model signals a Buy, as a 16.2% annualized return at a 20.0x multiple compensates for legal and cyclical risk embedded in BlackRock’s valuation.
A 16.2% annualized return exceeds a 10% equity hurdle rate and reflects sustained base fee growth near 6% to 7%, $530 billion of iShares organic asset growth, and integration of $676 billion in private markets capitalized at 20.0x.
Our Valuation Assumptions
TIKR’s Valuation Model lets you plug in your own assumptions for a company’s revenue growth, operating margins, and P/E multiple, and calculates the stock’s expected returns.
Here’s what we used for BlackRock stock:
1. Revenue Growth: 13.2%
BlackRock stocs delivered 18.7% revenue growth over the last year and 8.4% over 5 years, supported by scale in ETFs, technology services, and private markets distribution across global institutional channels.
Recent flows into iShares, expansion in private markets, and technology revenue from Aladdin support a 13.2% growth assumption as fee-based assets compound on a larger capital base.
Sustaining 13.2% growth requires continued net inflows and stable markets, while fee compression, weaker equity markets, or slower private fundraising would quickly pressure top-line momentum.
This is below the 1-year historical revenue growth of 18.7%, because asset-based fees normalize as scale increases, and the model assumes moderated expansion consistent with a mature $10 trillion platform.
2. Operating Margins: 40.2%
BlackRock stock produced a 37.1% operating margin over the last year and 35.1% over 5 years, reflecting strong operating leverage across largely fixed-cost distribution and technology infrastructure.
BLK stock’s margin expansion to 40.2% assumes expense discipline, incremental scale from higher AUM, and contribution from higher-fee private markets and technology services.
Achieving 40.2% margins depends on revenue growth outpacing compensation and technology investments, while market drawdowns or flow reversals would compress margins quickly given operating leverage.
However, this is above the 1-year operating margin of 37.1%, because incremental AUM scales against fixed infrastructure costs, and the model assumes improved mix and cost control sustain higher profitability.
3. Exit P/E Multiple: 20x
A 20.0× exit multiple capitalizes terminal net income under uncertainty, treating earnings durability as the anchor rather than assuming structural multiple expansion beyond normalized levels.
The market assumption for 2026 Normalized Earnings is 19.98×, while the model uses 20.0× to reflect normalized valuation consistent with a scaled, fee-based asset manager.
The model already embeds 13.2% revenue growth and 40.2% margins, so layering further multiple expansion would double-count optimism while exposing returns to valuation compression if execution slips.
This is below the 1-year historical P/E multiple of 21.4×, because earnings growth assumptions already capture operating leverage, and the model limits re-rating to guard against sentiment-driven volatility.
What Happens If Things Go Better or Worse?
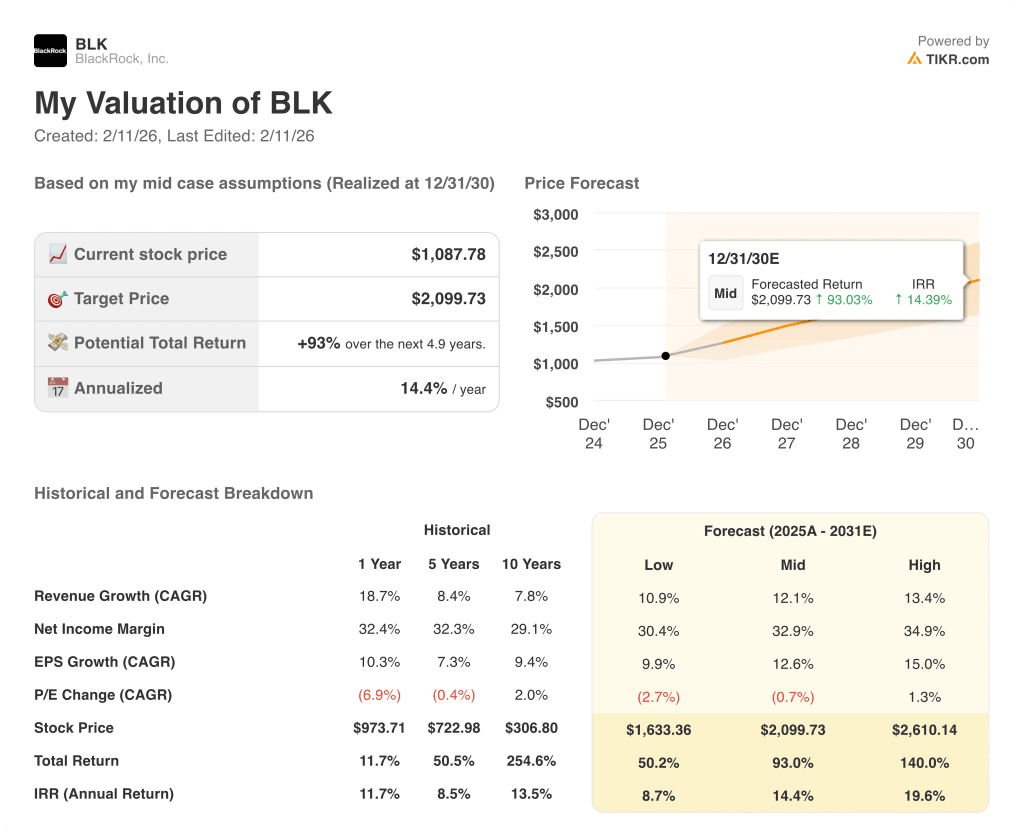
BlackRock stock hinges on asset flows, market levels, and fee discipline across ETFs and private markets through 2030.
- Low Case: If equity markets stall and fee pressure persists, revenue grows 10.9% and margins hold 30.4% → 8.7% annualized return.
- Mid Case: With steady inflows and cost discipline, revenue growth reaches 12.1% and margins improve toward 32.9% → 14.4% annualized return.
- High Case: If private markets scale and iShares gains share, revenue hits 13.4% and margins approach 34.9% → 19.6% annualized return.
How Much Upside Does BlackRock Stock Have From Here?
With TIKR’s new Valuation Model tool, you can estimate a stock’s potential share price in under a minute.
All it takes is three simple inputs:
- Revenue Growth
- Operating Margins
- Exit P/E multiple
If you’re not sure what to enter, TIKR automatically fills in each input using analysts’ consensus estimates, giving you a quick, reliable starting point.
From there, TIKR calculates the potential share price and total returns under Bull, Base, and Bear scenarios so you can quickly see whether a stock looks undervalued or overvalued.
Looking for New Opportunities?
- See what stocks billionaire investors are buying so you can follow the smart money.
- Analyze stocks in as little as 5 minutes with TIKR’s all-in-one, easy-to-use platform.
- The more rocks you overturn… the more opportunities you’ll uncover. Search 100K+ global stocks, global top investor holdings, and more with TIKR.
Disclaimer:
Please note that the articles on TIKR are not intended to serve as investment or financial advice from TIKR or our content team, nor are they recommendations to buy or sell any stocks. We create our content based on TIKR Terminal’s investment data and analysts’ estimates. Our analysis might not include recent company news or important updates. TIKR has no position in any stocks mentioned. Thank you for reading, and happy investing!