
Key Stats for SPGI Stock
- Price Change for SPGI stock: -9.71%
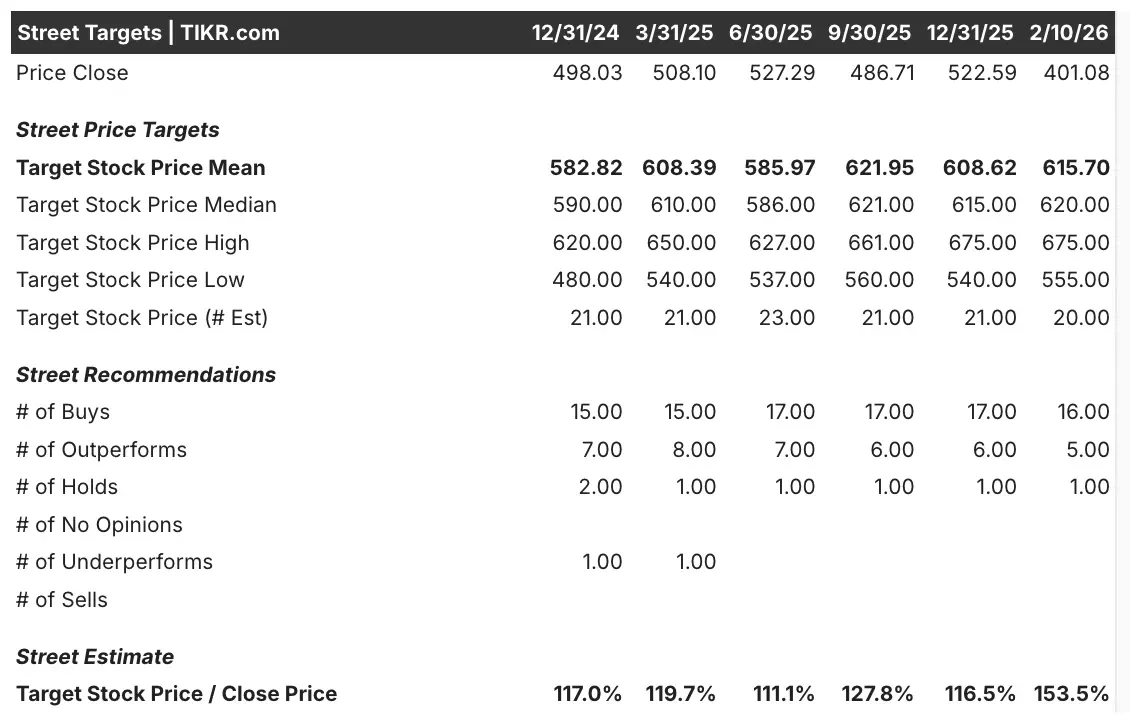
- SPGI Share Price as of Feb. 10: $403.14
- 52-Week High: $579.05
- SPGI Stock Price Target: $615.70
Now Live: Discover how much upside your favorite stocks could have using TIKR’s new Valuation Model (It’s free)>>>
What Happened?
S&P Global (SPGI) has been under pressure over the past year, and the stock sold off after its latest earnings update and 2026 outlook headlines.
In recent Reuters updates shown in TIKR, SPGI’s shares fell on a weak 2026 forecast and AI-related concerns. Separately, Reuters also flagged that SPGI forecast 2026 profit below estimates, which also pressured the stock.
SPGI’s latest quarterly results were mixed. Revenue slightly beat expectations, but cash flow and adjusted EPS missed. For SPGI’s most recent quarter (reported Feb. 10), revenue was $3,916 million versus $3,910 million expected.
However, adjusted EPS was $4.30 versus $4.34 expected, and free cash flow was $1,717 million versus $1,994 million expected.
SPGI also posted 2026 guidance ranges in TIKR. Revenue guidance for 2026 was $16,348 million to $16,655 million. Normalized EPS guidance for 2026 was $19.40 to $19.65.
See analysts’ growth forecasts and price targets for SPGI stock (It’s free!) >>>
What the Market Is Telling Us About SPGI Stock
The stock’s weakness suggests investors want cleaner execution on earnings quality and cash generation.
SPGI’s profitability remains strong, but growth and cash flow expectations matter most right now. Over the last twelve months, SPGI posted a 40.3% gross margin and a 40.3% EBIT margin.
SPGI also produced $15,336 million in LTM revenue, up 7.9% YoY. And it generated $4,471 million in LTM net income.
Still, the latest quarter showed pressure points. Adjusted EPS missed by 0.8%, and free cash flow missed by 13.9%. So, even with a slight revenue beat, investors focused on the weaker cash flow print.
On valuation, SPGI trades at about 20.2x next-twelve-month earnings and 16.3x NTM EV/EBITDA. The stock also offers a 1.0% dividend yield, and the payout ratio is 26.2%.
Estimate a company’s fair value instantly (Free with TIKR) >>>
How Much Upside Does SPGI Stock Have From Here?
With TIKR’s new Valuation Model tool, you can estimate a stock’s potential share price in under a minute.
All it takes is three simple inputs:
- Revenue Growth
- Operating Margins
- Exit P/E Multiple
If you’re not sure what to enter, TIKR automatically fills in each input using analysts’ consensus estimates, giving you a quick, reliable starting point.
From there, TIKR calculates the potential share price and total returns under Bull, Base, and Bear scenarios so you can quickly see whether a stock looks undervalued or overvalued.
See a stock’s true value in under 60 seconds (Free with TIKR) >>>
Looking for New Opportunities?
- See what stocks billionaire investors are buying so you can follow the smart money.
- Analyze stocks in as little as 5 minutes with TIKR’s all-in-one, easy-to-use platform.
- The more rocks you overturn… the more opportunities you’ll uncover. Search 100K+ global stocks, global top investor holdings, and more with TIKR.
Disclaimer:
Please note that the articles on TIKR are not intended to serve as investment or financial advice from TIKR or our content team, nor are they recommendations to buy or sell any stocks. We create our content based on TIKR Terminal’s investment data and analysts’ estimates. Our analysis might not include recent company news or important updates. TIKR has no position in any stocks mentioned. Thank you for reading, and happy investing!