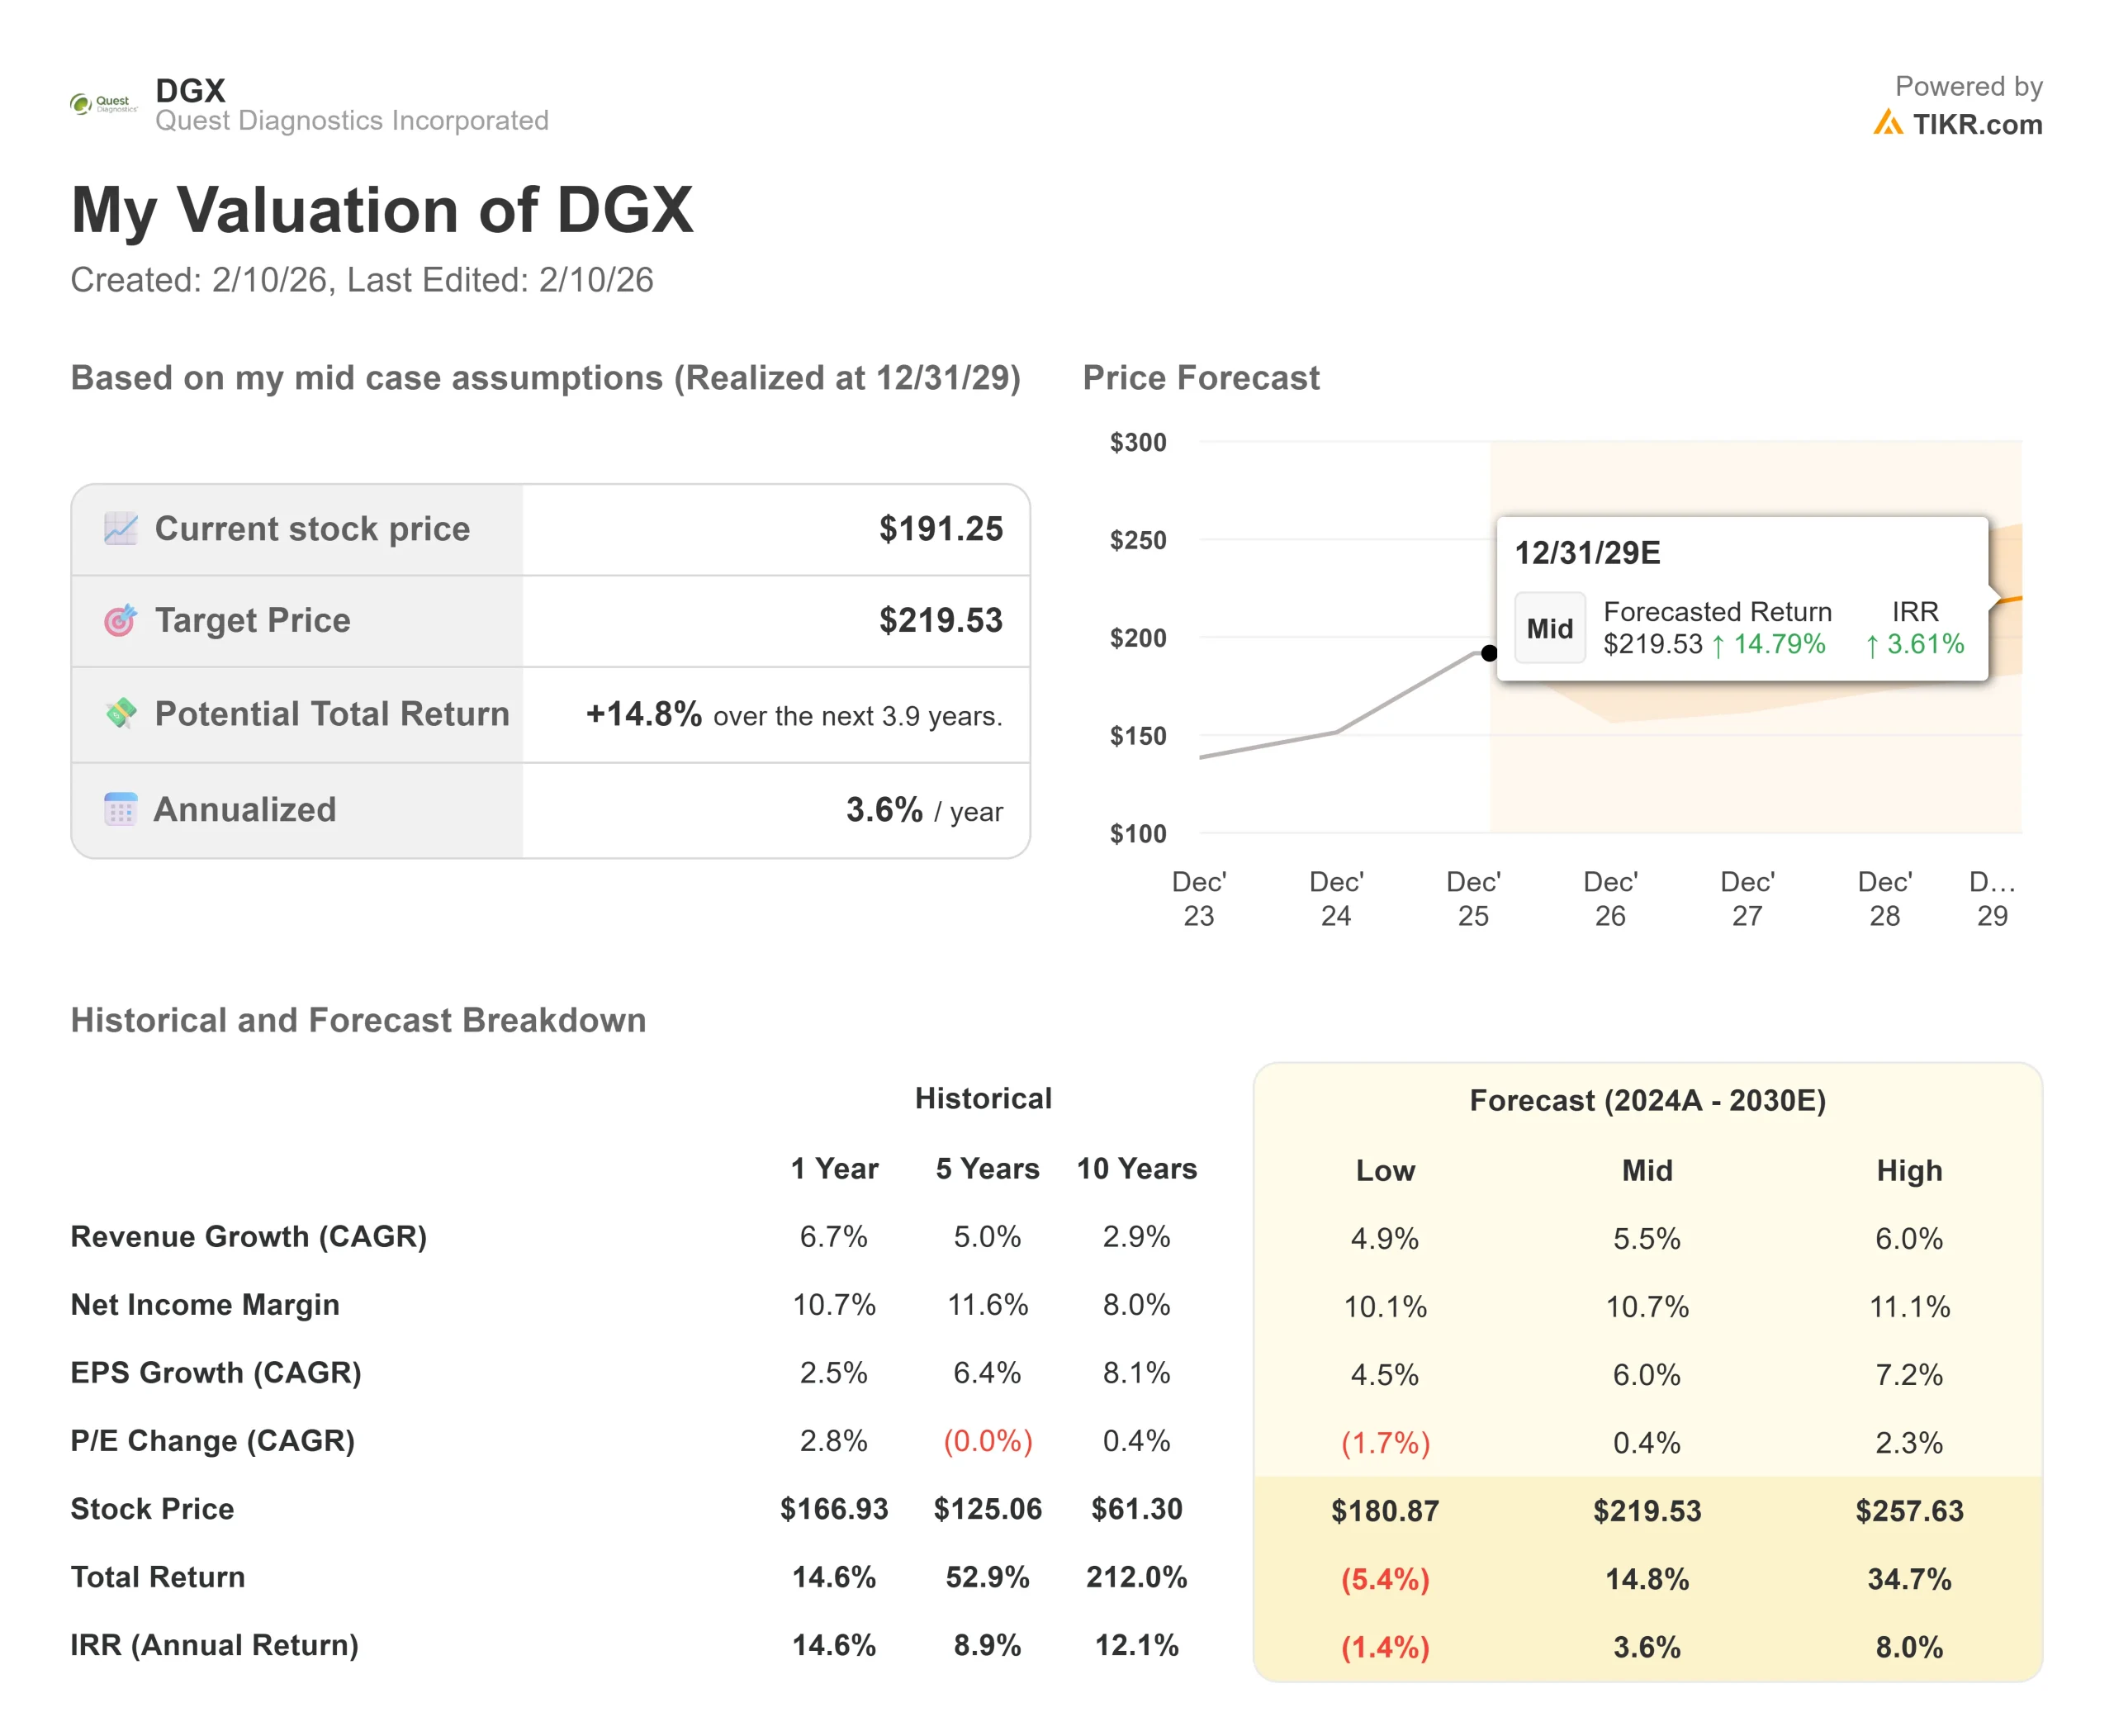
Key Stats for Quest Diagnostics Stock
- Price Change: +6.8%
- Current Price: ~$204
- TIKR Model Target: $220
Now Live: Discover how much upside your favorite stocks could have using TIKR’s new Valuation Model (It’s free)>>>
What Happened?
Quest Diagnostics (DGX) skyrocketed 6.8% to close near $204 on Tuesday.
Quest Diagnostics hit a new 52-week high as investors aggressively bought shares following a “beat and raise” earnings report.
The primary catalyst was the company’s bullish outlook for 2026.
With management guiding for full-year adjusted EPS of $9.45 to $9.65, this signals that demand for medical testing is accelerating faster than Wall Street anticipated.
Investors were particularly encouraged by the delay of PAMA rate cuts, which removes a significant overhang on the stock for the next year.
The sentiment was further boosted by strong growth in the company’s consumer-initiated testing business, which grew over 35% in 2025, proving that Quest is successfully pivoting beyond traditional physician referrals.
Analysts at Bank of America highlighted the company’s “robust” organic growth, driven by new partnerships with hospital systems and the rapid adoption of advanced diagnostics like Alzheimer’s blood tests.
With the company also announcing a $1 billion annual revenue target for its hospital lab management services, the market is now pricing in a sustained period of high-single-digit growth.
See analysts’ growth forecasts and price targets for Quest Diagnostics stock (It’s free!) >>>
Is Quest Diagnostics Undervalued Today?
During the earnings call, CEO Jim Davis laid out the drivers of the company’s momentum.
He stated: “We generated double-digit growth in revenues and earnings per share for the full year… leveraging our diagnostics expertise to drive growth through our consumer initiated test platform.”
CFO Sam Samad reinforced the financial strength, noting: “Revenues are expected to be between $11.7 billion and $11.82 billion… Cash from operations is expected to be approximately $1.75 billion.”
Samad also highlighted the operational improvements: “Operating margin is expected to expand versus the prior year.”
Read the full Quest Transcript on TIKR to see the 2026 Roadmap >>>
According to TIKR’s Advanced Valuation Model, the stock still has upside potential despite the recent rally.
- Target Price: $220
- Current Price: ~$204
- Potential Upside: +7.5%
Valuation Deep Dive
The investment case for Quest Diagnostics is a “growth acceleration” play.
With the stock trading at ~$204, the market is pricing in a steady state, but the $220 target implies that Quest’s new growth engines will drive multiple expansion.
- The Consumer Pivot: Quest’s direct-to-consumer business is growing at 35%, creating a high-margin revenue stream that is less dependent on insurance reimbursement.
- The Advanced Diagnostics Moat: Leadership in high-value testing areas like Alzheimer’s and Oncology provides a durable competitive advantage over smaller labs.
- The Value Gap: The $220 target reflects the premium valuation Quest deserves as it transforms from a commodity lab into a diversified healthcare technology company.
If Quest can hit the top end of its 2026 guidance, the path to $220 is paved by consistent execution and margin expansion.
Conclusion: Testing positive for growth. With further upside potential to $220, Quest Diagnostics offers a compelling mix of defensive stability and growth for investors looking to capitalize on the preventative health megatrend.
See what stocks billionaire investors are buying so you can follow the smart money with TIKR.
How Much Upside Does Quest Diagnostics Stock Have From Here?
With TIKR’s new Valuation Model tool, you can estimate a stock’s potential share price in under a minute.
All it takes is three simple inputs:
- Revenue Growth
- Operating Margins
- Exit P/E Multiple
If you’re not sure what to enter, TIKR automatically fills in each input using analysts’ consensus estimates, giving you a quick, reliable starting point.
From there, TIKR calculates the potential share price and total returns under Bull, Base, and Bear scenarios so you can quickly see whether a stock looks undervalued or overvalued.
See a stock’s true value in under 60 seconds (Free with TIKR) >>>
Looking for New Opportunities?
- See what stocks billionaire investors are buying so you can follow the smart money.
- Analyze stocks in as little as 5 minutes with TIKR’s all-in-one, easy-to-use platform.
- The more rocks you overturn… the more opportunities you’ll uncover. Search 100K+ global stocks, global top investor holdings, and more with TIKR.
Disclaimer:
Please note that the articles on TIKR are not intended to serve as investment or financial advice from TIKR or our content team, nor are they recommendations to buy or sell any stocks. We create our content based on TIKR Terminal’s investment data and analysts’ estimates. Our analysis might not include recent company news or important updates. TIKR has no position in any stocks mentioned. Thank you for reading, and happy investing!