
Key Stats for Novo Nordisk Stock
- Past 30 Days Performance: -17%
- 52-Week Range: $43 to $94
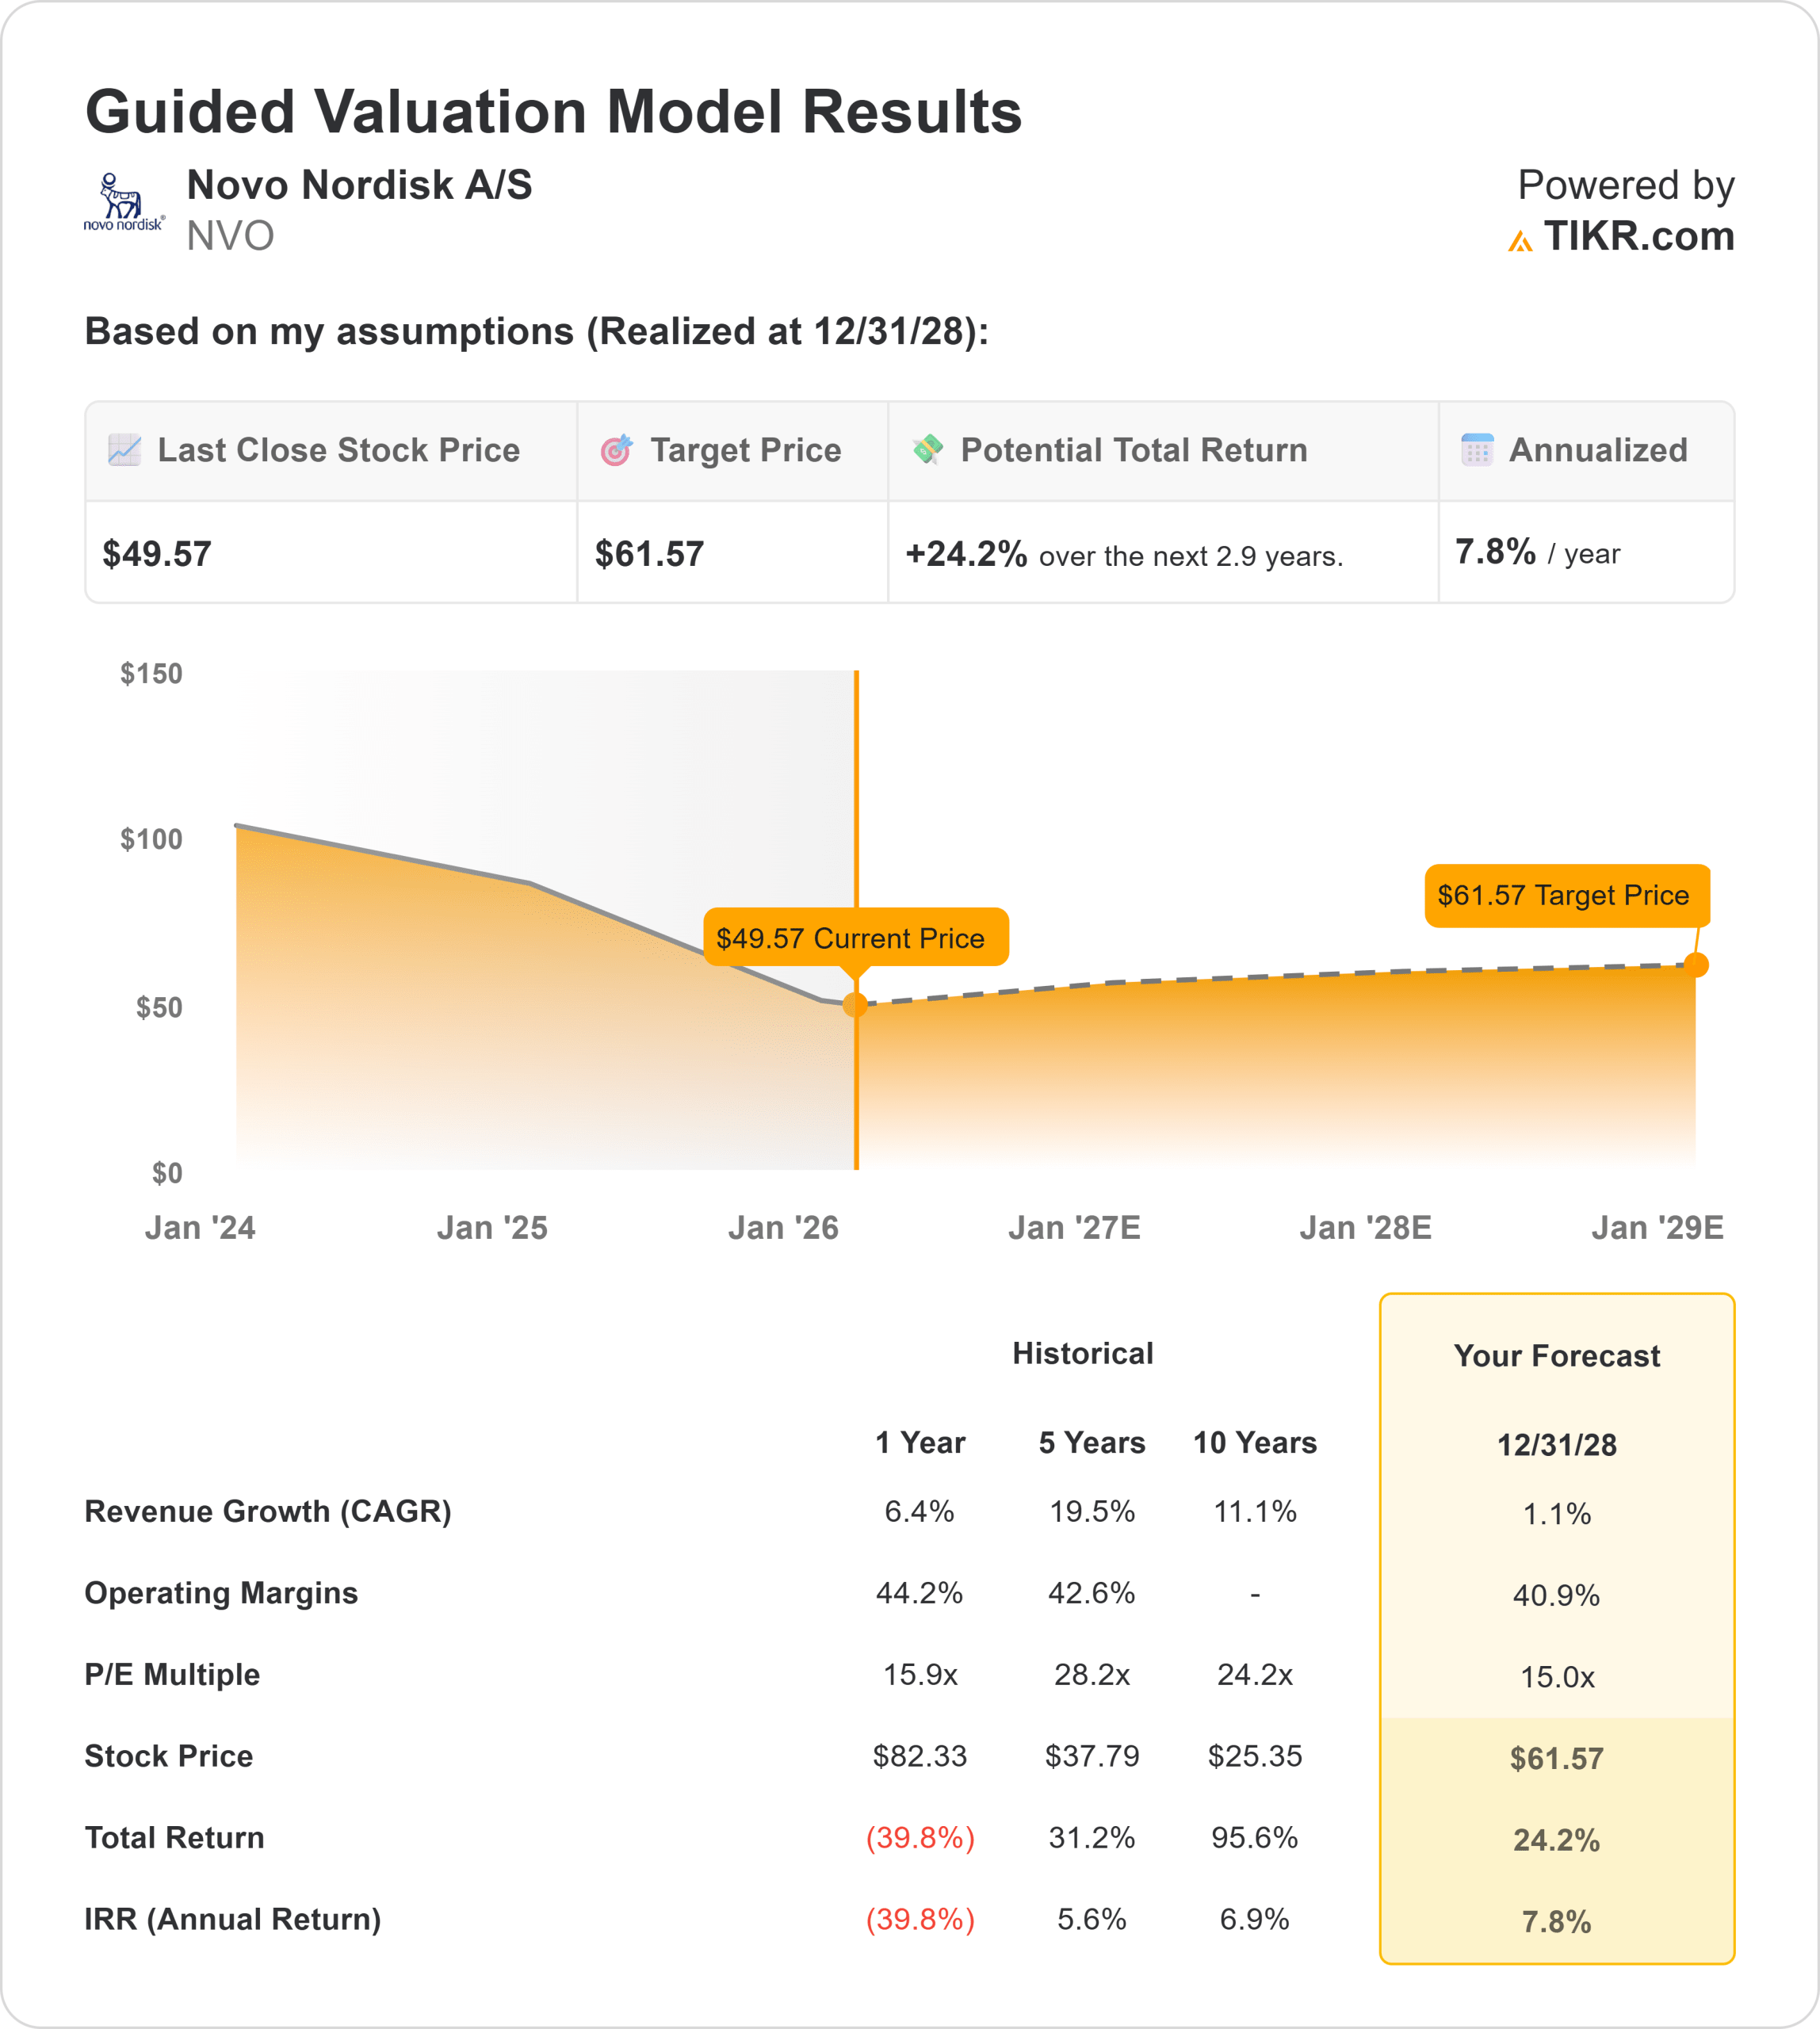
- Valuation Model Target Price: $62
- Implied Upside: 24%
Value your favorite stocks like Novo Nordisk with 5 years of analysts’ forecasts using TIKR’s new Valuation Model (It’s free) >>>
What Happened?
Novo Nordisk stock fell about 17% in the last 30 days, closing near $50 per share, as investors reacted to full-year results and weaker 2026 guidance.
While 2025 sales increased 10% and operating profit rose 6%, management projected 2026 adjusted sales and operating profit growth of -5% to -13% at constant exchange rates.
The stock declined primarily because management made clear that U.S. price reductions will drive a sales contraction in 2026 even if prescription volumes continue growing.
Executives emphasized that lower realized prices, Medicaid coverage reductions in certain states, and competitive pricing pressure will outweigh near-term volume gains. That forward shift from growth to pricing pressure drove the recent selloff.
This week’s earnings call still highlighted strong underlying momentum. Obesity care sales reached DKK 82 billion in 2025, and Wegovy sales climbed to DKK 28 billion, up 134%.
The newly launched Wegovy pill generated around 50,000 prescriptions for the week ending January 23, and CEO Maziar Doustdar said, “we have seen an incredible uptake.”
However, investors recalibrated expectations after management signaled that price declines, not demand weakness, will shape 2026 results.
Institutional positioning showed mixed reactions. Stratos Wealth Partners increased its stake by 199.7% to 36,527 shares, and Savvy Advisors boosted holdings by 83% to 48,824 shares.
Meanwhile, Thrivent Financial reduced its position by 53.7%, CIBC World Market cut exposure by 15.2%, and Wesbanco Bank trimmed its stake by 55.9%, reflecting portfolio adjustments after the guidance reset.
Overall, the 17% decline reflects valuation compression tied to lower 2026 growth expectations rather than deterioration in Novo Nordisk’s core obesity and diabetes franchise.
See analysts’ growth forecasts and price targets for Novo Nordisk (It’s free) >>>
Is Novo Nordisk Undervalued?
Under valuation assumptions, the stock is modeled using:
- Revenue Growth (CAGR): 1%
- Operating Margins: 41%
- Exit P/E Multiple: 15x
Revenue is expected to decline about 6% in 2026 before returning to mid-single-digit growth in subsequent years.
Estimates show revenue reaching 319,531 by 2028 and 372,753 by 2030, reflecting stabilization after pricing pressure.

Novo Nordisk continues to operate with elite profitability, including an LTM gross margin of 82% and LTM EBIT margin of 46%.
Because the company already operates at high margins, incremental volume growth from expanded manufacturing capacity and broader reimbursement access can drive meaningful operating leverage even in a lower pricing environment.
Several catalysts could support growth in the next 12 months. Continued uptake of the Wegovy pill, anticipated Medicare Part D coverage beginning mid-year, potential approval of high-dose semaglutide 7.2 mg, and regulatory progress on CagriSema all support expanding patient reach.
Based on these inputs, the valuation model estimates a target price of $62, implying about 24% total upside and roughly 8% annualized returns through 2026.
Because projected annualized returns exceed 6%, the stock qualifies as Undervalued under your framework.
At current levels, Novo Nordisk appears undervalued relative to its structural profitability and long-term GLP-1 opportunity, with future performance driven primarily by volume expansion and execution rather than multiple expansion alone.
Estimate a company’s fair value instantly (Free with TIKR) >>>
Value Any Stock in Under 60 Seconds (It’s Free)
With TIKR’s new Valuation Model tool, you can estimate a stock’s potential share price in under a minute.
All it takes is three simple inputs:
- Revenue Growth
- Operating Margins
- Exit P/E Multiple
From there, TIKR calculates the potential share price and total returns under Bull, Base, and Bear scenarios so you can quickly see whether a stock looks undervalued or overvalued.
If you’re not sure what to enter, TIKR automatically fills in each input using analysts’ consensus estimates, giving you a quick, reliable starting point.
See a stock’s true value in under 60 seconds (Free with TIKR) >>>