
Key Stats for SAP SE Stock
- Last 30-Day Performance: -13%
- 52-Week Range: $169 to $289
- Valuation Model Target Price: $334
- Implied Upside: 24%
Value your favorite stocks like SAP SE with 5 years of analysts’ forecasts using TIKR’s new Valuation Model (It’s free) >>>
What Happened?
SAP SE stock fell about 13% in the last 30 days, recently trading near $205 per share as investors rotated out of enterprise software names and compressed valuation multiples across large-cap SaaS stocks.
The stock declined specifically because current cloud backlog growth slowed to 25% to EUR 21 billion, which came in below investor expectations, even though total cloud backlog rose 30% to EUR 77 billion.
Markets focused on the deceleration in near-term backlog momentum rather than the record long-term pipeline, triggering multiple compression despite otherwise strong operating results.
In the last 30 days, SAP reported full-year cloud revenue growth of 26%, marking continued strength in its subscription transition.
Q4 was the company’s best bookings quarter of the year, with large cloud deals above EUR 5 million representing a record 71% of cloud order entry.
CEO Christian Klein said, “we overachieved and beat our outlook for operating profit and cash flow,” as non-IFRS operating profit reached EUR 10.4 billion and free cash flow totaled EUR 8.2 billion.
Management also guided for approximately EUR 10 billion in free cash flow in 2026 and announced a new EUR 10 billion share repurchase program.
The recent decline appears driven by sentiment and short-term backlog optics rather than weakening fundamentals or demand.
See analysts’ growth forecasts and price targets for SAP SE (It’s free) >>>
Is SAP SE Undervalued?
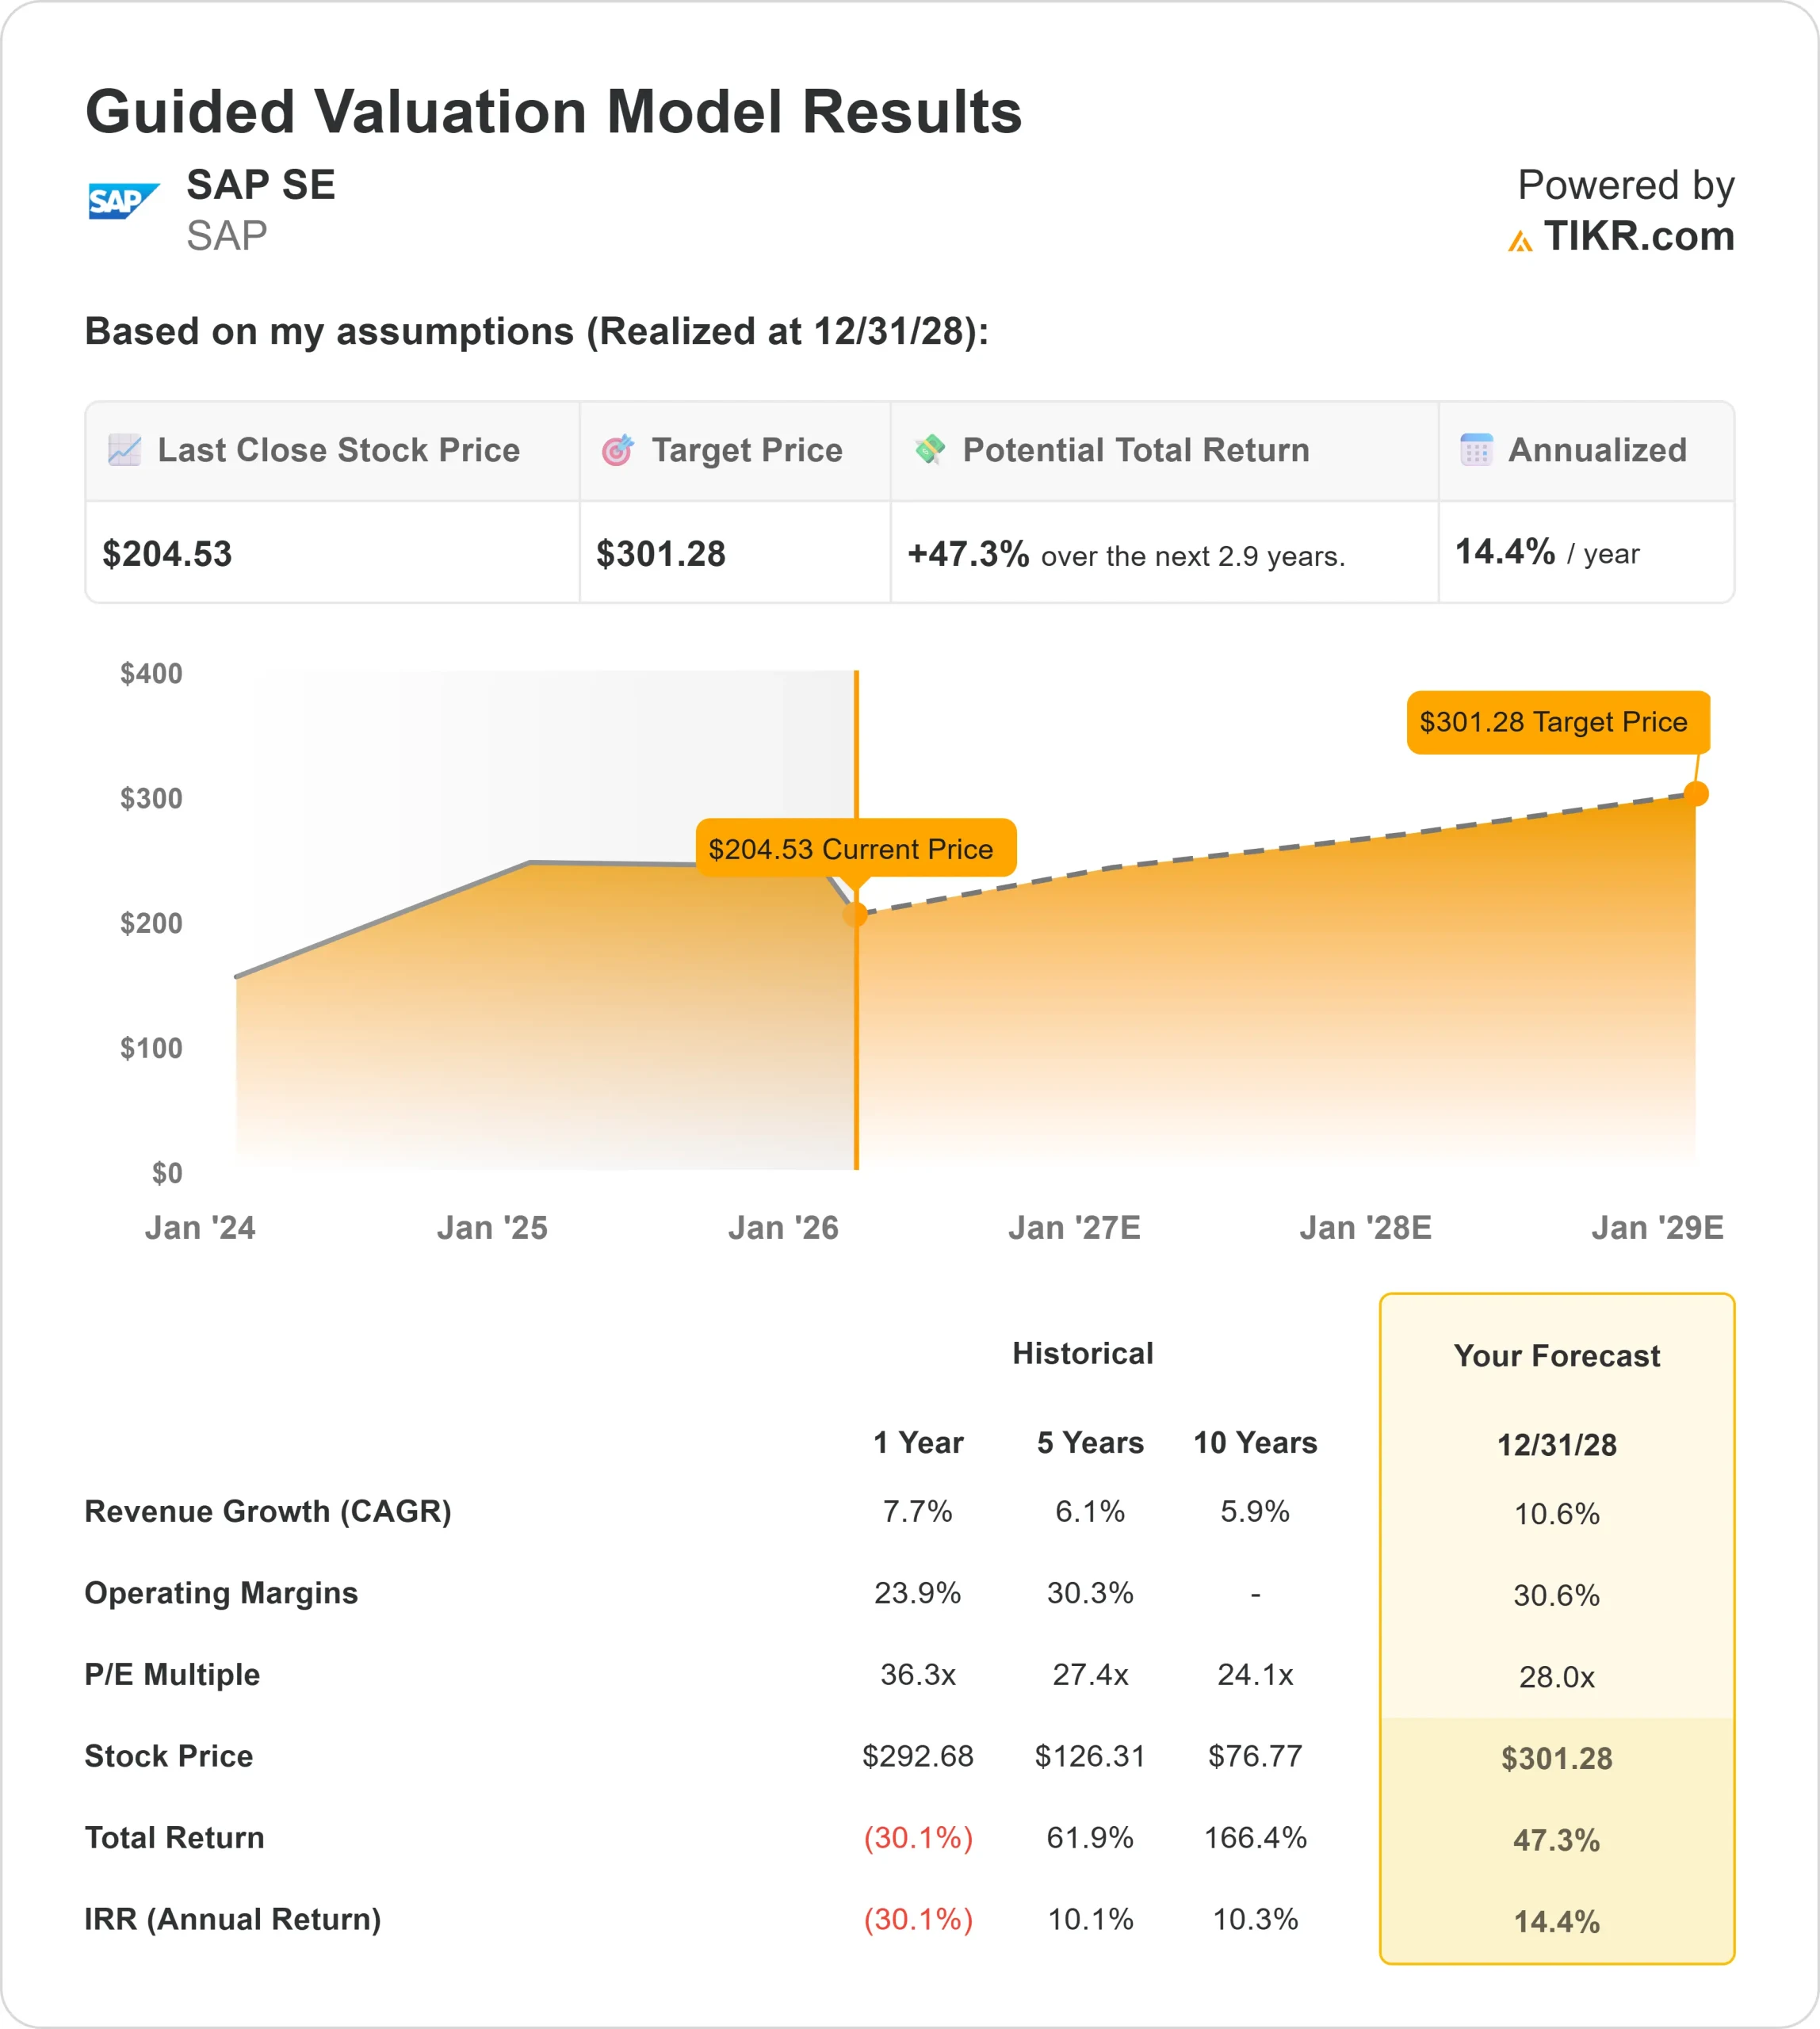
Under valuation assumptions, the stock is modeled using:
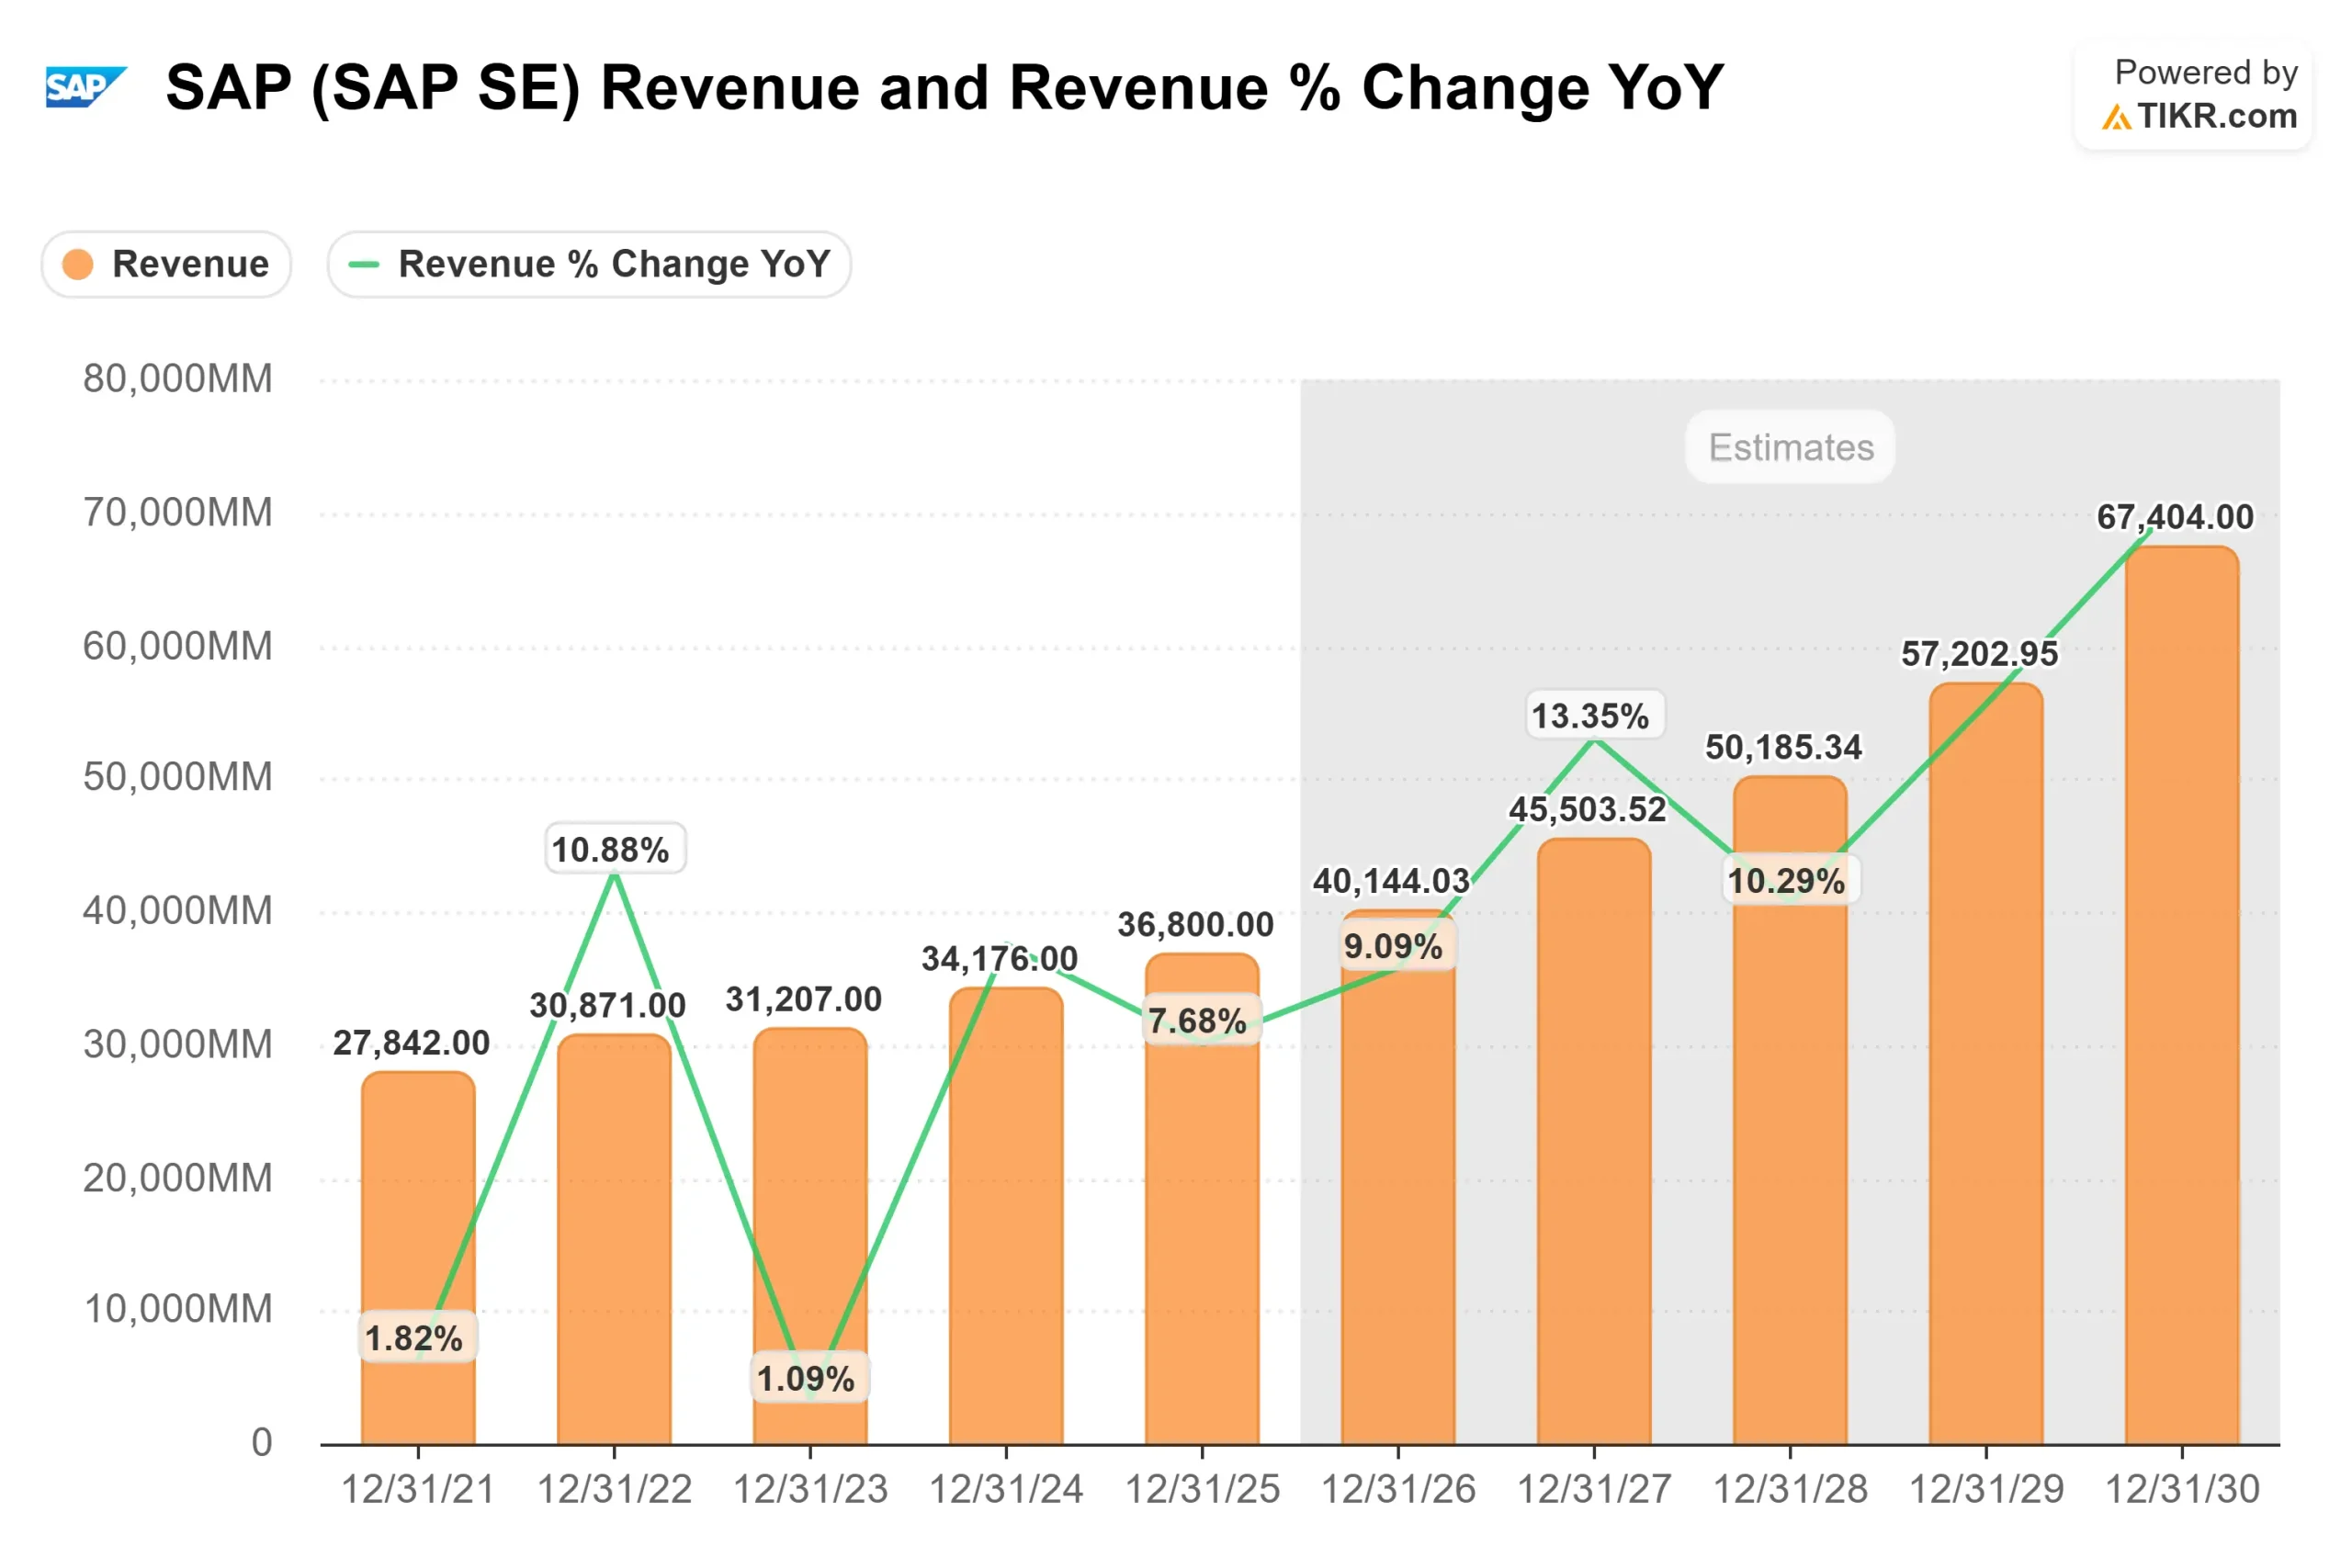
- Revenue Growth (CAGR): 10.6%
- Operating Margins: 30.6%
- Exit P/E Multiple: 28x
Revenue growth is increasingly supported by S/4HANA migrations and RISE with SAP adoption as enterprises modernize core ERP systems and move toward multi-year subscription contracts.
Cloud revenue grew 26% last year and total cloud backlog reached EUR 77 billion, providing strong multi-year visibility into recurring revenue streams.
This supports the view that future returns depend more on recurring cloud expansion, backlog conversion, and margin durability than on one-time license sales or aggressive top-line acceleration.
Margin expansion remains a central earnings lever. With cloud gross margins near 75% and non-IFRS operating profit at EUR 10.4 billion, incremental cloud revenue carries attractive contribution margins. Sustained operating margins above 30% would allow earnings to grow faster than revenue.
AI integration across supply chain, finance, HR, and industry workflows adds another structural tailwind.
Embedded AI agents increase stickiness, support pricing power, and raise average contract values without requiring dramatic customer growth. Business Data Cloud has generated over EUR 2 billion in order entry since launch, reinforcing SAP’s enterprise data advantage.
Capital allocation strengthens the case. SAP generated EUR 8.2 billion in free cash flow in 2025 and guided to approximately EUR 10 billion in 2026 while launching a EUR 10 billion share repurchase program.
Based on these inputs, the model estimates a target price of $301, implying about 47% total upside, indicating the stock appears undervalued at current prices.
At current levels near $205, SAP appears undervalued, with future performance driven by backlog conversion, operating leverage, AI monetization, and disciplined capital allocation rather than short-term sentiment shifts.
Estimate a company’s fair value instantly (Free with TIKR) >>>
Value Any Stock in Under 60 Seconds (It’s Free)
With TIKR’s new Valuation Model tool, you can estimate a stock’s potential share price in under a minute.
All it takes is three simple inputs:
- Revenue Growth
- Operating Margins
- Exit P/E Multiple
From there, TIKR calculates the potential share price and total returns under Bull, Base, and Bear scenarios so you can quickly see whether a stock looks undervalued or overvalued.
If you’re not sure what to enter, TIKR automatically fills in each input using analysts’ consensus estimates, giving you a quick, reliable starting point.
See a stock’s true value in under 60 seconds (Free with TIKR) >>>