
Key Stats for Cadence Stock
- 6-Month Performance: -14%
- 52-Week Range: $222 to $376
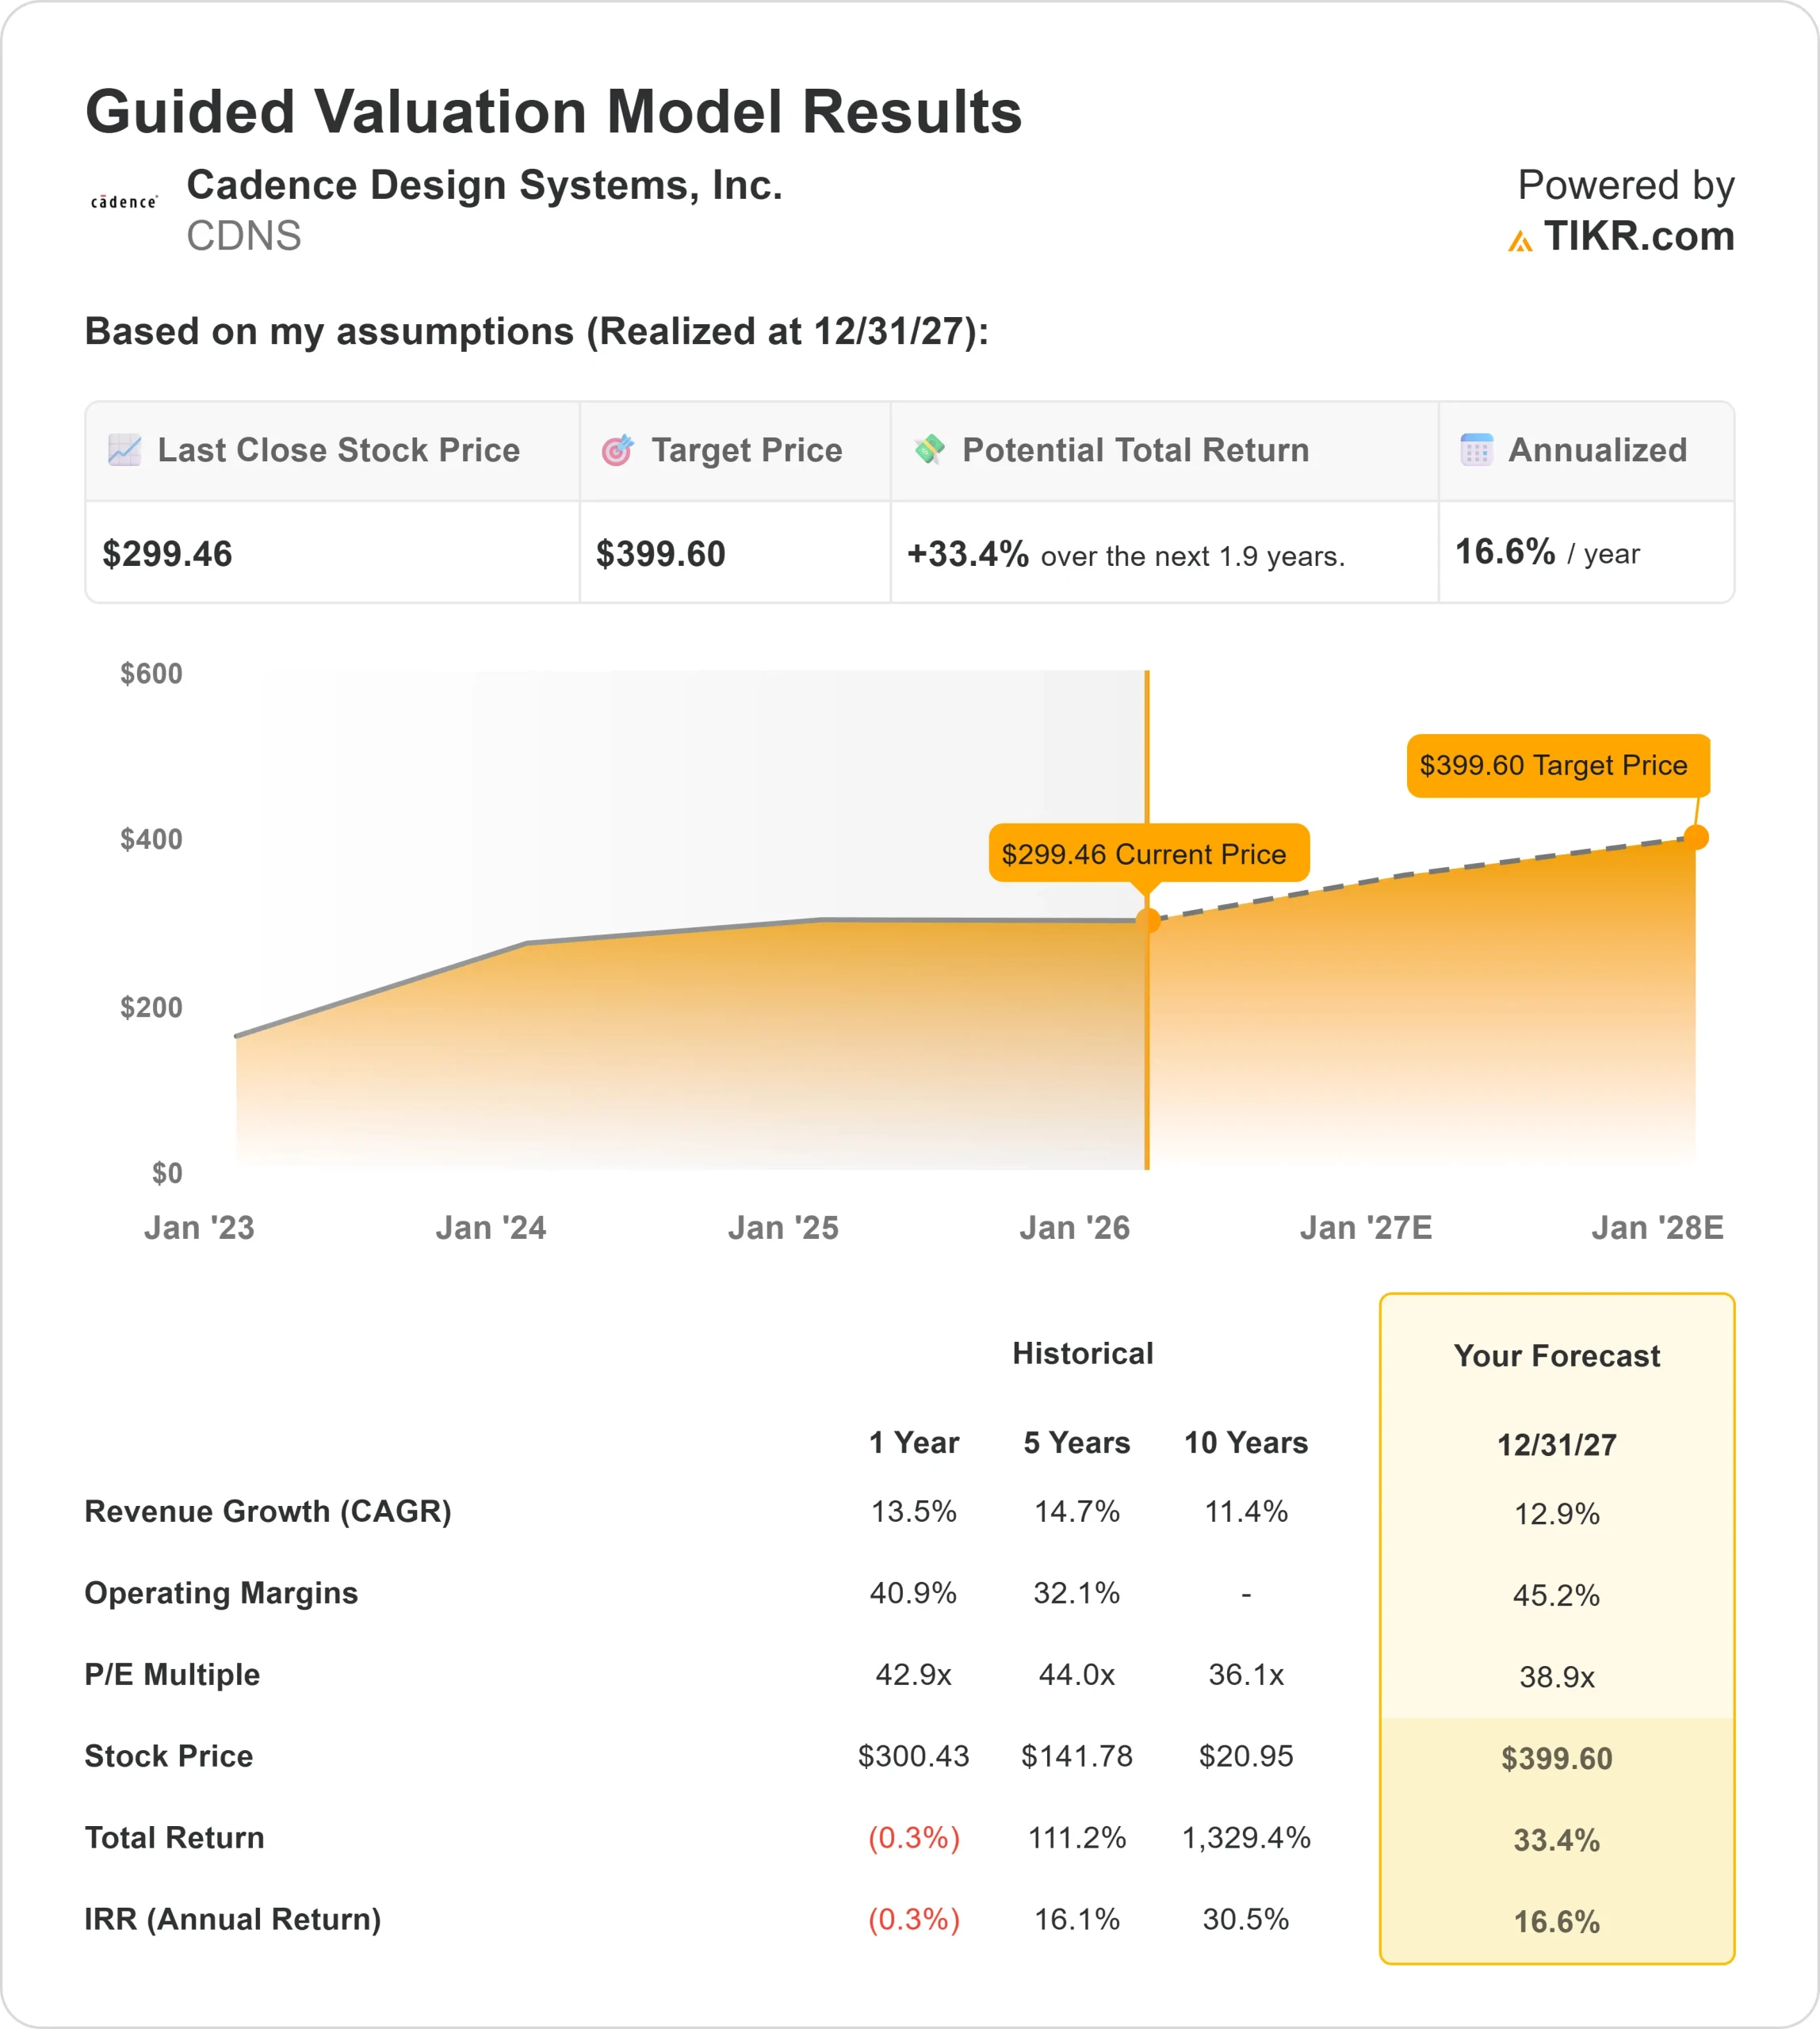
- Valuation Model Target Price: $400
- Implied Upside: 33%
Value your favorite stocks like Cadence Design Systems with 5 years of analysts’ forecasts using TIKR’s new Valuation Model (It’s free) >>>
What Happened?
Cadence Design Systems stock shares are down about 14% in the last six months, recently trading near $299 per share. The decline reflects valuation compression across high multiple semiconductor software stocks as investor enthusiasm around AI infrastructure spending cooled after a strong earlier rally.
The stock pulled back primarily because expectations had expanded faster than fundamentals, leading to multiple contraction even as revenue continued to grow.
Sentiment toward AI linked names became more selective, and premium valuation software companies like Cadence saw pressure despite no evidence of weakening demand trends.
Despite the share price weakness, Cadence introduced its new ChipStack AI Super Agent this month, describing it as the world’s first agentic workflow for front end silicon design and verification.
Management said the platform can deliver “up to 10X productivity improvements” across coding, testbench creation, regression testing, and debugging, with early deployments underway at Altera, NVIDIA, Qualcomm, and Tenstorrent.
Institutional positioning has been mixed. State of New Jersey Common Pension Fund D increased its stake by 4% to 95,422 shares valued at about $34 million, while PNC Financial Services boosted its holdings by 14% to 366,155 shares worth about $129 million.
However, ING Groep NV cut its stake by 97%, and Shell Asset Management reduced its position by 88%, reflecting selective trimming amid broader volatility.
See analysts’ growth forecasts and price targets for Cadence Design Systems (It’s free) >>>
Is Cadence Undervalued?
Under valuation assumptions, the stock is modeled using:
- Revenue Growth (CAGR): 13%
- Operating Margins: 45%
- Exit P/E Multiple: 39x
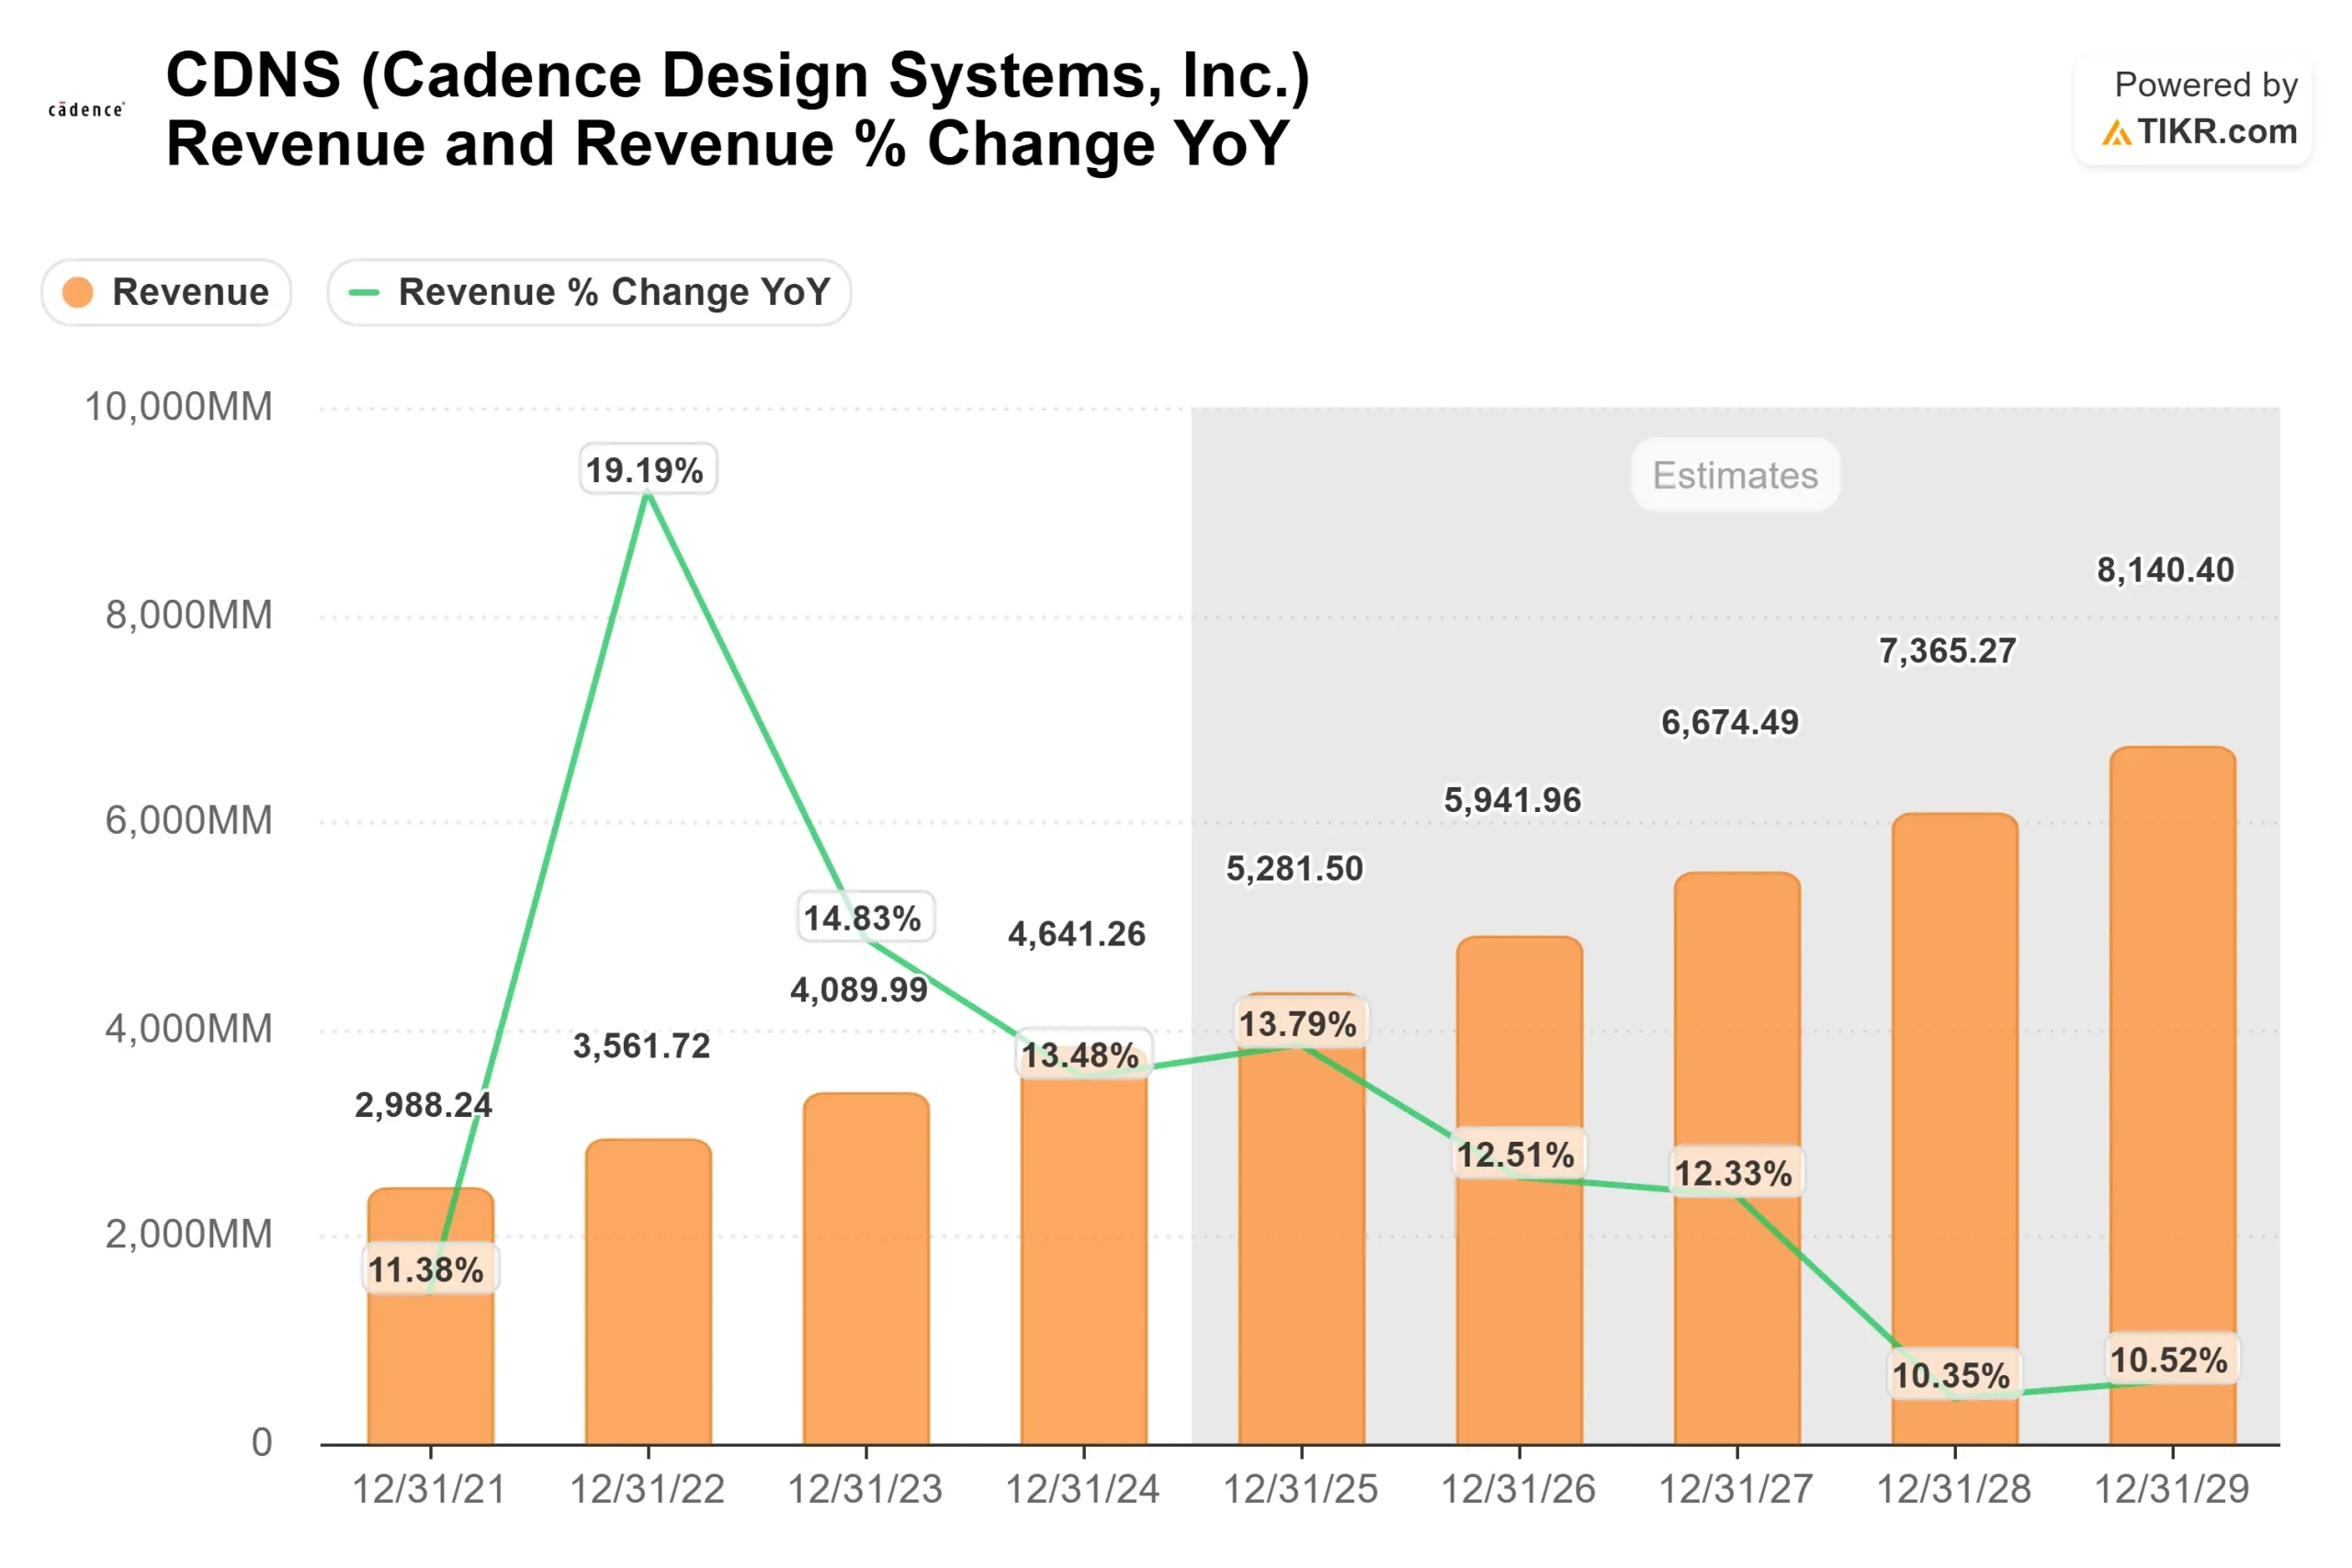
Revenue is projected to rise from about $4.6 billion in 2024 to more than $8.1 billion by 2029, reflecting sustained double digit expansion driven by rising semiconductor complexity.
AI accelerators, advanced process nodes, and chiplet architectures require more simulation and verification work per design, increasing Cadence’s revenue per project.
Operating leverage remains a central driver. With gross margins above 85%, incremental revenue carries high contribution margins, supporting operating margins modeled around 45% if execution remains strong.
Long term enterprise agreements and strong backlog visibility provide stability even if semiconductor unit demand fluctuates.
Expansion into automotive, aerospace, and high performance computing markets further broadens the opportunity set as electronic system complexity rises.
Based on these inputs, the model estimates a target price of about $400, implying roughly 33% total upside through 2026.
At current levels, Cadence appears undervalued relative to its projected earnings trajectory, with future performance tied to AI driven chip complexity and sustained margin expansion.
Estimate a company’s fair value instantly (Free with TIKR) >>>
Value Any Stock in Under 60 Seconds (It’s Free)
With TIKR’s new Valuation Model tool, you can estimate a stock’s potential share price in under a minute.
All it takes is three simple inputs:
- Revenue Growth
- Operating Margins
- Exit P/E Multiple
From there, TIKR calculates the potential share price and total returns under Bull, Base, and Bear scenarios so you can quickly see whether a stock looks undervalued or overvalued.
If you’re not sure what to enter, TIKR automatically fills in each input using analysts’ consensus estimates, giving you a quick, reliable starting point.
See a stock’s true value in under 60 seconds (Free with TIKR) >>>