Key Takeaways:
- Turnaround Reset: Match Group is executing a product-led reset across Tinder and Hinge, reporting Q4 revenue of $878 million up 2% and adjusted EBITDA of $370 million up 14%, while total payers declined 5% to 14 million as management prioritizes engagement quality over near-term volume.
- Capital Discipline: Match Group raised its quarterly dividend to $20 per share annualized at $80 and deployed 108% of free cash flow toward buybacks and dividends which reinforces balance sheet capacity with a payout ratio of 32% and institutional ownership of 94%.
- Price Projection: Based on 3% revenue growth, 29% operating margins, and an 8x exit multiple, Match Group could reach $39 by 2028 as earnings normalize and AI-driven product initiatives stabilize payer trends.
- Potential Gains: Match Group’s $39 target price implies 29% upside from the current $30 price, translating into a 9% annualized return over roughly 3 years if margins hold near 29% and EBITDA remains above $1 billion.
Breaking Down the Case for Match Group, Inc.
Match Group (MTCH) reported February 2026 results showing Q4 revenue of $878 million up 2% and net income of $210 million up 32%, while guiding 2026 revenue between $3 billion and $4 billion as management continues a multi-year product reset designed to restore sustainable engagement and stabilize monetization trends.
Full-year revenue reached $3 billion with gross profit of $2 billion reflecting gross margins above 70%, total operating expenses of roughly $2 billion, operating income near $900 million, and operating margins around 25%, illustrating durable profitability despite 5% payer declines across the portfolio.
Adjusted EBITDA totaled $370 million in Q4 with a 42% margin and $1 billion for the full year with a 35% margin, while revenue per payer increased 7% to $21 even as total payers fell to 14 million, signaling pricing resilience offsetting user contraction.
The strategic focus centers on rebuilding trust and improving match quality through AI verification tools and engagement features, and CEO Spencer Rascoff stated, “In 2026, we expect Tinder Y/Y direct revenue declines to be similar to 2025 as we continue to make product changes to improve user outcomes and drive long-term sustainable growth, but with short-term revenue trade-offs”.
Hinge delivered 26% direct revenue growth and a 17% increase in payers to nearly 2 million supported by geographic expansion into Latin America and planned investment in India, partially offsetting Tinder’s 8% payer decline and positioning the portfolio for mix-driven margin stabilization near 29%.
Capital allocation reinforced shareholder returns with a dividend increase to $20 per quarter annualized at $80 and 108% of free cash flow deployed to buybacks and dividends, while institutional ownership of 94% and a forward P/E near 12x underscore the market’s view that earnings stability rather than growth acceleration defines the current investment case.
At $30 per share against a modeled value of $39 by 2028 and guidance implying roughly flat revenue around $3 billion for 2026, investors must weigh whether a 9% annualized return adequately compensates for declining payer counts and strategic reinvestment trade-offs embedded in the reset narrative.
What the Model Says for MTCH Stock
Match Group faces slowing payer trends with 5% declines and revenue growth decelerating to 0.2% recently, while EBITDA margins remain near 36% and EBIT margins near 25%, reflecting stable profitability but limited organic expansion.
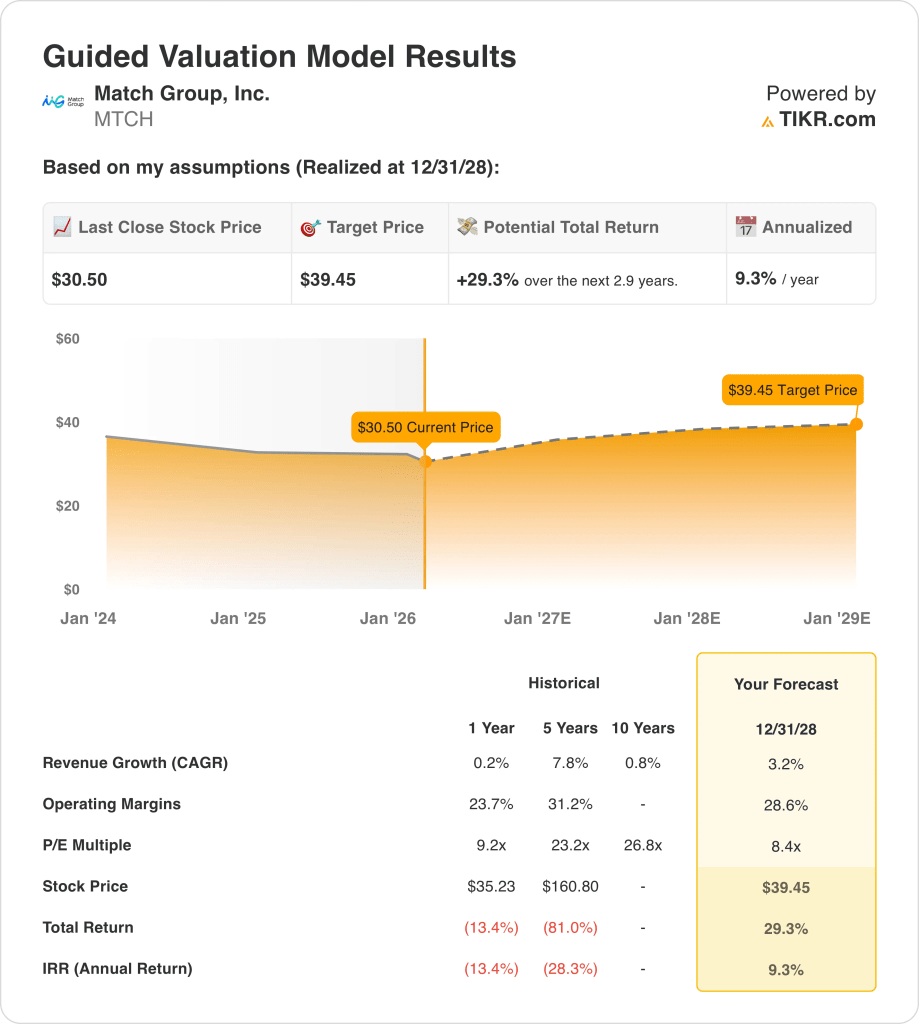
The model uses market assumption revenue growth of 3.2%, market assumption operating margins of 28.6%, and a market assumption exit multiple of 8x, producing a target price of $39.45 by 2028, even as forward P/E sits near 8x and forward EV to EBITDA trends between 8x and 9x.
This target price represents total upside of 29.3% from $30.50 and an annualized return of 9.3%, despite normalized EPS growth expected around 11% and free cash flow yields above 12%, which remain solid but not accelerating.
The model signals Sell because a 9.3% annualized return under these market assumptions, combined with flat 2026 revenue guidance near $3 billion and declining payer counts, does not justify equity risk relative to a 10% hurdle rate.
The modeled 9.3% annualized return remains below a 10% equity hurdle rate, indicating limited capital appreciation and emphasizing capital preservation rather than meaningful upside based strictly on current market assumption inputs and steady but modest earnings growth.
Our Valuation Assumptions
TIKR’s Valuation Model lets you plug in your own assumptions for a company’s revenue growth, operating margins, and P/E multiple, and calculates the stock’s expected returns.
Here’s what we used for Match Group stock:
1. Revenue Growth: 3.2%
Match Group stock revenue expanded 25% in 2021, slowed to 7% in 2022, 6% in 2023, 3% in 2024, and 0.2% in 2025, showing clear deceleration into maturity.
Current execution shows payer declines of 5% while revenue per payer rose 7%, keeping total revenue near $3 billion and limiting organic acceleration despite Hinge growth of 26%.
Sustaining 3.2% growth requires payer stabilization and continued pricing discipline, while flat 2026 guidance near $3 billion shows that any user softness quickly caps topline expansion.
This sits above the 1-year historical growth of 0.2%, as pricing offsets user contraction temporarily, and valuation depends on stabilization rather than renewed scale expansion.
2. Operating Margins: 28.6%
Match Group stock delivered EBIT margins of 29% in 2021, fell to 16% in 2022, recovered to 27% in 2023, then settled near 25% in 2025, showing volatility around cost resets.
Adjusted EBITDA margins held near 36% recently, while operating income remained near $900 million on $3 billion revenue, suggesting cost discipline supports high-20% operating margins.
Maintaining 28.6% requires stable marketing efficiency and limited reinvestment into Tinder product changes, while payer declines and AI spending create downside pressure if engagement stalls.
This stands above the 1-year operating margin of 23.7%, as recent cost controls normalize earnings, and further expansion depends on sustained fixed-cost leverage without volume contraction.
3. Exit P/E Multiple: 8.4x
Match Group stock trades near 8x to 10x forward earnings today, with NTM Price to Normalized Earnings around 8x to 9x, showing the market already prices moderate durability.
The 8x exit multiple capitalizes normalized earnings near $3 per share while assuming 3.2% revenue growth and 28.6% margins, avoiding reliance on multiple expansion for returns.
At 8x, valuation assumes earnings stability rather than growth acceleration, while disappointment in payer trends would compress multiples toward lower free cash flow yield expectations near 12%.
This is below the NTM Price to Normalized Earnings market assumption of 8.4x, as limited revenue growth and payer contraction constrain re-rating potential and anchor valuation to steady cash generation.
What Happens If Things Go Better or Worse?
Match Group stock results through 2030 center on payer stabilization, pricing discipline, and margin control across Tinder and Hinge.
- Low Case: If payer erosion persists and product changes slow engagement, revenue grows 3.7% and net margins hold near 23.5% → 3.7% annualized return.
- Mid Case: With pricing steady and Hinge expansion offsetting Tinder pressure, revenue grows 4.2% and net margins reach 25.2% → 8.3% annualized return.
- High Case: If payer trends stabilize and monetization improves across regions, revenue grows 4.6% and net margins approach 26.7% → 12.4% annualized return.

How Much Upside Does Match Group Stock Have From Here?
With TIKR’s new Valuation Model tool, you can estimate a stock’s potential share price in under a minute.
All it takes is three simple inputs:
- Revenue Growth
- Operating Margins
- Exit P/E multiple
If you’re not sure what to enter, TIKR automatically fills in each input using analysts’ consensus estimates, giving you a quick, reliable starting point.
From there, TIKR calculates the potential share price and total returns under Bull, Base, and Bear scenarios so you can quickly see whether a stock looks undervalued or overvalued.
Looking for New Opportunities?
- See what stocks billionaire investors are buying so you can follow the smart money.
- Analyze stocks in as little as 5 minutes with TIKR’s all-in-one, easy-to-use platform.
- The more rocks you overturn… the more opportunities you’ll uncover. Search 100K+ global stocks, global top investor holdings, and more with TIKR.
Disclaimer:
Please note that the articles on TIKR are not intended to serve as investment or financial advice from TIKR or our content team, nor are they recommendations to buy or sell any stocks. We create our content based on TIKR Terminal’s investment data and analysts’ estimates. Our analysis might not include recent company news or important updates. TIKR has no position in any stocks mentioned. Thank you for reading, and happy investing!