
Key Stats for CGNX Stock
- Price change for CGNX stock: +36.4%
- CGNX Share Price as of February 13: $58.83
- 52-Week High: $59.88
- CGNX Stock Price Target: $48.05
Now Live: Discover how much upside your favorite stocks could have using TIKR’s new Valuation Model (It’s free)>>>
What Happened?
Cognex Corporation (CGNX) shares moved sharply higher in 2026 after the company delivered a fourth-quarter earnings report that exceeded Wall Street expectations, with profitability improving meaningfully despite continued variability in end-market demand.
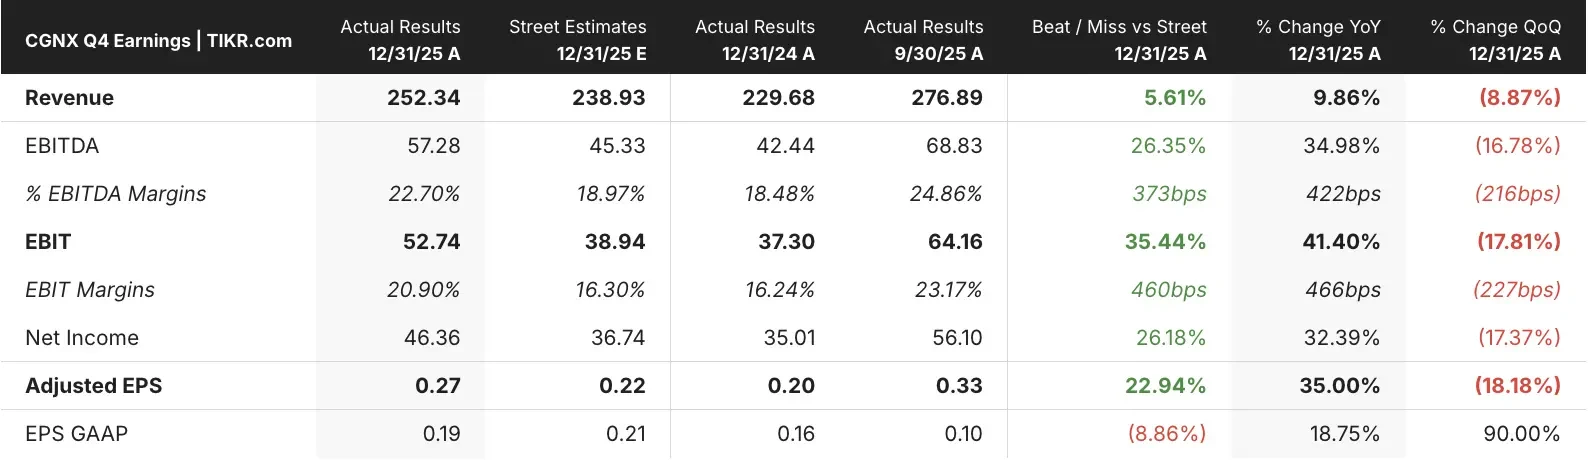
Revenue for the quarter totaled $252.3 million, which came in ahead of analyst estimates of $238.9 million and marked an increase from $229.7 million reported in the same quarter last year, reflecting modest year-over-year growth.
While revenue declined sequentially compared to the prior quarter, the earnings report showed that profitability improved at a faster pace, which appeared to be the primary driver behind the stock’s positive reaction.
See analysts’ growth forecasts and price targets for PM stock (It’s free!) >>>
EBITDA reached $57.3 million, substantially above the $45.3 million analysts had forecast, as operating discipline and cost controls contributed to stronger-than-expected earnings leverage.
As a result, EBITDA margins expanded to 22.7%, well ahead of the 19.0% consensus estimate and up meaningfully from the prior-year period.
Operating income also exceeded expectations by a wide margin, with EBIT totaling $52.7 million, representing a 35%+ beat versus estimates, while EBIT margins expanded by 460 basis points year over year.
Adjusted earnings per share came in at $0.27, surpassing the $0.22 estimate and improving from $0.20 in the prior-year quarter, further reinforcing the company’s margin recovery narrative.
What the Market Is Telling Us About CGNX Stock
The strong rally in CGNX shares, which are now up 36% in 2026, suggests that investors are increasingly focused on the company’s improving profitability profile rather than near-term revenue volatility across its industrial and electronics end markets.
Although sequential revenue softness points to ongoing demand uncertainty, the sharp improvement in margins indicates that management’s efficiency initiatives are having a tangible impact on earnings power.
However, despite the stock trading near its 52-week high of $59.88, analyst price targets remain meaningfully below current levels, highlighting a disconnect between recent market enthusiasm and longer-term valuation expectations.
This divergence suggests that while investors are rewarding near-term execution, analysts remain cautious about the sustainability of growth and multiple expansion over the coming years.
The current analyst consensus points to a $48.05 price target, which sits below today’s share price and implies downside from current levels.
This valuation reflects more conservative assumptions around future revenue growth, margin durability, and exit multiples compared to what the market is currently pricing in.
As a result, CGNX stock appears to be trading ahead of consensus valuation estimates, even after factoring in the company’s recent earnings outperformance.
Estimate a company’s fair value instantly (Free with TIKR) >>>
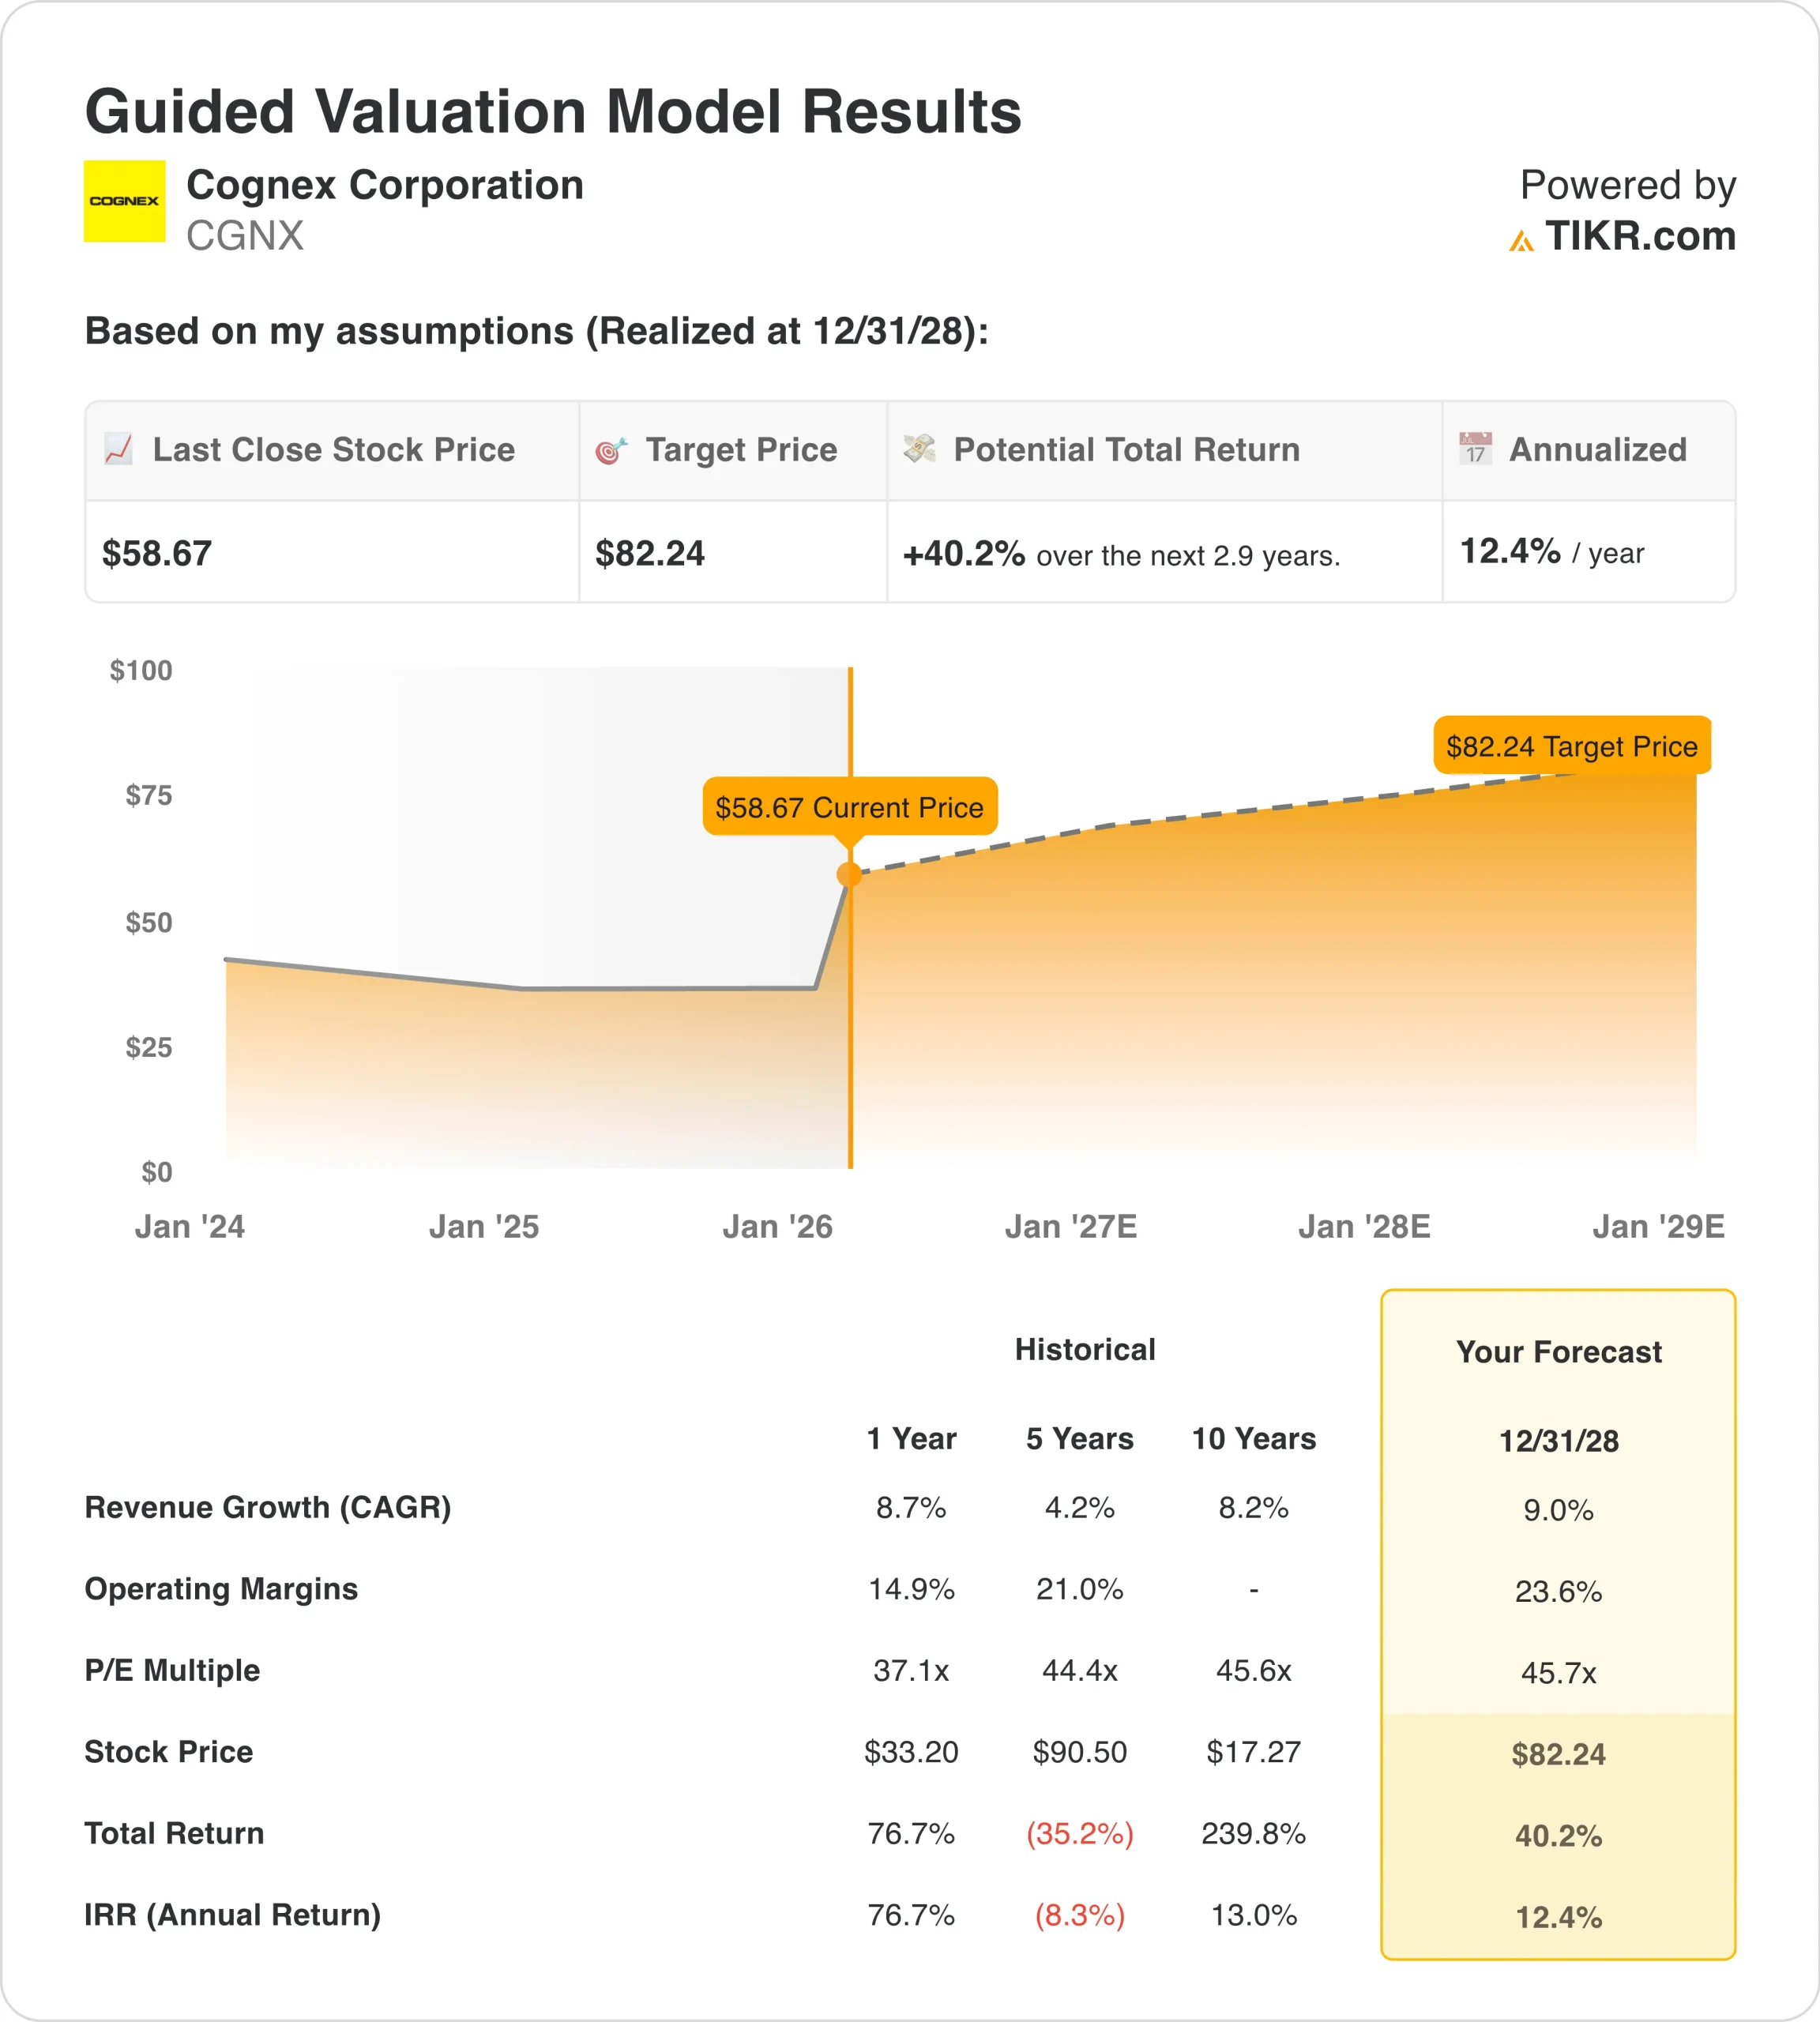
How Much Upside Does CGNX Stock Have From Here?
With TIKR’s new Valuation Model tool, you can estimate a stock’s potential share price in under a minute.
All it takes is three simple inputs:
- Revenue Growth
- Operating Margins
- Exit P/E Multiple
If you’re not sure what to enter, TIKR automatically fills in each input using analysts’ consensus estimates, giving you a quick, reliable starting point.
From there, TIKR calculates the potential share price and total returns under Bull, Base, and Bear scenarios so you can quickly see whether a stock looks undervalued or overvalued.
See a stock’s true value in under 60 seconds (Free with TIKR) >>>
Looking for New Opportunities?
- See what stocks billionaire investors are buying so you can follow the smart money.
- Analyze stocks in as little as 5 minutes with TIKR’s all-in-one, easy-to-use platform.
- The more rocks you overturn… the more opportunities you’ll uncover. Search 100K+ global stocks, global top investor holdings, and more with TIKR.
Disclaimer:
Please note that the articles on TIKR are not intended to serve as investment or financial advice from TIKR or our content team, nor are they recommendations to buy or sell any stocks. We create our content based on TIKR Terminal’s investment data and analysts’ estimates. Our analysis might not include recent company news or important updates. TIKR has no position in any stocks mentioned. Thank you for reading, and happy investing!