
Key Stats for TDC Stock
- Price Change for TDC stock: +29.59%
- TDC Share Price as of Feb. 11: $37.88
- 52-Week High: $32.03
- TDC Stock Price Target: $29
Now Live: Discover how much upside your favorite stocks could have using TIKR’s new Valuation Model (It’s free)>>>
What Happened?
Teradata (TDC) stock surged after the company reported fourth-quarter earnings that beat expectations. Adjusted EPS came in at $0.74, above analyst estimates of $0.56, and revenue also topped forecasts.
Recurring revenue rose 5% to $367 million, which helped support margins and cash flow. Management also reiterated its focus on cost discipline and free cash flow generation.
The earnings beat followed several strong quarters, as Teradata has consistently exceeded EPS estimates. That track record helped fuel investor confidence and drove the sharp move higher.
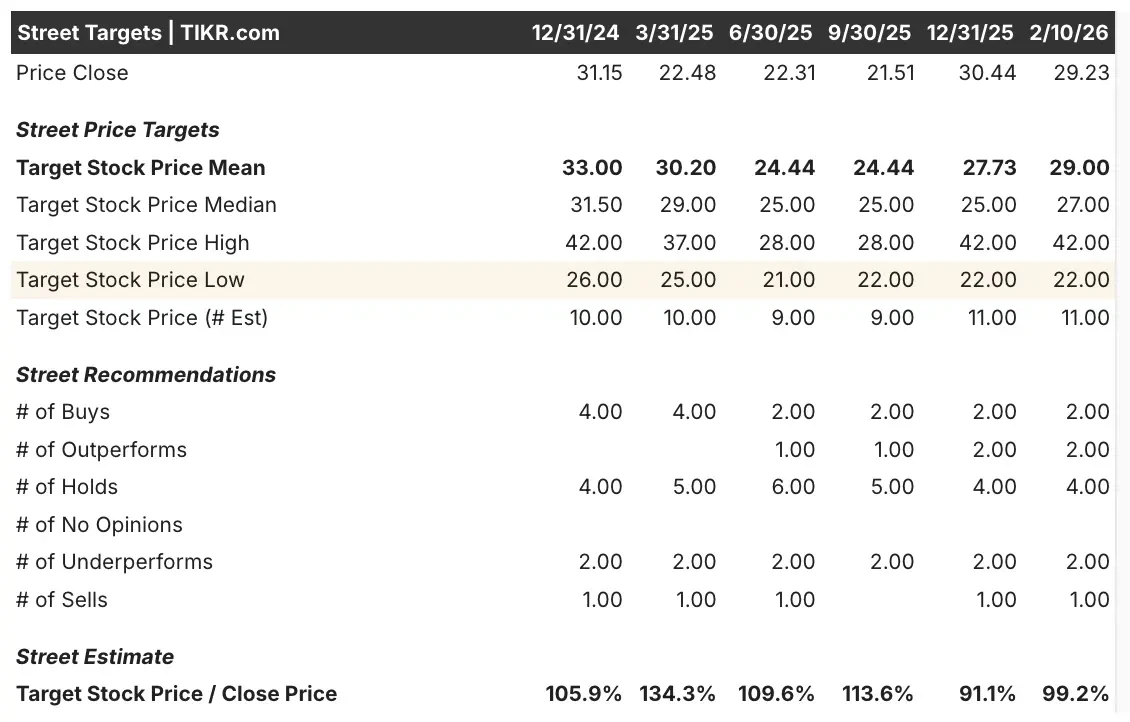
See analysts’ growth forecasts and price targets for TDC stock (It’s free!) >>>
What the Market Is Telling Us About TDC Stock
The rally suggests investors are rewarding execution and earnings consistency.
Teradata posted an LTM operating margin of 12%, supported by a gross margin near 59%.
Free cash flow remains a key strength. The company generated over $300 million in operating cash flow over the past year and continues share buybacks.
However, growth remains modest. Forward revenue growth is expected to stay in the low single digits, and EBITDA growth is also limited.
Teradata operates in a competitive analytics software market, which creates long-term pressure on growth. While margins are stable, upside depends more on efficiency than top-line acceleration.
Estimate a company’s fair value instantly (Free with TIKR) >>>
How Much Upside Does TDC Stock Have From Here?
With TIKR’s new Valuation Model tool, you can estimate a stock’s potential share price in under a minute.
All it takes is three simple inputs:
- Revenue Growth
- Operating Margins
- Exit P/E Multiple
If you’re not sure what to enter, TIKR automatically fills in each input using analysts’ consensus estimates, giving you a quick, reliable starting point.
From there, TIKR calculates the potential share price and total returns under Bull, Base, and Bear scenarios so you can quickly see whether a stock looks undervalued or overvalued.
See a stock’s true value in under 60 seconds (Free with TIKR) >>>
Looking for New Opportunities?
- See what stocks billionaire investors are buying so you can follow the smart money.
- Analyze stocks in as little as 5 minutes with TIKR’s all-in-one, easy-to-use platform.
- The more rocks you overturn… the more opportunities you’ll uncover. Search 100K+ global stocks, global top investor holdings, and more with TIKR.
Disclaimer:
Please note that the articles on TIKR are not intended to serve as investment or financial advice from TIKR or our content team, nor are they recommendations to buy or sell any stocks. We create our content based on TIKR Terminal’s investment data and analysts’ estimates. Our analysis might not include recent company news or important updates. TIKR has no position in any stocks mentioned. Thank you for reading, and happy investing!