Most investors look at a company’s most recent quarter and form an opinion. Revenue was up, margins held, and earnings beat estimates. That’s a start, but it’s also a little like judging a movie based on one scene. What you’re really trying to understand is whether this business is improving over time, holding steady, or quietly deteriorating in ways the latest headline number doesn’t reveal. That’s the problem horizontal analysis is designed to solve.
Horizontal analysis is the practice of comparing a company’s financial results across multiple periods, examining how each line item has changed in both dollar and percentage terms over time. It sounds straightforward because it is. You’re not building a complex model or estimating intrinsic value. You’re reading the same financial statements you’d look at anyway, just laid out side by side so the trends become visible. The insight comes from context, and context requires time.
The contrast to understand here is with vertical analysis, which looks at a single period and expresses each line item as a percentage of revenue. That’s useful for understanding a business’s cost structure at a point in time. Horizontal analysis does something different. It asks whether that structure is improving or deteriorating, and at what rate. Both views matter, but for spotting momentum and identifying problems early, horizontal analysis is the more powerful.
Find out what a stock’s really worth in under 60 seconds with TIKR’s new Valuation Model (It’s free)>>>
The Basics: Absolute Changes vs. Percentage Changes
When you run a horizontal analysis, you’re tracking two things simultaneously. The first is the absolute dollar change, meaning how much a given line item grew or shrank in raw terms from one period to the next. The second is the percentage change, which normalizes that dollar movement relative to the prior period’s base.

Both views tell you something different, and absolute changes matter for understanding scale. If a company’s operating expenses grew by $2 billion, that’s a different conversation than if they grew by $200 million, even if the percentage increase looks similar. Percentage changes matter for understanding pace. A business growing revenue at 25% per year for three consecutive years is compounding in a way that a business growing at 8% simply isn’t, and the percentage view is what makes that obvious at a glance.
The most useful horizontal analyses track both columns together. You want to know that revenue grew by $3 billion year over year, which represents 18% growth, and how that compares to the 22% growth from the year before. That deceleration is invisible if you’re only reading the latest income statement. Laid out over five years, it’s hard to miss.
Evaluate any stock in less than 60 seconds with TIKR’s Income Statement dashboard (It’s free) >>>
A Real Example: Walking Through Apple’s Income Statement
Take Apple as a familiar reference point. If you pull five years of annual income statement data and lay it side by side, a few things become immediately clear that a single year’s report wouldn’t tell you.

Revenue growth was strong through the iPhone supercycle years, then plateaued, then reaccelerated as services became a larger part of the mix. That transition shows up clearly in horizontal analysis because you can see services revenue growing at a faster clip than product revenue over the same period. Operating income tells an even more interesting story. Even in years when total revenue growth was modest, operating income grew faster, indicating expanding margins. That’s the kind of dynamic that horizontal analysis reveals clearly and that a single quarter’s snapshot would almost certainly obscure.
Gross margin trends are worth particular attention in this kind of exercise. Apple’s gross margin on services is substantially higher than on hardware, so as the revenue mix has shifted, overall gross margins have risen. If you’re reading one quarter in isolation, that margin expansion might look like cost discipline. Reading it over five years, you can see it’s actually a structural shift in the business model. That’s a meaningfully different interpretation, and it changes how you think about the stock.
Access the full income statements of over 100,000 global stocks with TIKR >>>
What Red Flags Actually Look Like
Horizontal analysis is useful for confirming good businesses, but it’s arguably more valuable for flagging deteriorating ones before the problems become obvious. A few patterns are worth watching closely.
Revenue growing while gross margins compress is a warning sign. It can mean the company is discounting to win deals, facing rising input costs it can’t pass through, or competing in a market where pricing power is eroding. Any of those dynamics is worth investigating further. The revenue growth number alone looks fine on the surface, which is exactly why the margin line matters.

SG&A growing faster than revenue is another flag. Sales, general, and administrative expenses should ideally scale more slowly than revenue as a business matures, because a more efficient company needs to spend less to generate each additional dollar of sales. If SG&A is consistently outpacing revenue growth, it could mean the company is struggling to retain customers, losing sales efficiency, or simply spending aggressively without the returns to justify it. Watching this ratio over three to five years tells you far more than any single quarter can.
Operating income declining while revenue grows is perhaps the most telling of all. It means the business is becoming less profitable on an absolute basis, even as the top line expands, which usually points to cost-structure problems that management may or may not have fully acknowledged. Catching that pattern early, before it shows up in earnings misses, is one of the clearest advantages of doing this kind of analysis consistently.
How to Use TIKR for Horizontal Analysis
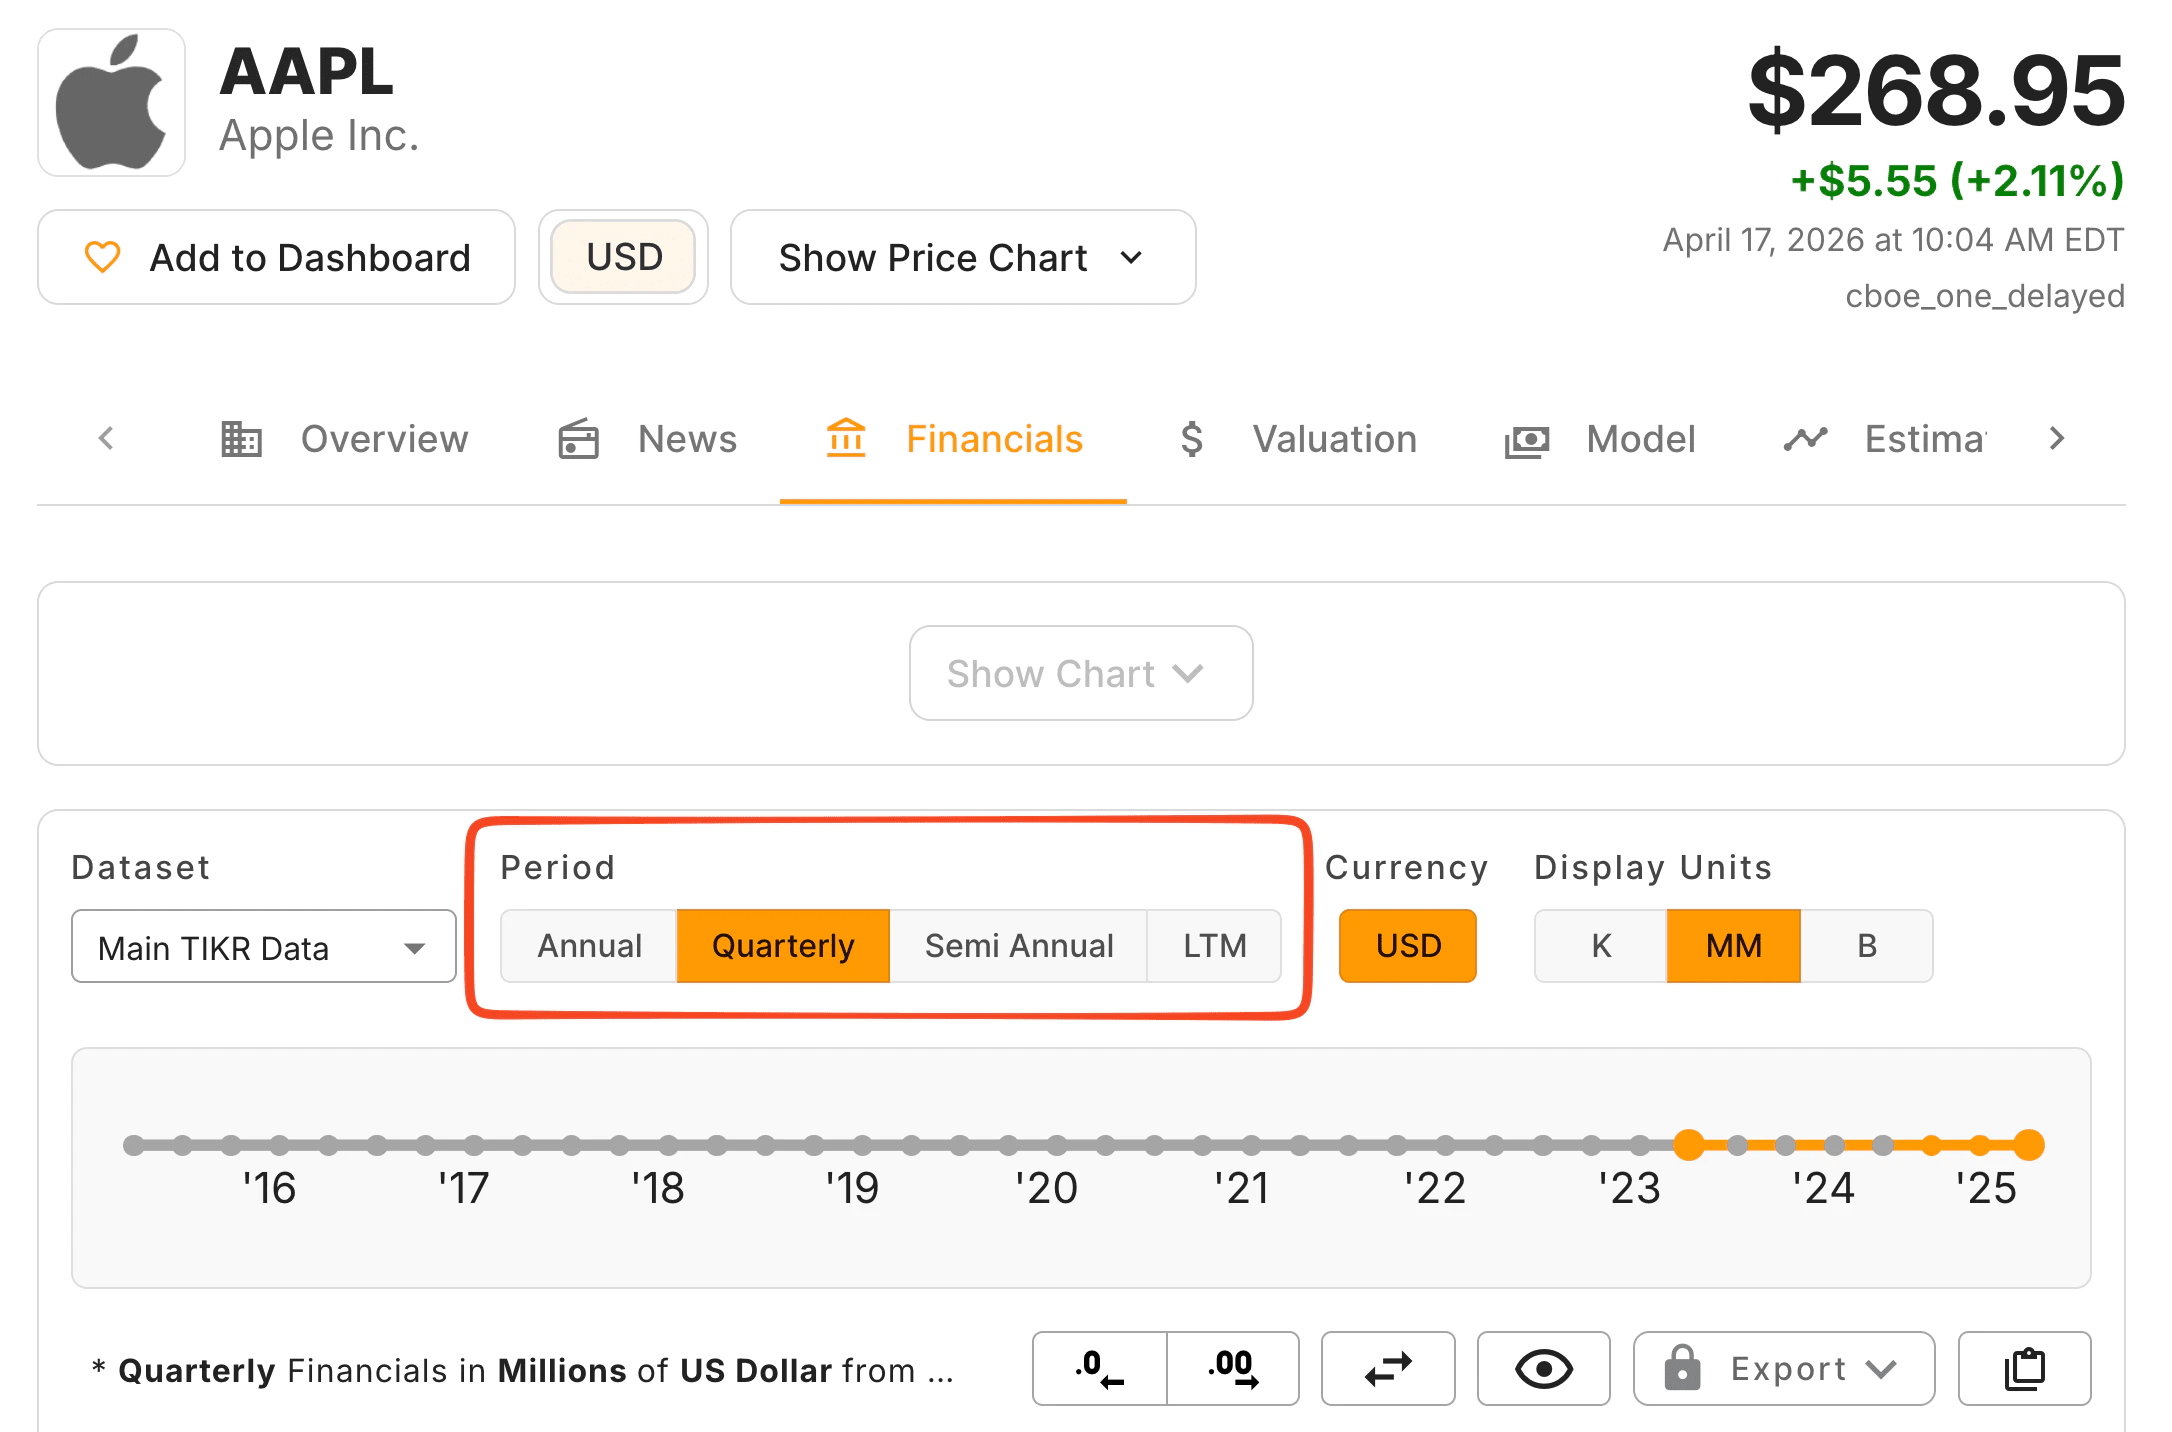
TIKR’s Detailed Financials section is built for exactly this kind of work. When you pull up any company’s income statement, balance sheet, or cash flow statement, you’re not looking at a single period in isolation. The data stretches across multiple years, and you can toggle between annual and quarterly views depending on what you’re trying to see.
The timeline slider lets you extend the historical window well beyond what most free financial sites show, giving you a decade or more of data for established companies. That range matters because some of the most important trends in a business take years to develop and years to fully reverse. You can also click any row in the financials table to generate a chart immediately, converting a column of numbers into a visual trend line. For something like gross margin over ten years, seeing the chart is often faster and more intuitive than reading the table.
The ability to view data as both absolute figures and percentage changes makes horizontal analysis practical within TIKR, rather than something you’d have to export to a spreadsheet to complete. You can watch revenue, operating income, and margins move together over the same time window, where the real patterns emerge. When those lines start diverging in ways that don’t make sense, that’s usually worth a closer look at the transcripts and filings to understand what management is saying about it.
Find the best high-margin, high-quality stocks to buy today with TIKR >>>
TIKR Takeaway
Horizontal analysis doesn’t require a financial modeling background or hours of spreadsheet work. It requires the right data laid out in the right format, and the discipline to look at more than one year at a time.
When you compare a company’s revenue, margins, and expenses across three to five years, the story of the business becomes clearer than any single earnings report can make it. Trends that look temporary often turn out to be structural, and trends that look alarming sometimes resolve quickly. You can’t tell the difference without the historical context.
TIKR makes that context available the moment you open a company’s financials. With more than a decade of data accessible across income statements, balance sheets, and cash flow statements, and the ability to toggle between absolute and percentage views, the platform turns horizontal analysis from a time-consuming exercise into a natural part of how you read a business.
Add the chart visualization for any individual metric and transcript access to hear what management said during periods when the numbers shifted, and you have everything you need to understand not just what happened, but why.
Value Any Stock in Under 60 Seconds with TIKR
With TIKR’s new Valuation Model tool, you can estimate a stock’s potential share price in under a minute.
All it takes is three simple inputs:
- Revenue Growth
- Operating Margins
- Exit P/E Multiple
If you’re not sure what to enter, TIKR automatically fills in each input using analysts’ consensus estimates, giving you a quick, reliable starting point.
From there, TIKR calculates the potential share price and total returns under Bull, Base, and Bear scenarios so you can quickly see whether a stock looks undervalued or overvalued.
See a stock’s true value in under 60 seconds (Free with TIKR) >>>
Looking for New Opportunities?
- Discover which stocks billionaire investors are purchasing, so you can follow the smart money.
- Analyze stocks in as little as 5 minutes with TIKR’s all-in-one, easy-to-use platform.
- The more rocks you overturn… the more opportunities you’ll uncover. Search 100K+ global stocks, global top investor holdings, and more with TIKR.
Disclaimer:
Please note that the articles on TIKR are not intended to serve as investment or financial advice from TIKR or our content team, nor are they recommendations to buy or sell any stocks. We create our content based on TIKR Terminal’s investment data and analysts’ estimates. Our analysis might not include recent company news or important updates. TIKR has no position in any stocks mentioned. Thank you for reading, and happy investing!