Financial statements act as the ultimate scorecard for any business as they tell the story of how capital is generated, where it is deployed, and whether a company is actually creating value or merely consuming cash. For the fundamental investor, the ability to read these documents is the primary defense against market noise and speculative hype.
Historically, analyzing these statements required manual effort, such as downloading spreadsheets from the SEC, cleaning raw data, and building your own models from scratch. This process was not only tedious but also prone to human error, often preventing investors from performing the rapid, side-by-side comparisons necessary for informed decision-making.
Today, a new generation of financial tools has turned this burdensome task into a streamlined, high-speed research process. By using these platforms, you can transform dense 10-K filings into clear, visual trends. The following tools offer different methods for visualizing balance sheets, income statements, and cash flow data, ensuring you are grounded in the business’s actual economics rather than just the stock price.
1. TIKR
TIKR is the premier platform for investors who demand institutional-grade depth alongside a user-friendly workflow. Unlike basic data sites, TIKR offers years of standardized financial data for over 100,000 global stocks. This extensive history allows you to identify long-term trends in margins, return on invested capital, and debt levels that are impossible to spot in a single year of data.
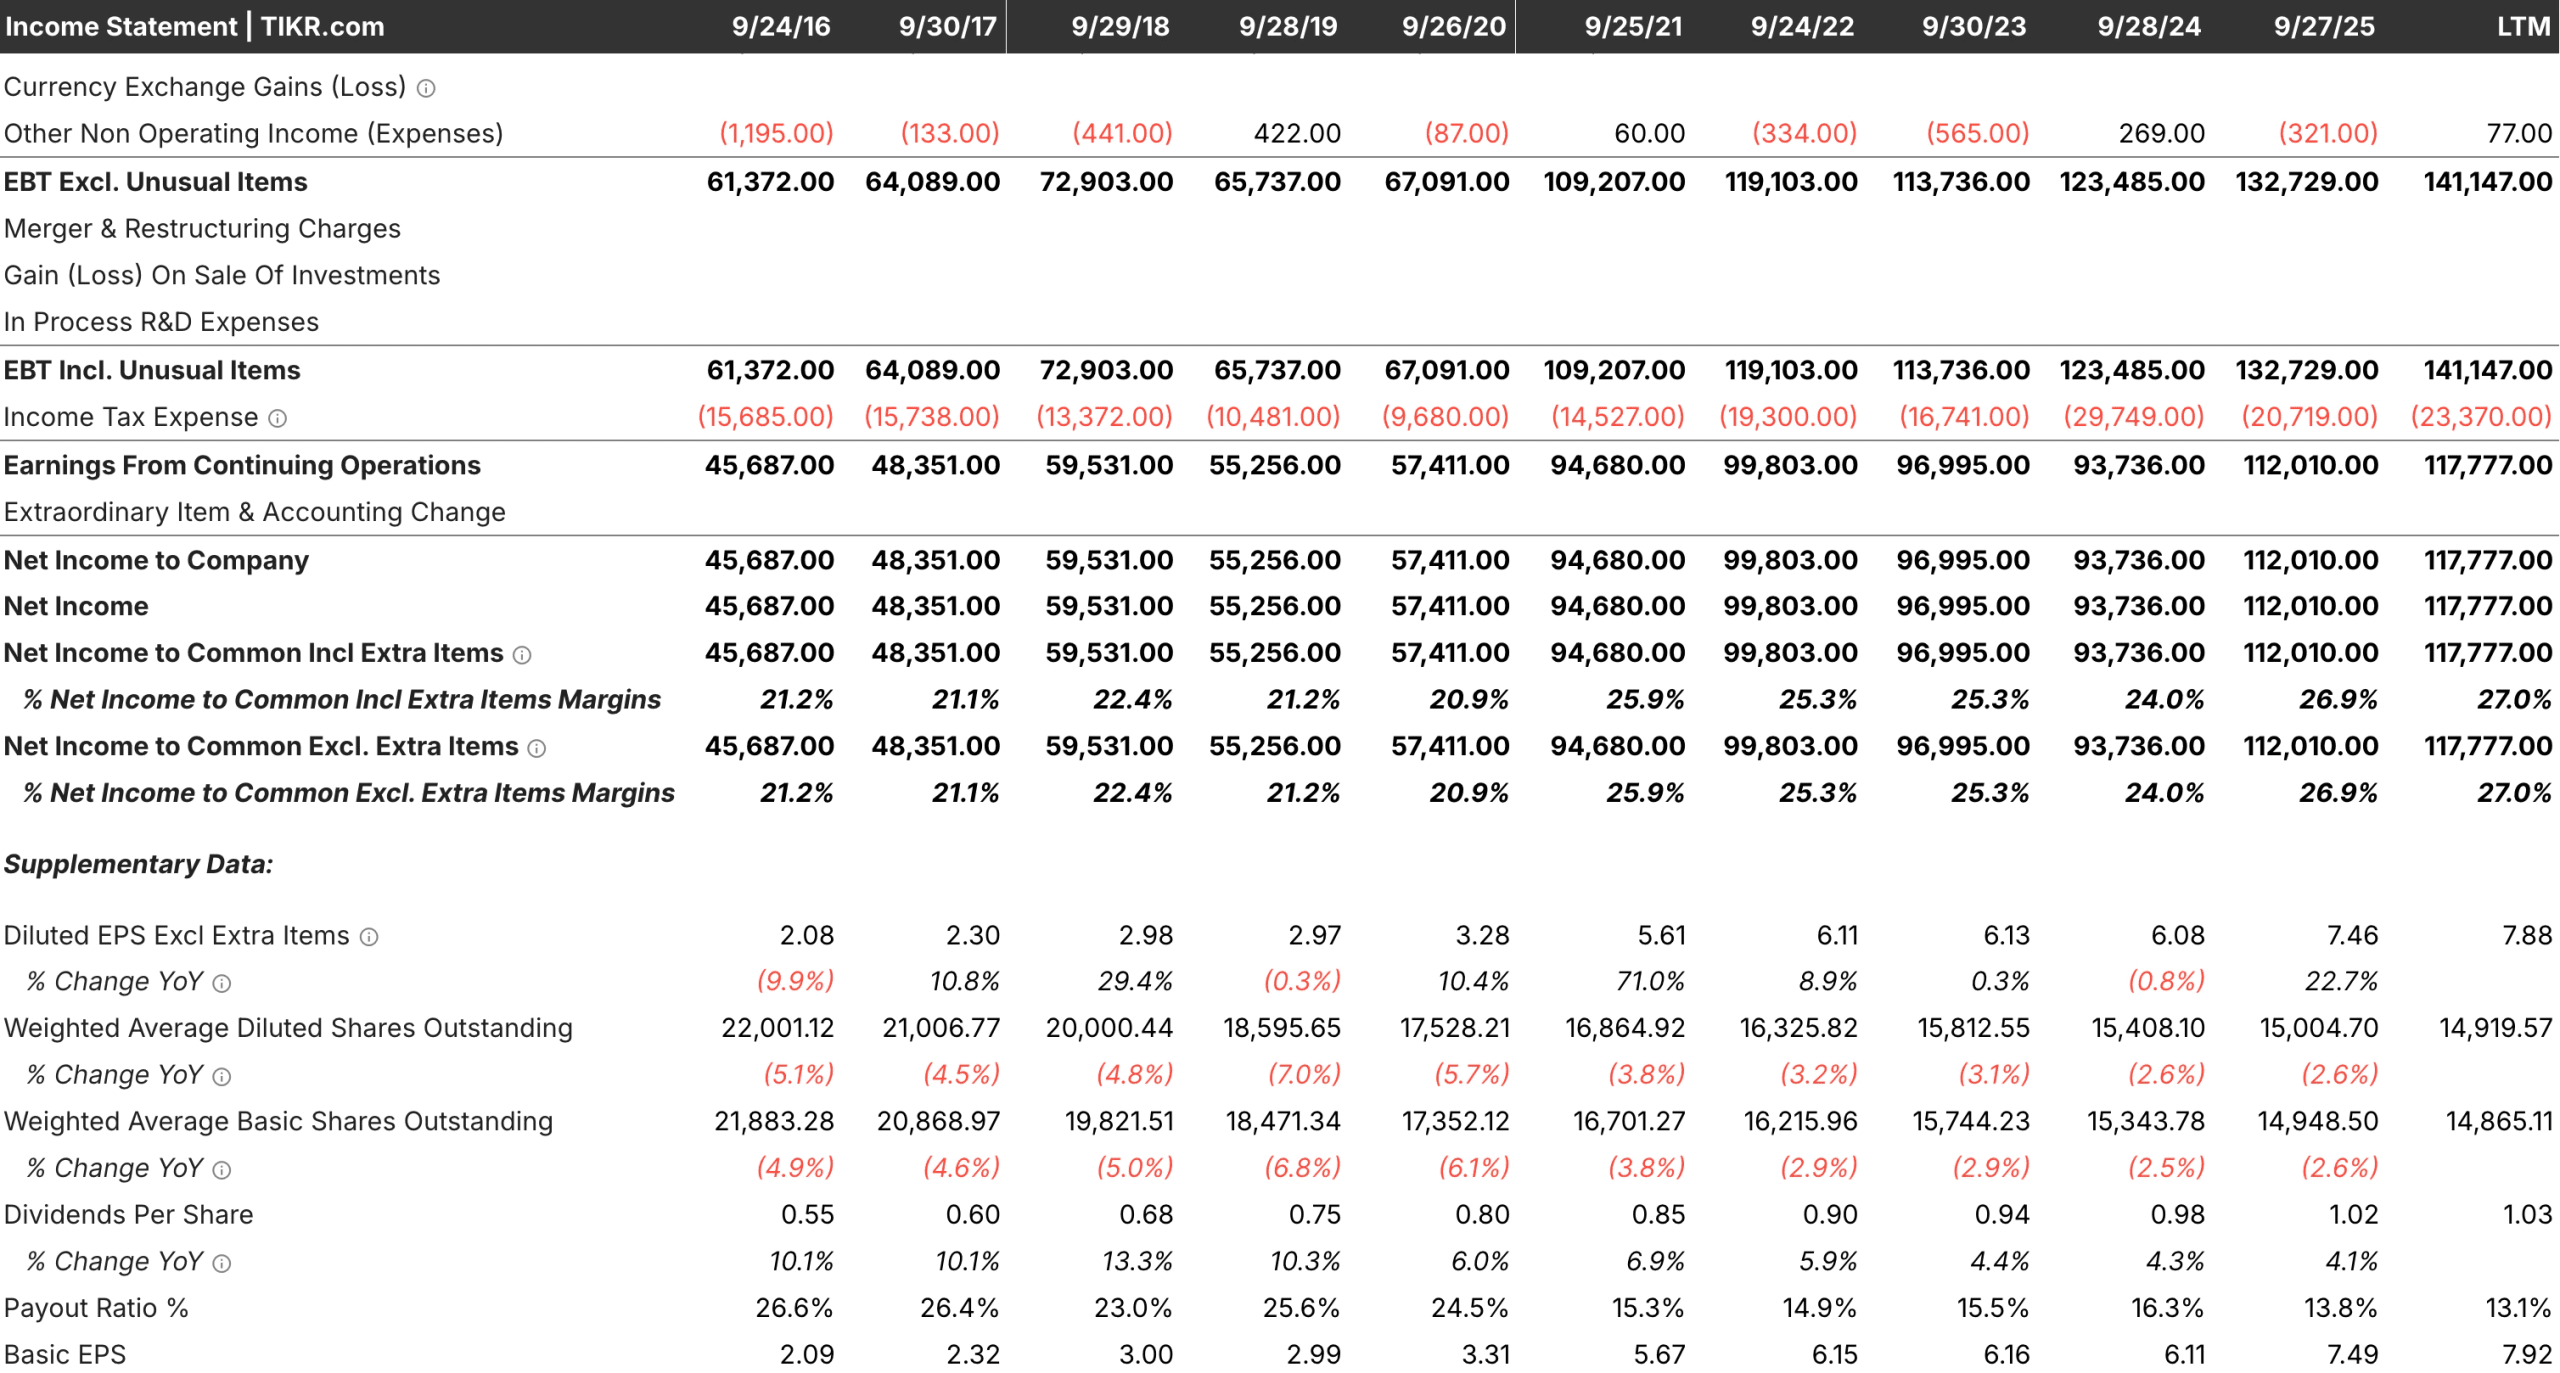
The platform excels by connecting the financial “numbers” with the narrative “story.” You can toggle between standardized income statements, balance sheets, and cash flow statements, then immediately jump to earnings transcripts to see whether management’s stated goals align with the realized financial results. This integration of qualitative context with quantitative data is what separates TIKR from every other tool on this list.
Evaluate any stock in less than 60 seconds with TIKR’s Income Statement dashboard (It’s free) >>>
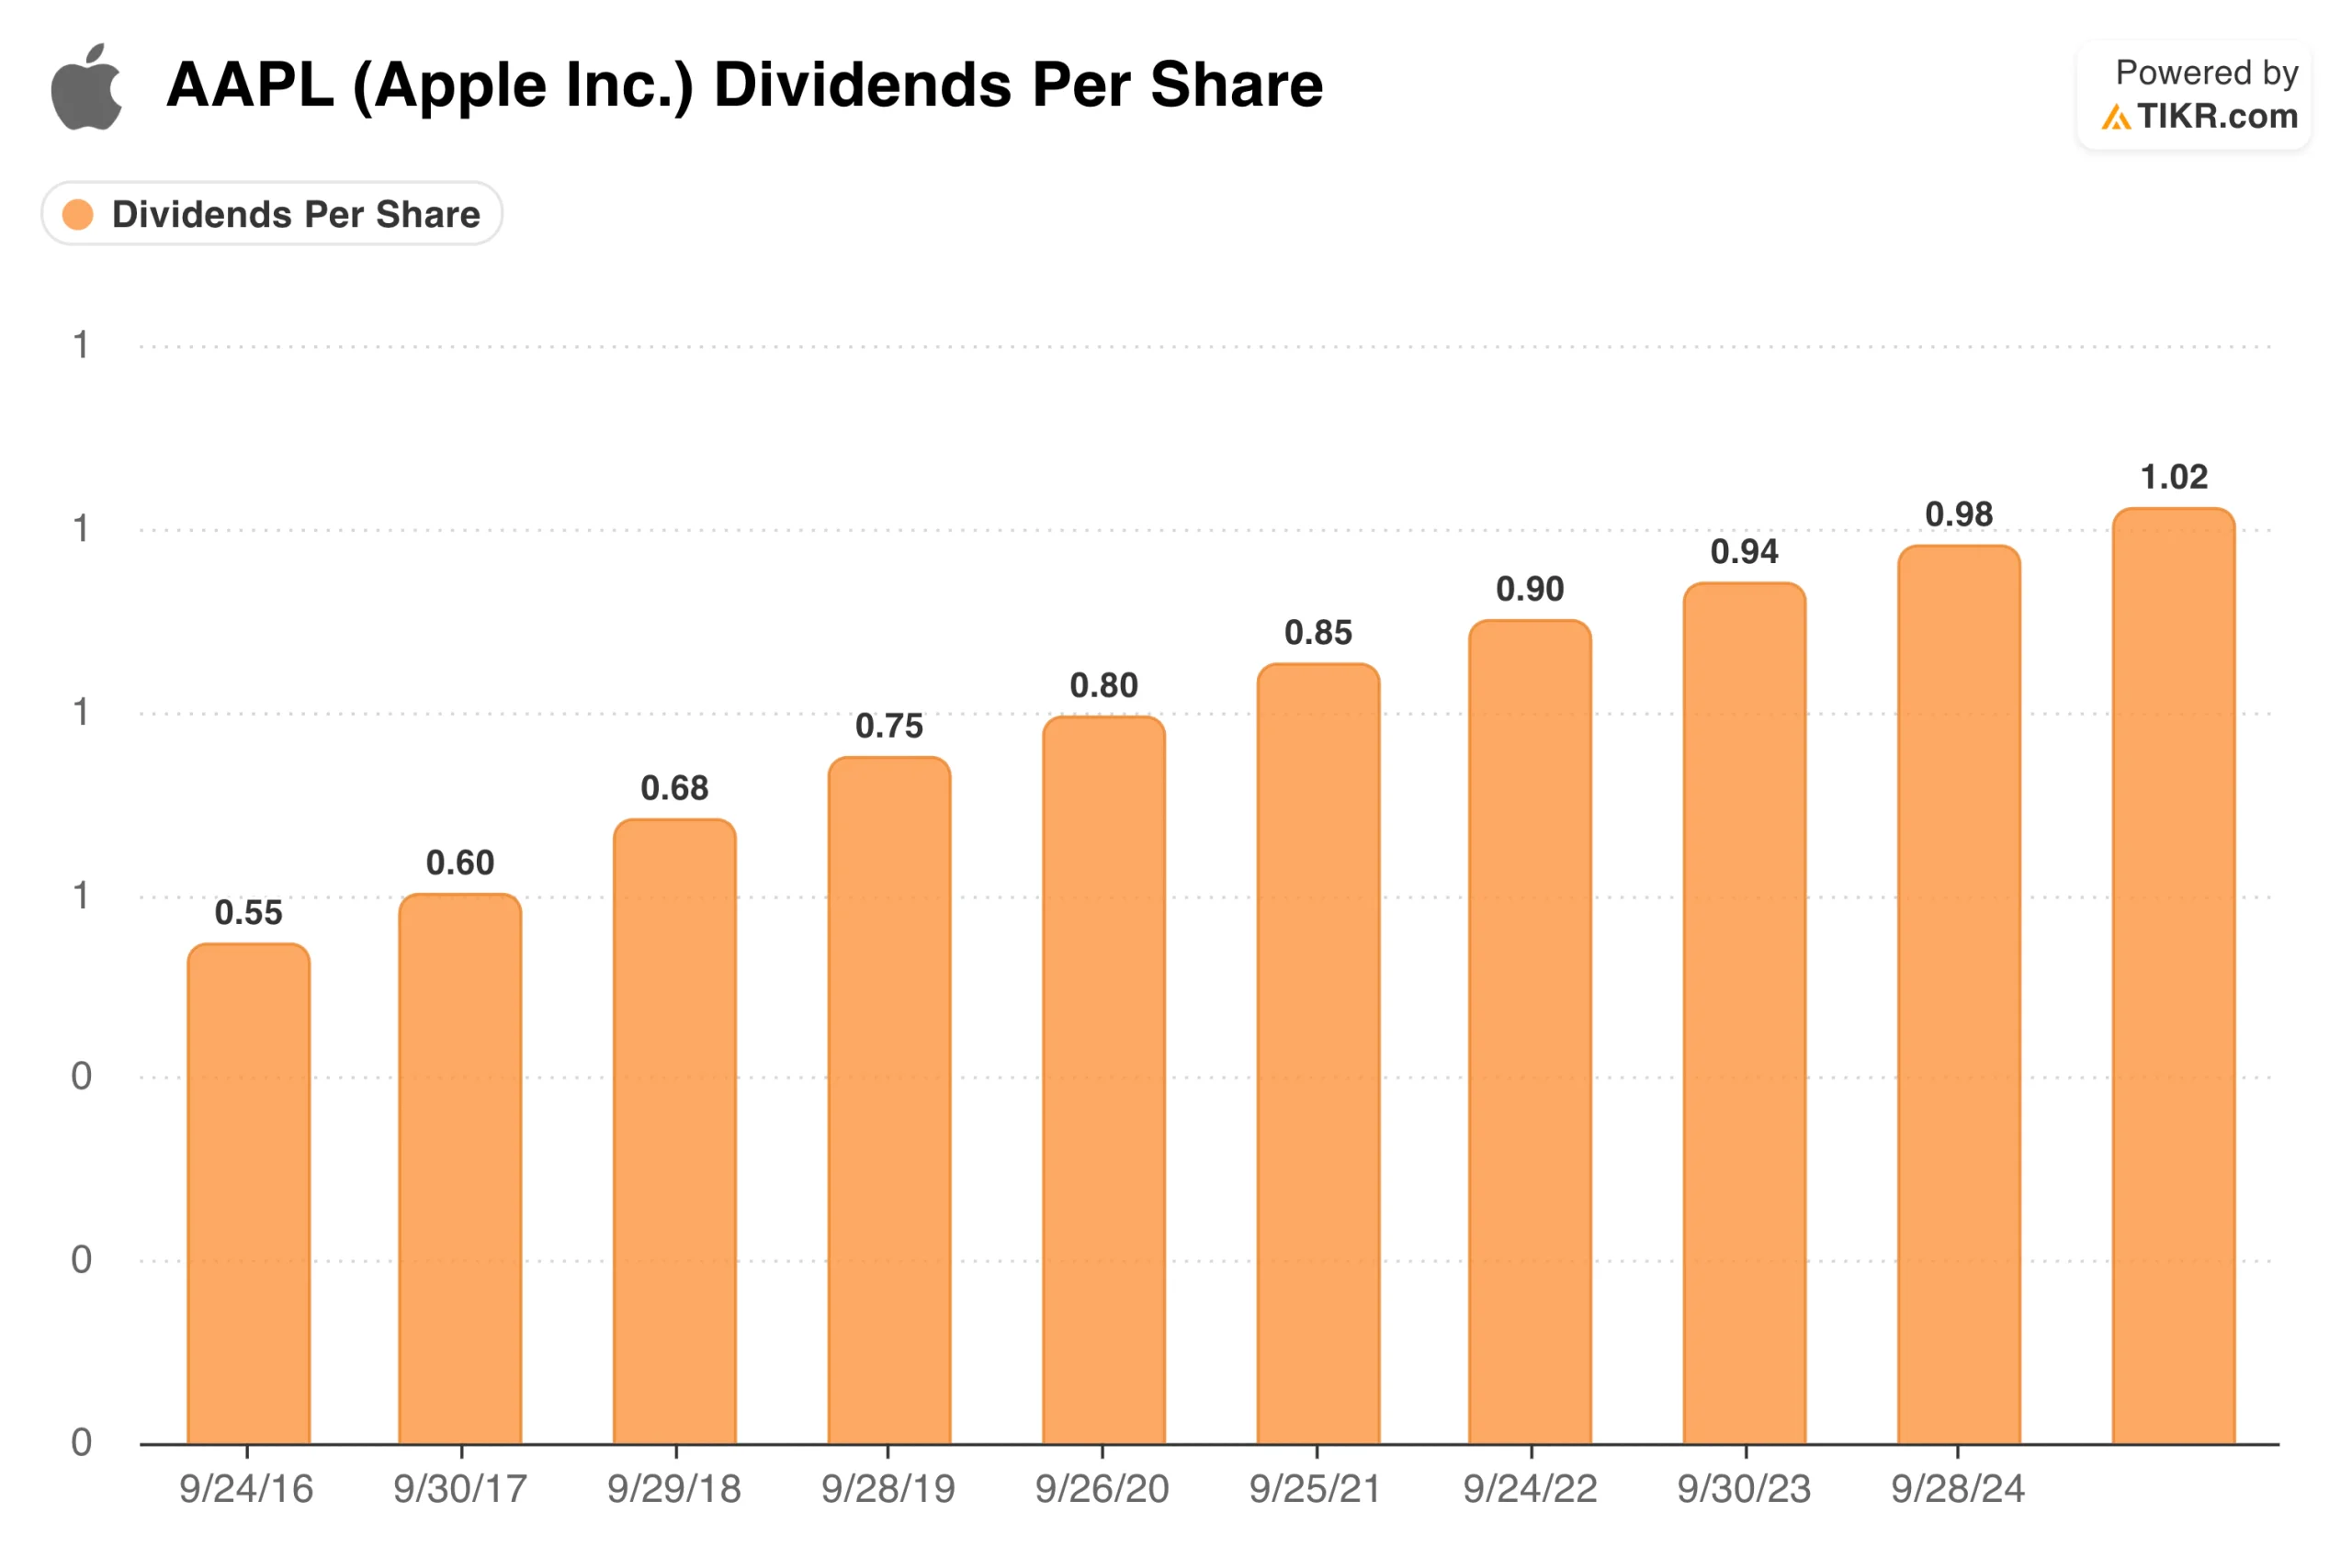
Furthermore, TIKR features customizable valuation and modeling tools that allow you to test your own assumptions against the Wall Street consensus. You can create saved views to track specific metrics, such as Free Cash Flow growth or dividend payout stability, over time, making it the most efficient command center for building a deep, fundamental understanding of any business.
Best Features:
- 15+ Years of Standardized Data: Access massive, historical data sets for 100,000+ global companies.
- Transcript Integration: Read management commentary and earnings calls side-by-side with financial statements.
- Valuation & Multiples: Overlay P/E, EV/EBITDA, and FCF yields directly onto historical financial charts.
- Customizable Views: Build and save specific layouts to track the metrics that matter most to your research.
Access the full income statements of over 100,000 global stocks with TIKR >>>
2. Yahoo Finance
Yahoo Finance is the industry standard for investors who need a quick, reliable snapshot of a company’s financial health. It is often the first place investors go to pull up a summary of revenue, net income, and basic balance sheet items. The platform is excellent for rapid review because it is ubiquitous, free, and requires no complex setup to view the latest quarterly figures.

The platform provides a clean, standard view of the “Big Three” financial statements, making it easy to spot year-over-year revenue growth or changes in total debt. While it lacks the deep, 10-plus-year history and advanced modeling capabilities of professional tools, it serves as a highly functional, low-friction starting point for fundamental research.
Best Features: Yahoo Finance is the best choice for investors who need a reliable, high-speed, and easy-to-use overview of basic financial statements for almost any public company.
Find the best high-margin, high-quality stocks to buy today with TIKR >>>
3. Koyfin
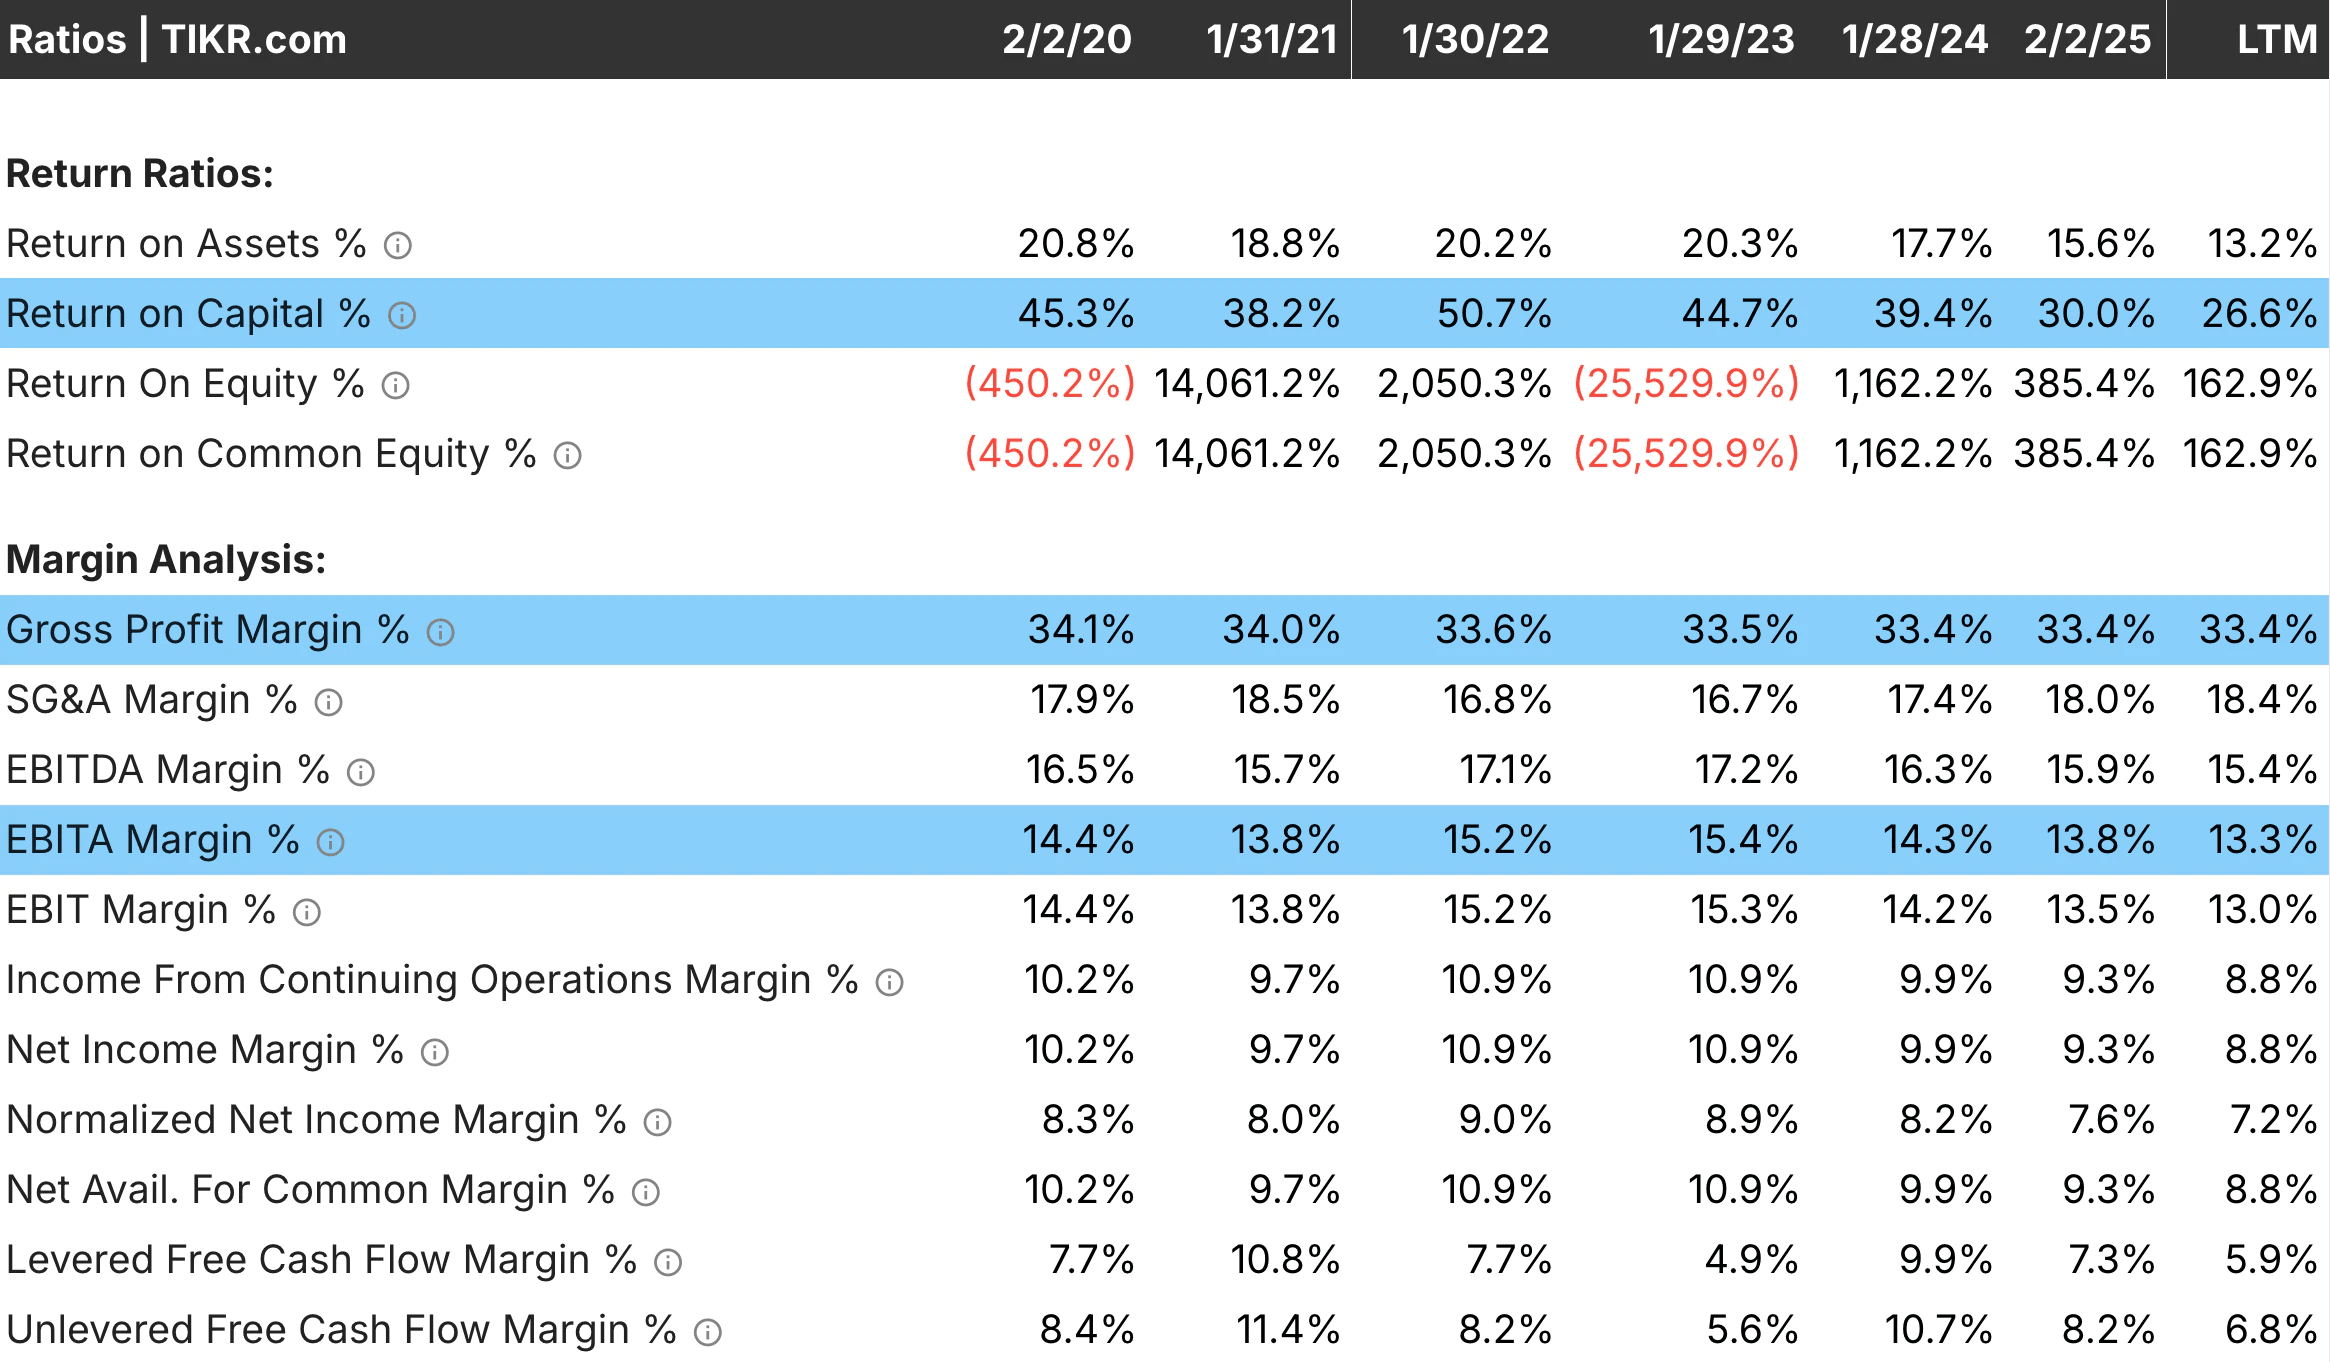
Koyfin is designed for users who want the power and aesthetic of a professional market terminal without the five-figure price tag. It offers a highly customizable dashboard environment where you can plot financial data, create watchlists, and visualize trends across multiple years. For investors who enjoy building their own analytical workspace, Koyfin provides a level of design and responsiveness that feels distinctly enterprise-grade.
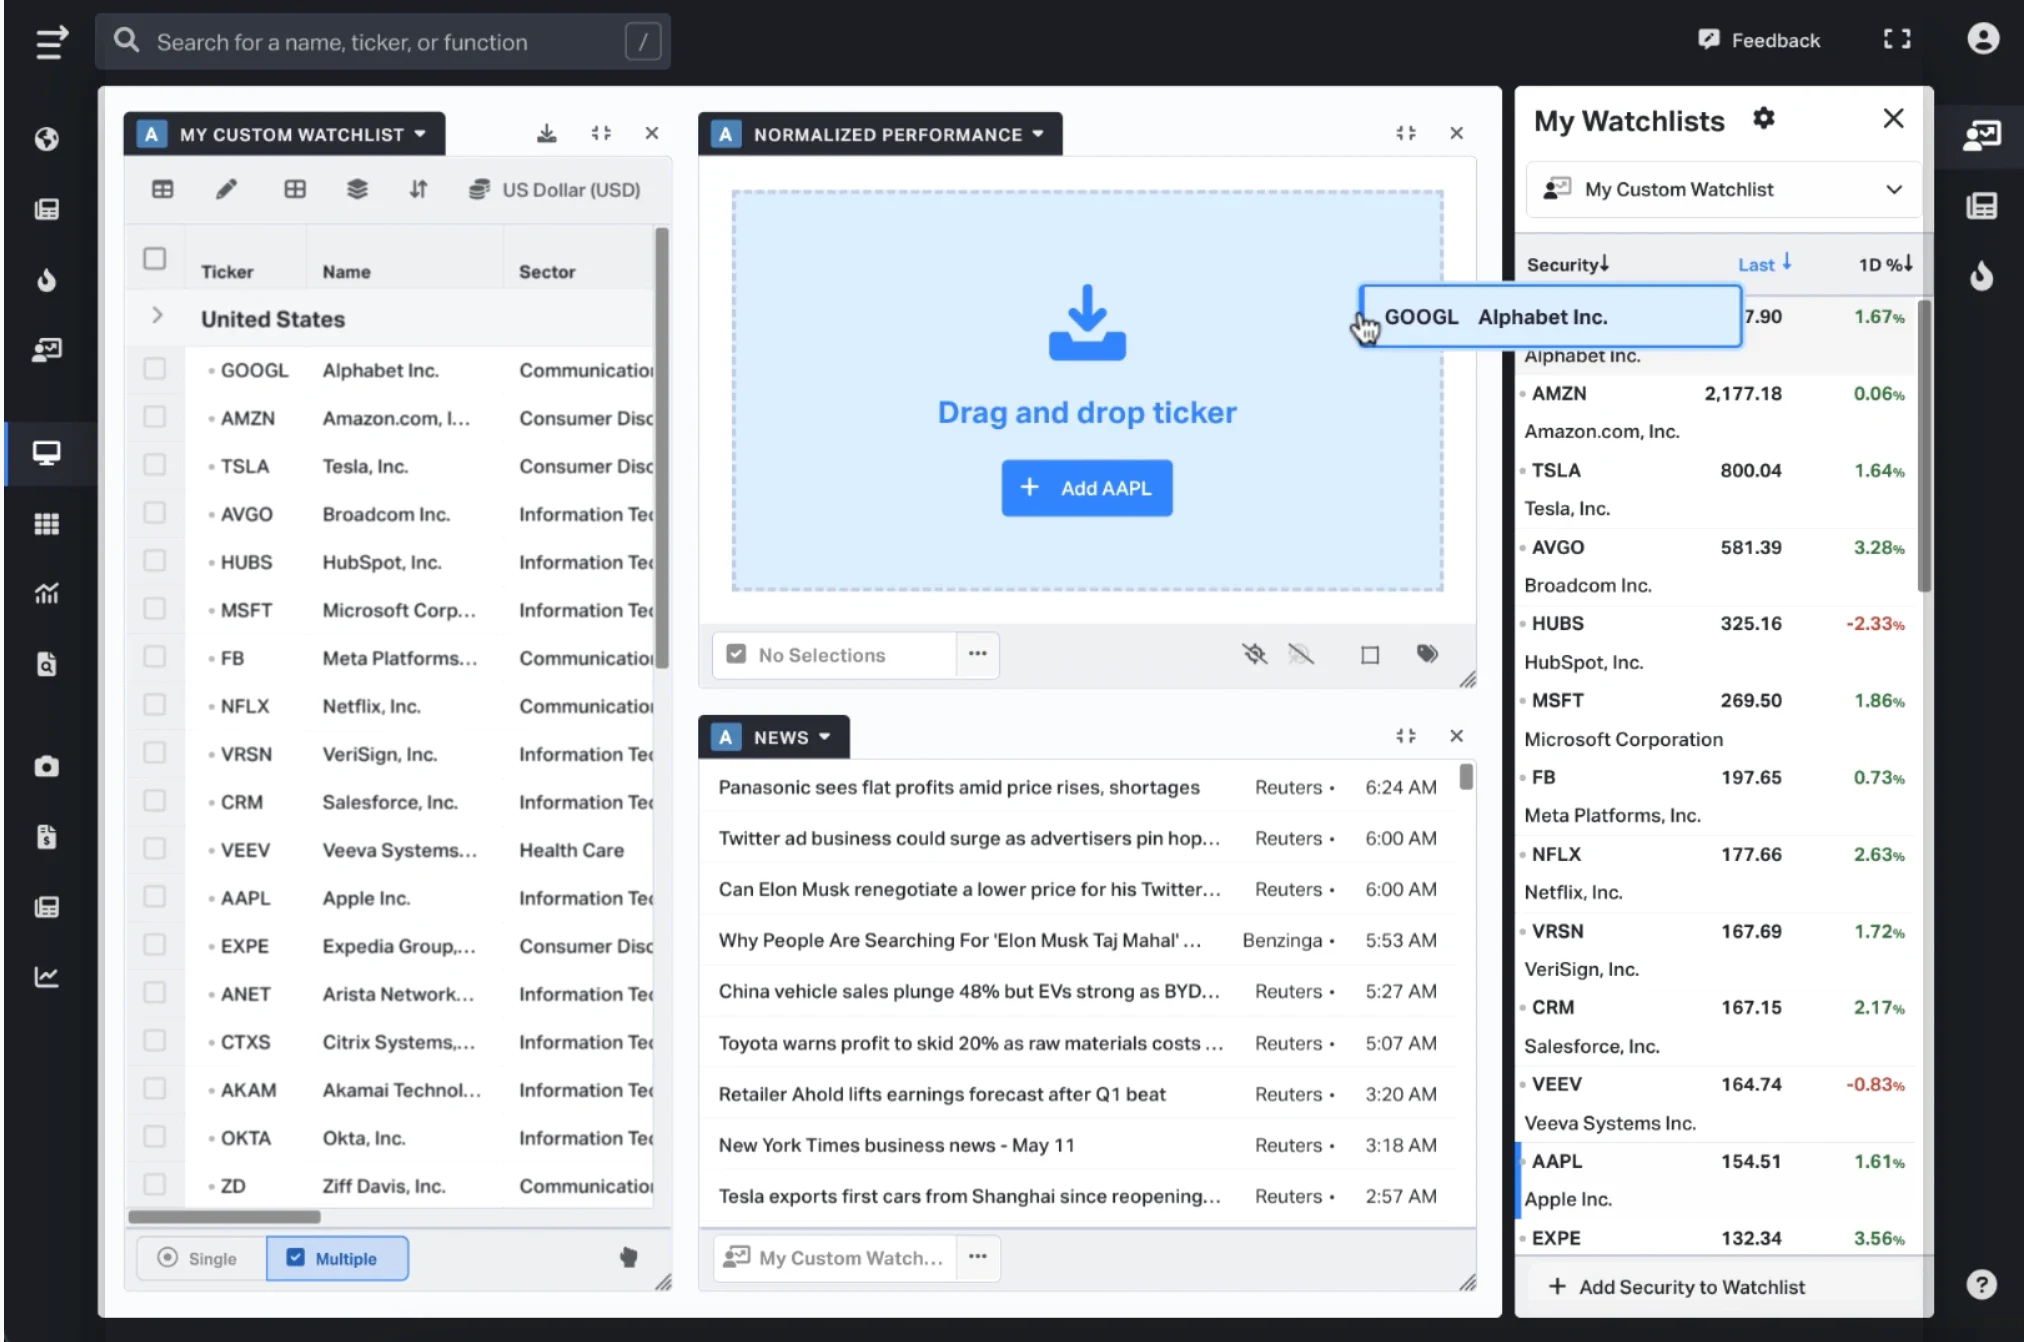
The platform is particularly strong at visualizing data, offering high-quality charting tools for financial metrics such as EBITDA and Operating Margin. You can create saved templates to quickly view a company’s historical performance, and the platform provides granular control over how the data is displayed. It is an excellent middle ground between simple summary sites and full-blown institutional terminals.
Best Features: Koyfin offers an enterprise-grade, customizable dashboard that allows users to create professional-level visualizations of long-term financial trends.
4. FactSet
FactSet is widely considered the gold standard in the financial industry, serving as the benchmark for professional analysts and portfolio managers. It provides deep, institutional-level data, covering everything from granular segment reporting to complex economic indicators. Because it is an enterprise-focused platform, its data accuracy and breadth are considered the primary source for the world’s most successful firms.
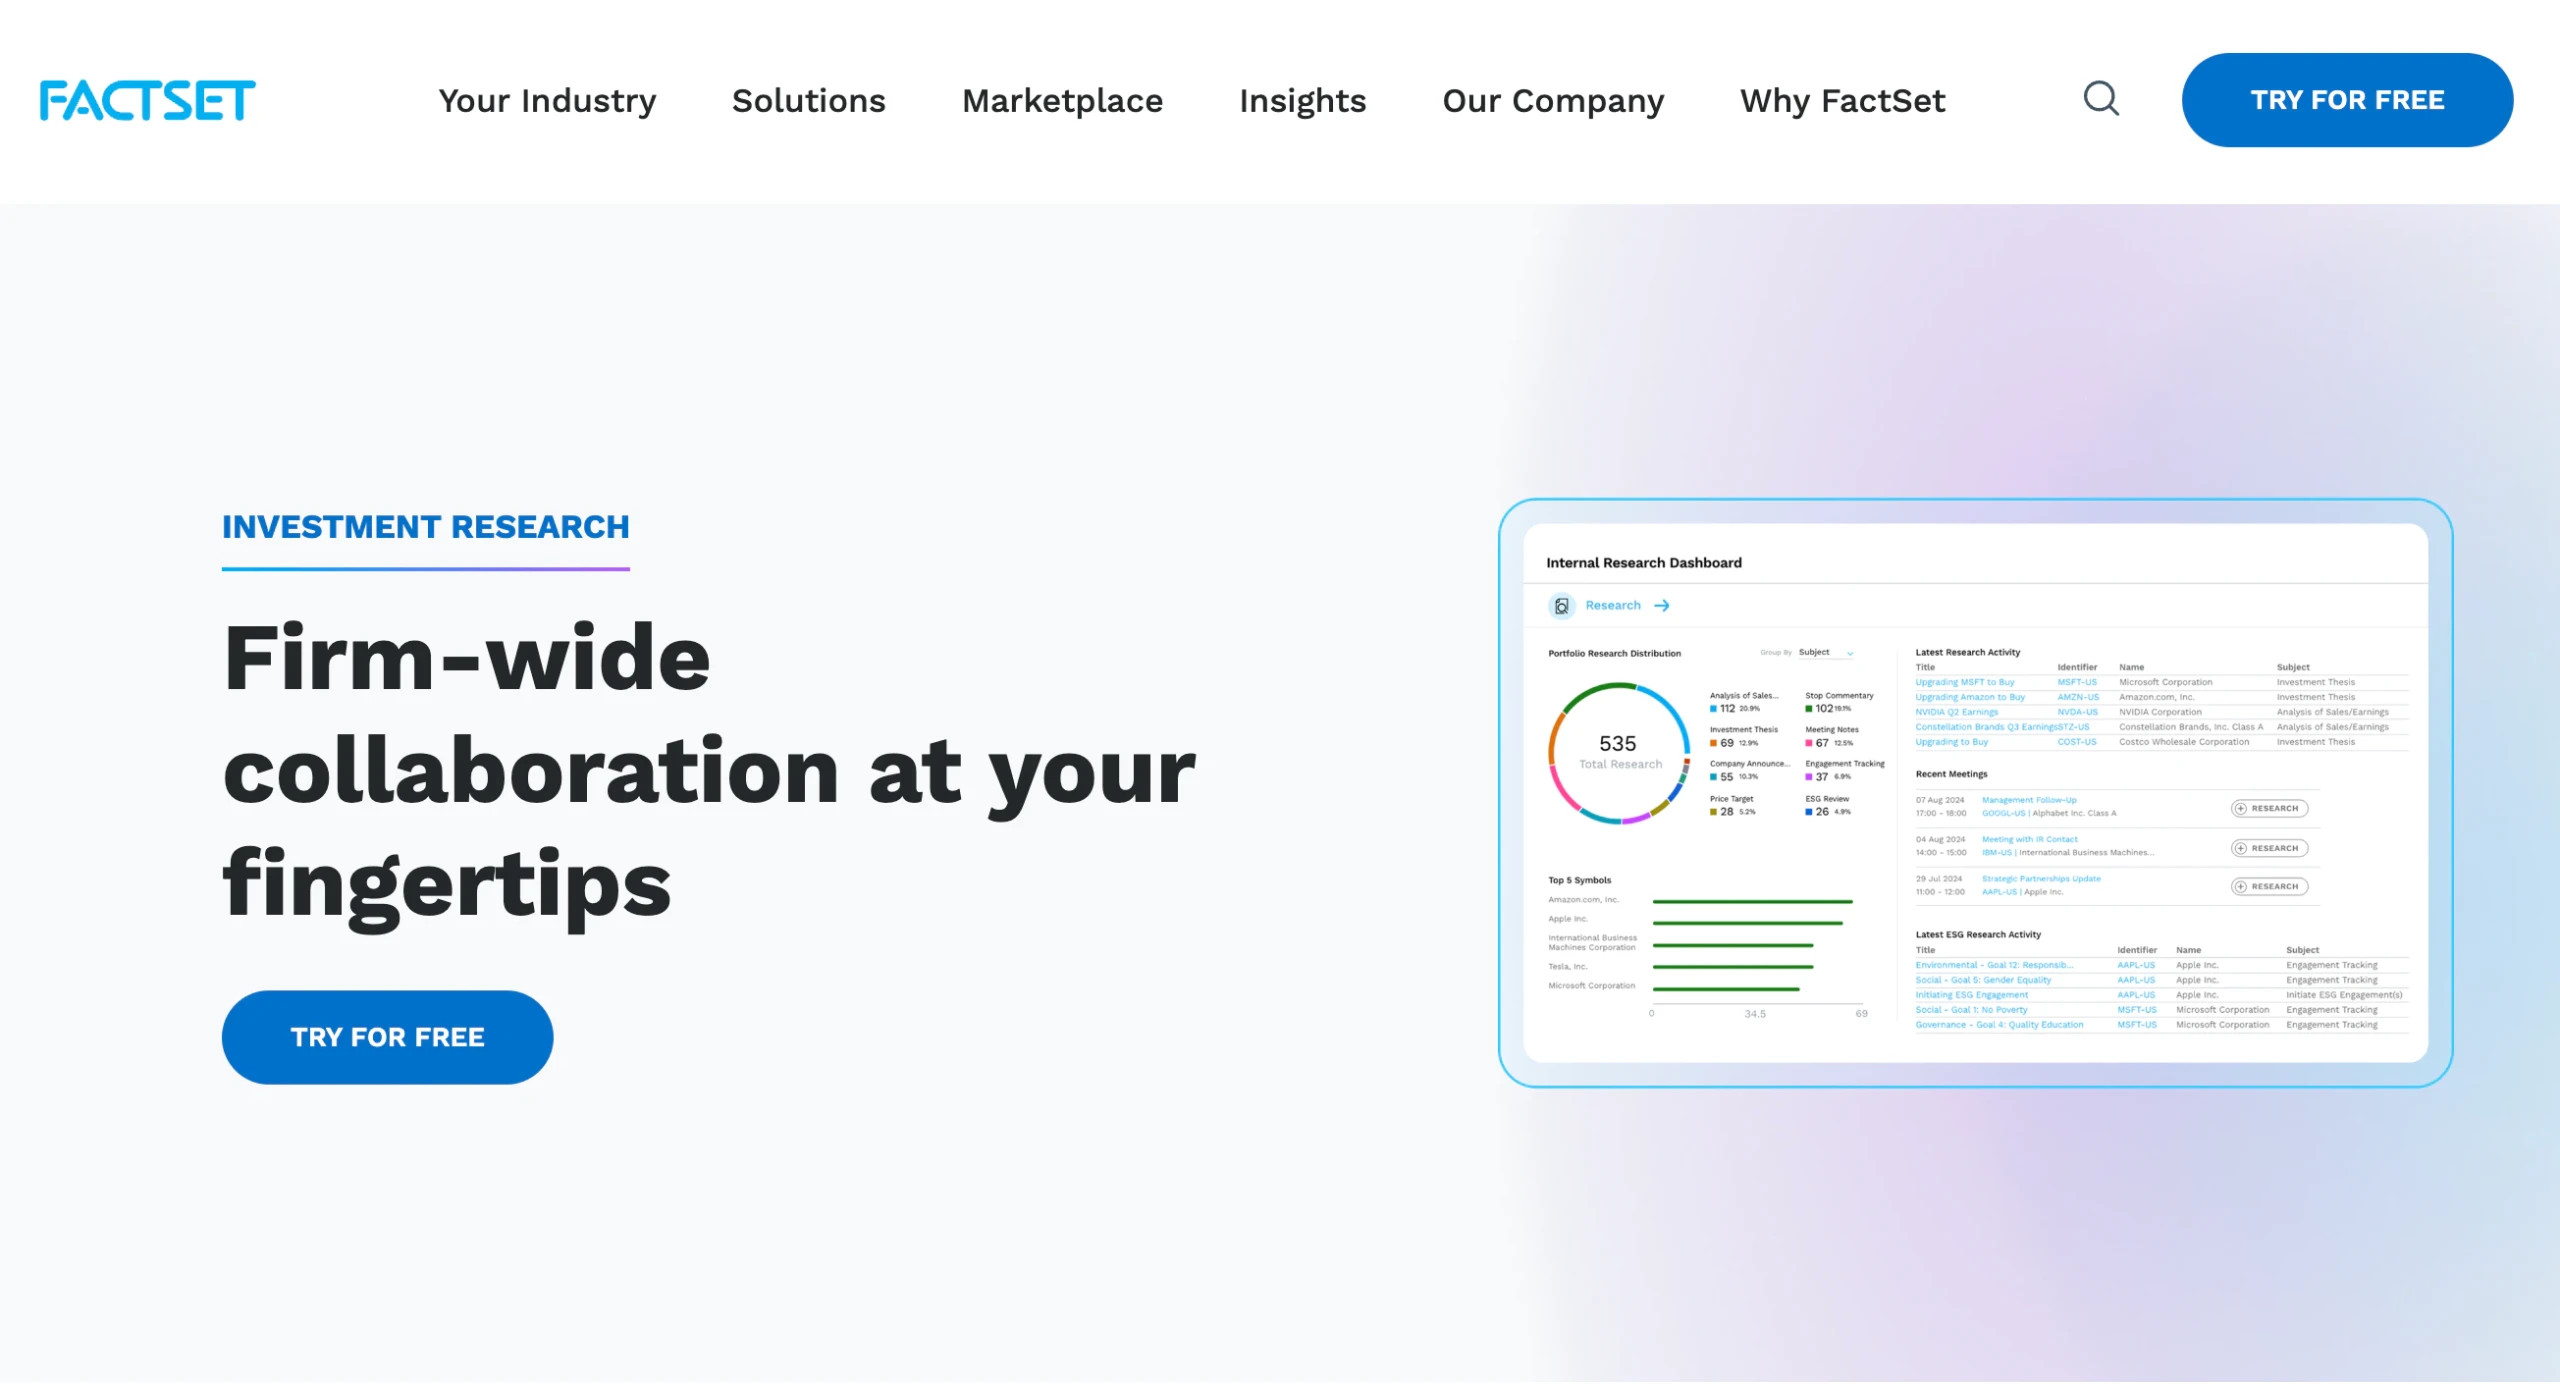
It is important to note that FactSet is primarily an expensive, paid-access product, meaning it is not the typical “free” tool for individual investors. However, for those with access through academic programs or professional institutions, it offers unmatched data integrity. It is the tool that sets the bar for what a professional analyst needs to perform an exhaustive audit of a company’s financial history.
Best Features: FactSet is positioning itself as a benchmark for professional-grade, institutional-grade data accuracy and depth.
5. SEC Edgar
SEC Edgar is the official source of truth for all public companies in the United States. It is the repository where every 10-K, 10-Q, and 8-K filing is officially submitted. If you want to verify the exact numbers, read the legal footnotes, or see the original management commentary, this is the only platform that provides 100 percent certainty.
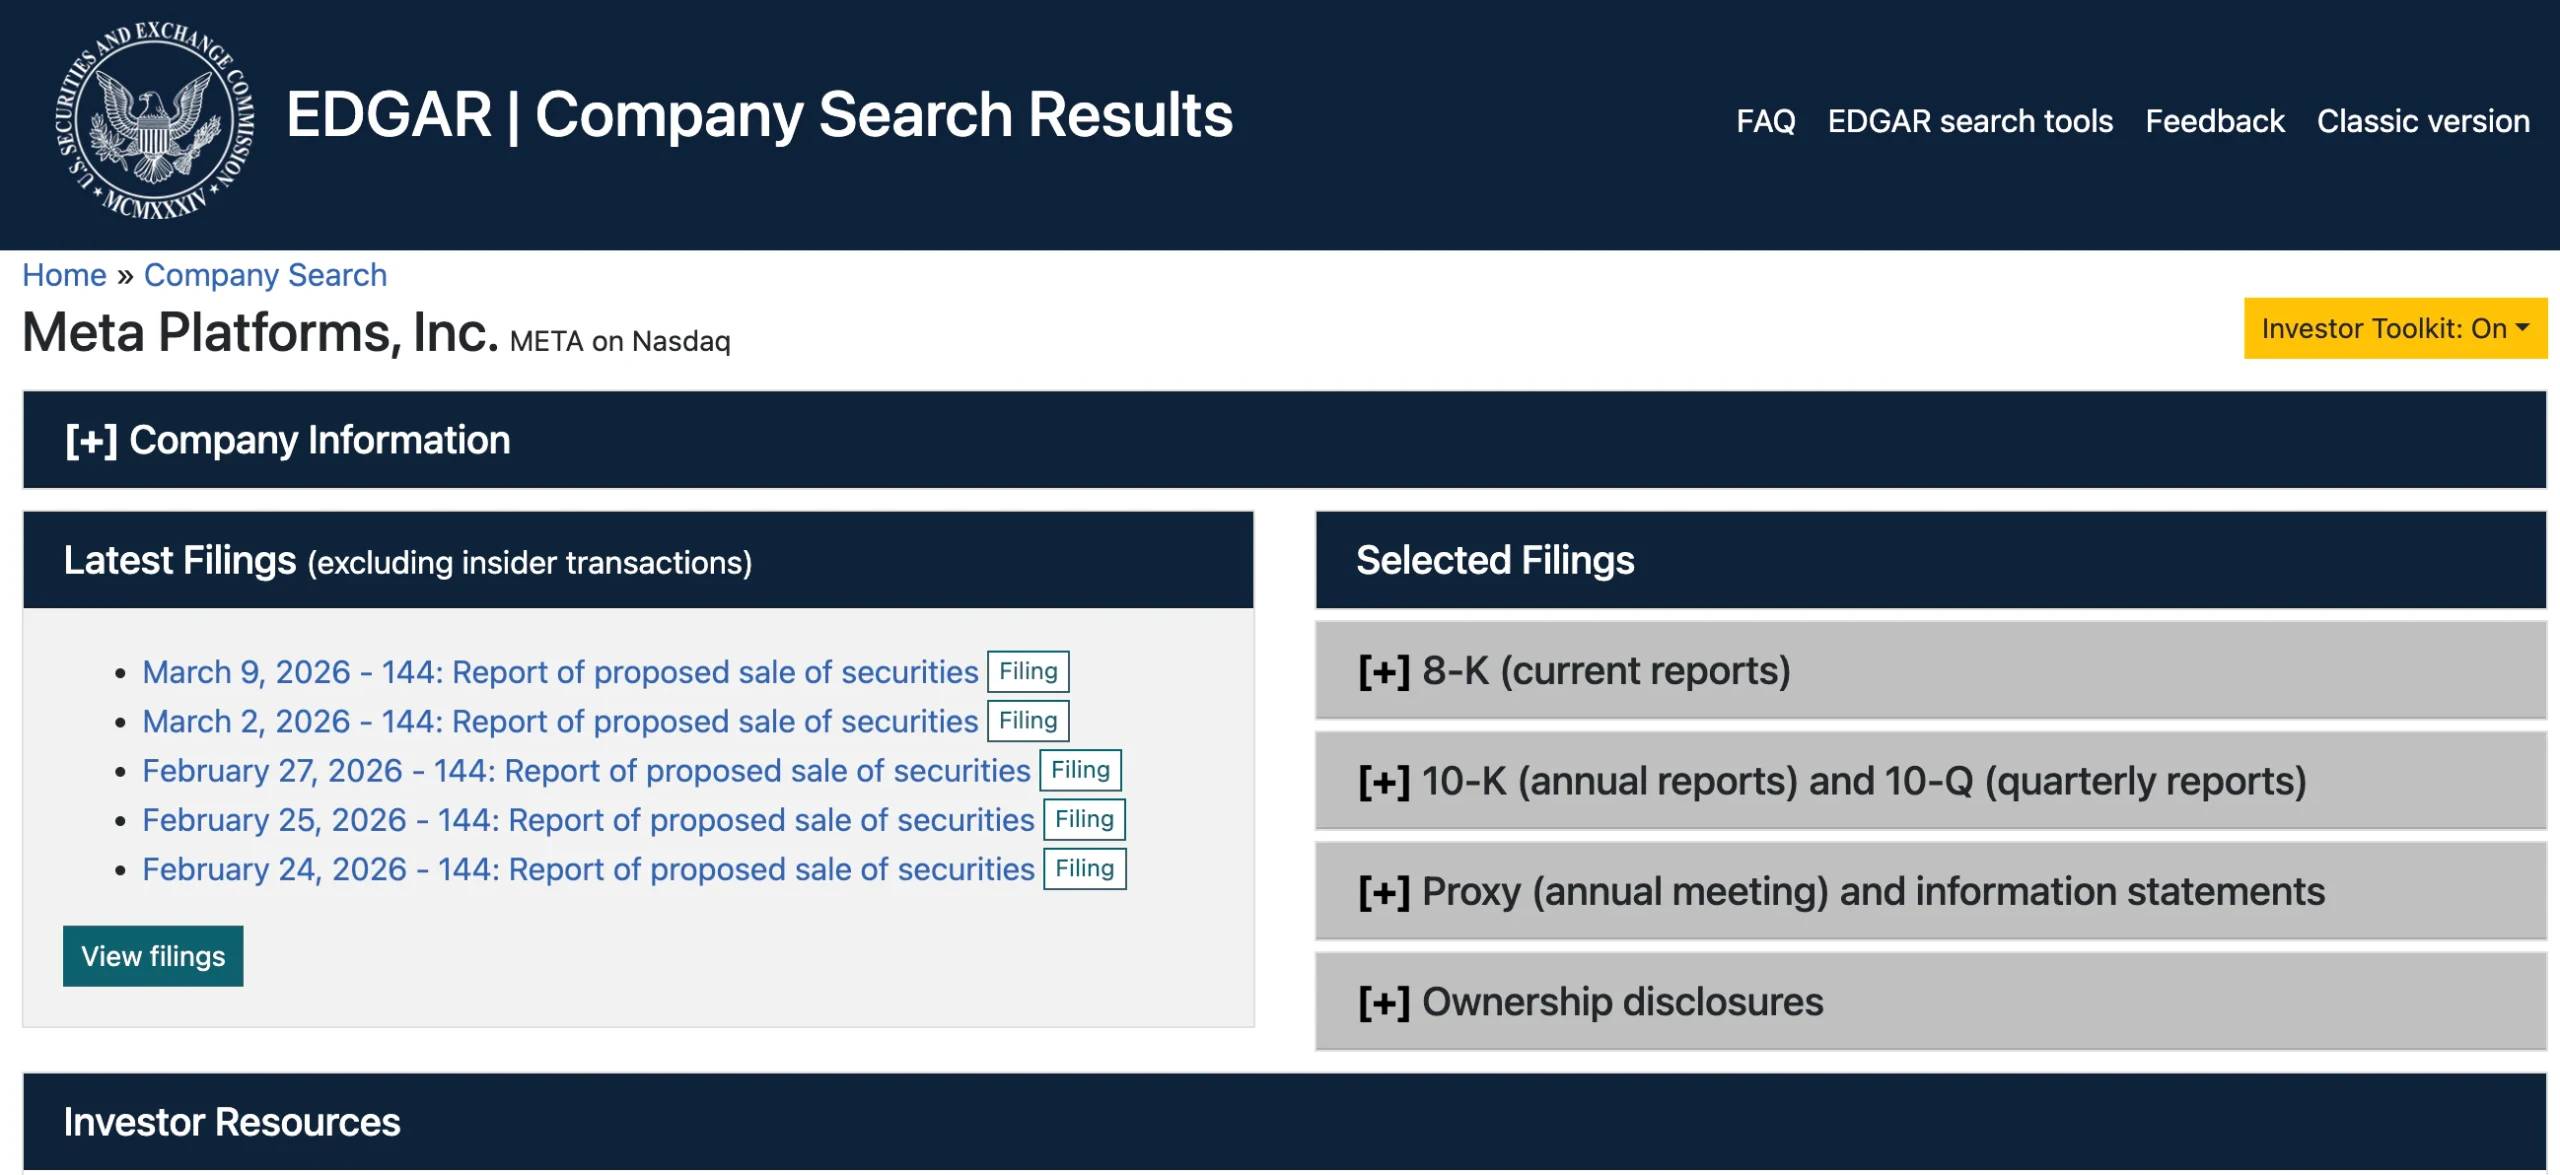
The interface is intentionally functional and lacks the bells and whistles of modern financial apps. You will not find interactive charts here, but you will find the original, unadulterated documents submitted by the companies themselves. For the serious fundamental researcher who needs to bypass third-party interpretations and analyze the source data directly, SEC Edgar remains an essential, non-negotiable tool.
Best Features: SEC Edgar serves as the official repository for all regulatory filings and is the only 100% reliable source of primary documentation.
Look at important company reports like 10-K filings for the top stocks in your portfolio (It’s free) >>>
6. Google Finance
Google Finance is the ultimate “no-frills” tool for a quick financial check. It is fast, clean, and integrates seamlessly with the broader Google ecosystem. It is perfect for an investor who is simply checking a ticker and wants to see a basic, five-year chart of revenue or income without any extra distractions or account setup requirements.
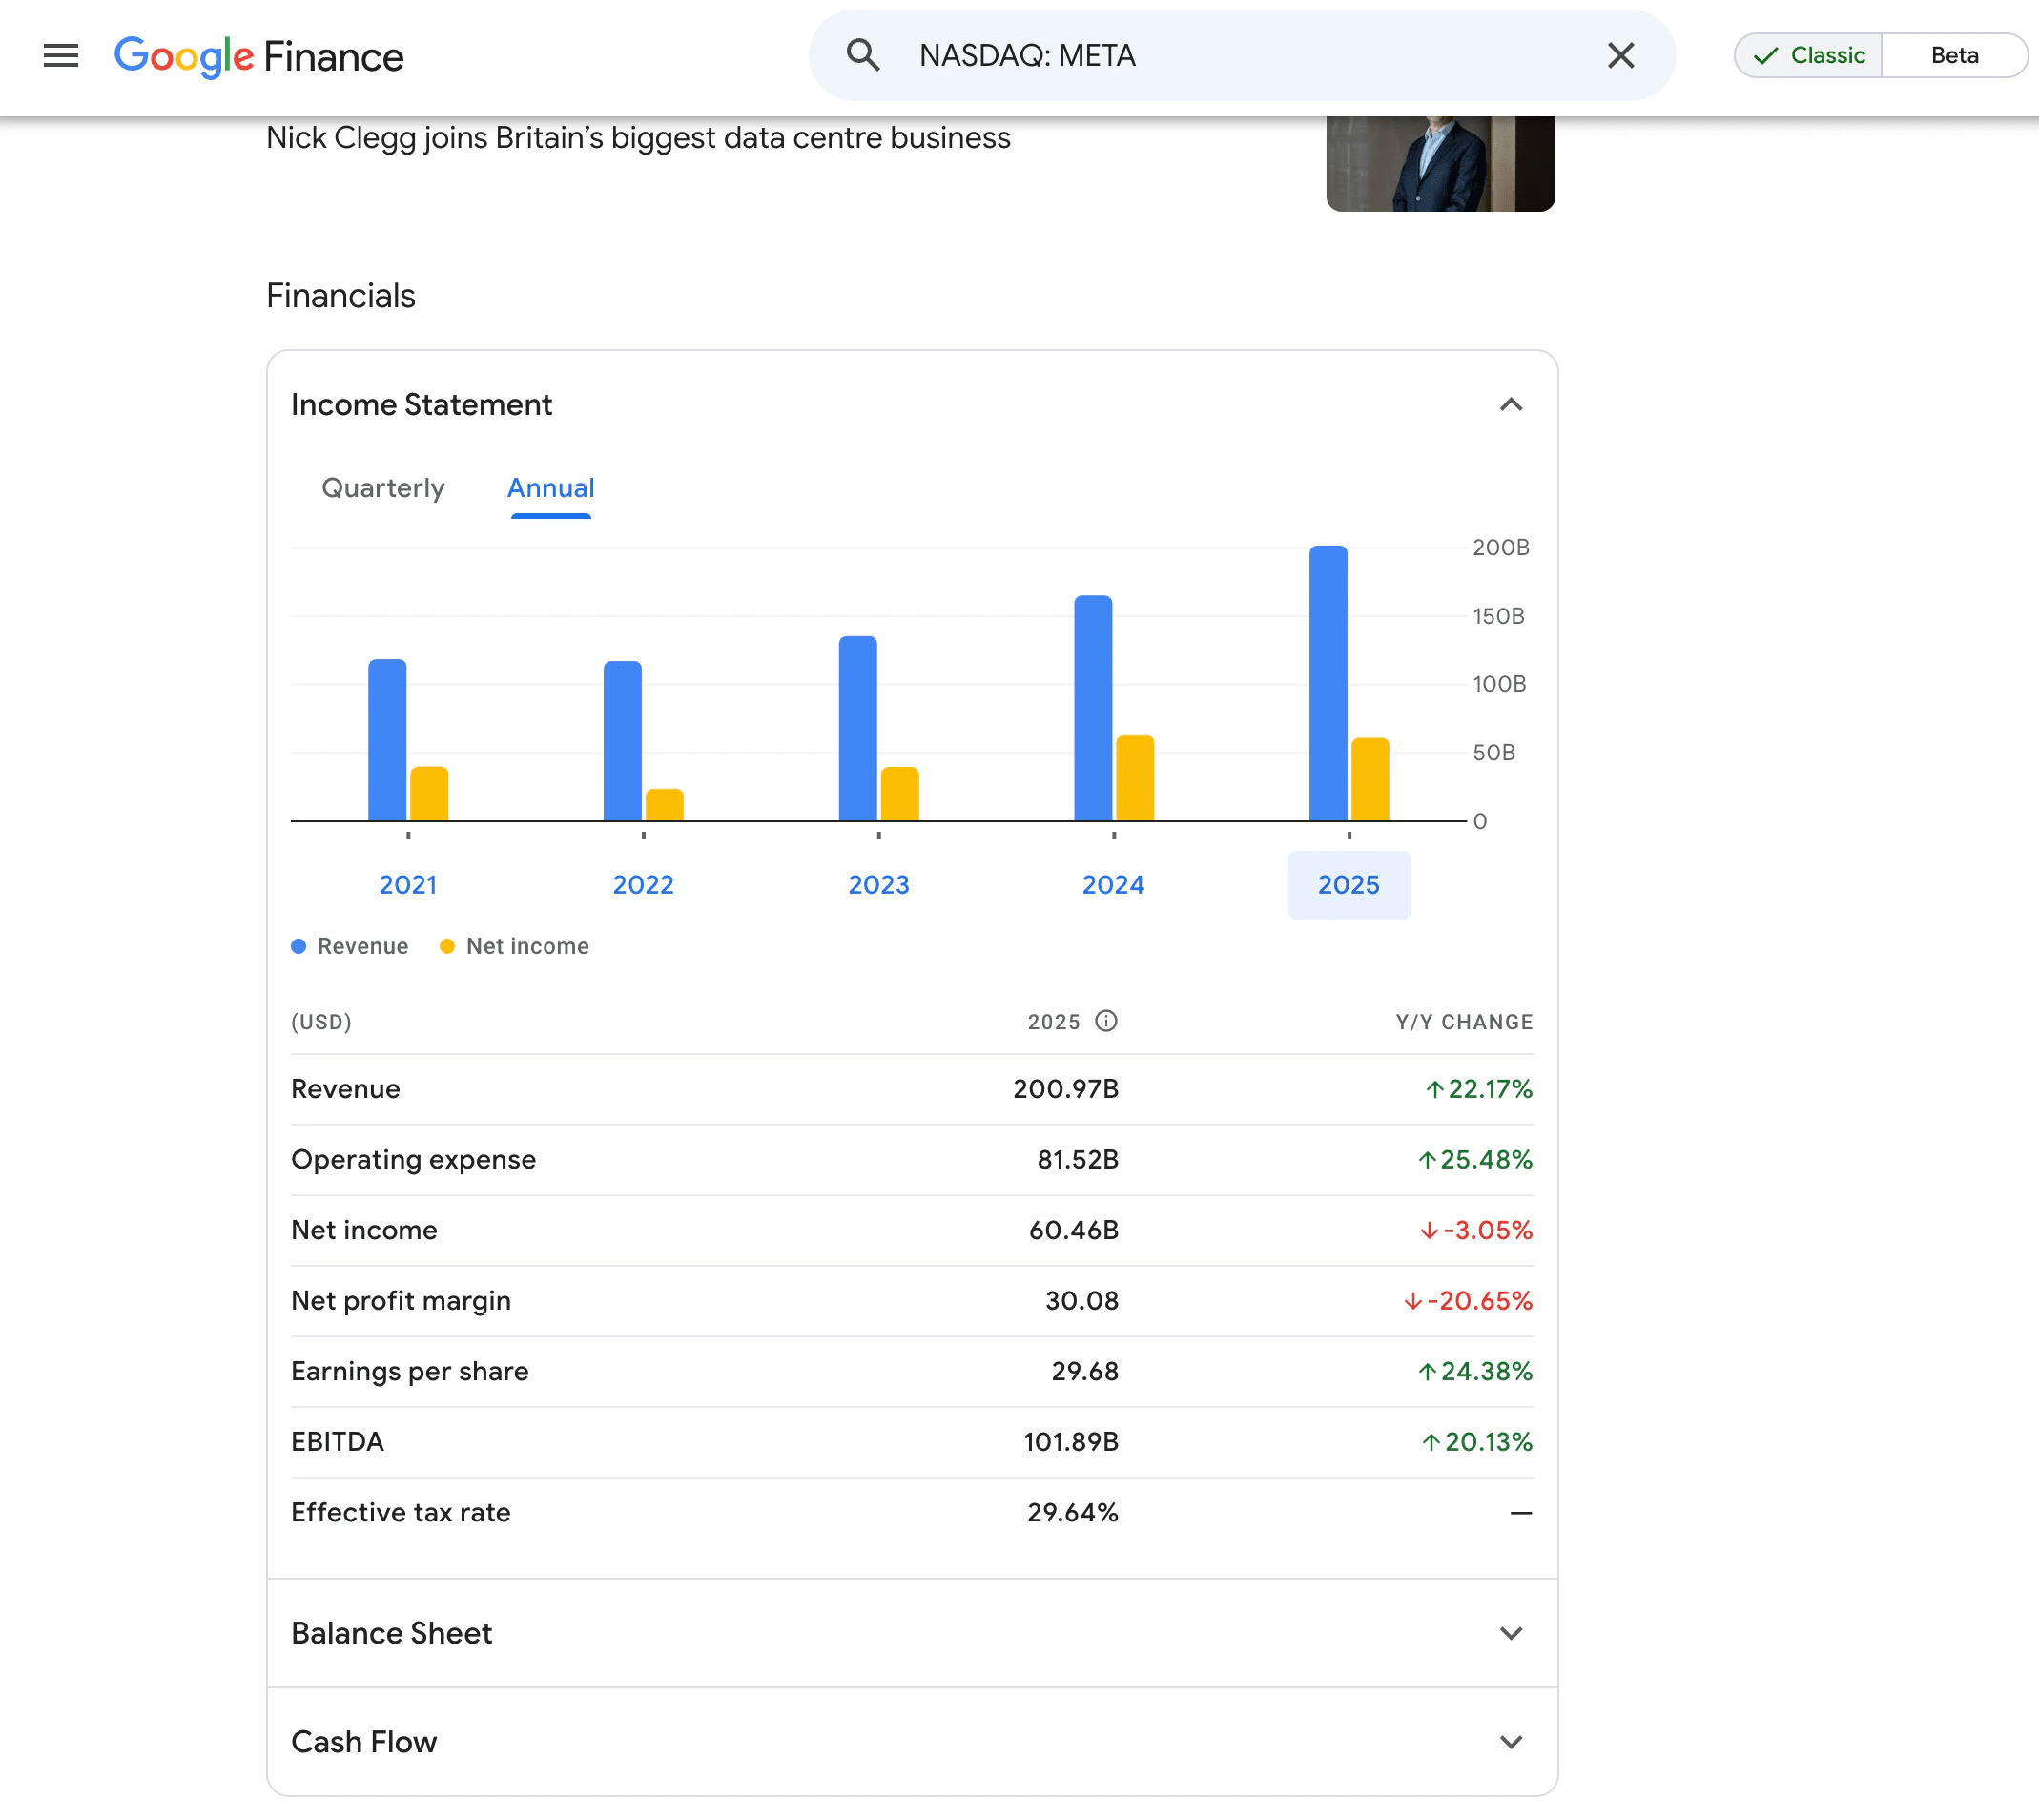
The platform is purposely limited, focusing on speed and accessibility rather than depth. It provides a simple table view of the income statement and balance sheet, which is more than enough for a surface-level look at a company’s health. For the mobile investor who needs to see the latest figures in seconds while on the move, it provides a functional, frictionless experience.
Best Features: Google Finance offers the fastest, most stripped-down interface for viewing a basic financial snapshot of a company.
TIKR Takeaway
Analyzing financial statements is not just about reading numbers; it is about uncovering the economic reality of a business. TIKR stands apart by providing a professional-grade research workflow that fuses 15 years of standardized data with the qualitative context provided by earnings transcripts. Most free tools only give you raw data, but TIKR provides context, allowing you to see the “why” behind the numbers.
By connecting financial statements directly to valuation models and peer comparisons, TIKR removes the need to juggle fragmented data sources. You can move from a broad screen to a granular audit of a balance sheet in seconds, ensuring your research is based on verifiable, high-quality information rather than superficial metrics. For the disciplined investor, TIKR is the most effective way to turn complex statements into a clear, actionable thesis.
Value Any Stock in Under 60 Seconds with TIKR
With TIKR’s new Valuation Model tool, you can estimate a stock’s potential share price in under a minute.
All it takes is three simple inputs:
- Revenue Growth
- Operating Margins
- Exit P/E Multiple
If you’re not sure what to enter, TIKR automatically fills in each input using analysts’ consensus estimates, giving you a quick, reliable starting point.
From there, TIKR calculates the potential share price and total returns under Bull, Base, and Bear scenarios so you can quickly see whether a stock looks undervalued or overvalued.
See a stock’s true value in under 60 seconds (Free with TIKR) >>>
Looking for New Opportunities?
- Discover which stocks billionaire investors are purchasing, so you can follow the smart money.
- Analyze stocks in as little as 5 minutes with TIKR’s all-in-one, easy-to-use platform.
- The more rocks you overturn… the more opportunities you’ll uncover. Search 100K+ global stocks, global top investor holdings, and more with TIKR.
Disclaimer:
Please note that the articles on TIKR are not intended to serve as investment or financial advice from TIKR or our content team, nor are they recommendations to buy or sell any stocks. We create our content based on TIKR Terminal’s investment data and analysts’ estimates. Our analysis might not include recent company news or important updates. TIKR has no position in any stocks mentioned. Thank you for reading, and happy investing!