Key Takeaways:
- Digital Transformation: Broadridge is leading innovation in tokenization, AI-powered shareholder engagement, and digital communications across capital markets.
- Price Projection: Based on current execution, BR stock could reach $241 by June 2028.
- Potential Gains: This target implies a total return of 23% from the current price of $197.
- Annual Return: Investors could see roughly 9% growth over the next 2.3 years.
Now Live: Discover how much upside your favorite stocks could have using TIKR’s new Valuation Model (It’s free)>>>
Broadridge Financial Solutions (BR) delivered strong Q2 results with 8% recurring revenue growth and raised its full-year adjusted EPS guidance to 9-12% growth.
CEO Tim Gokey highlighted accelerating technology adoption and a pro-innovation regulatory environment, creating transformational opportunities across the company’s three main business segments.
- The company’s governance business grew 9% in constant currency, driven by growth in positions and new revenue streams from shareholder engagement solutions.
- Equity position growth remained robust at 17%, with revenue positions growing 11%.
- Fund position growth strengthened to 15% in Q2 after timing headwinds in Q1.
- Beyond traditional position growth, Broadridge is capturing new revenue from innovation. Over 600 funds covering $4 trillion in assets now use the company’s voting choice solution, up from just 100 funds two years ago.
- The company launched AI-native custom policy engines for institutional investors like JPMorgan and Wells Fargo, seeking to reduce reliance on proxy advisors.
- Perhaps most significantly, Broadridge is positioning itself as the infrastructure provider for tokenized equities.
- As major exchanges and the DTCC build tokenized trading capabilities, Broadridge plans to integrate these digital assets into its proxy platform by year-end.
- This addresses a critical market need—ensuring governance complexity doesn’t inhibit adoption of tokenized securities.
- The capital markets segment grew by 6% due to strong demand for front- and back-office solutions.
- The company’s Distributed Ledger Repo platform processed $384 billion daily in December, more than double the level in June.
- Management expects to launch real-time repo capabilities incorporating stablecoins in fiscal 2026.
- Wealth management revenues jumped 11%, benefiting from organic growth and the SIS acquisition.
- The platform recently earned recognition as an industry leader from IDC, contributing to a growing pipeline of opportunities.
After a slower start, closed sales momentum picked up with Q2 sales rising 24% to $57 million. New pipeline generation increased over 20% in the first half as clients engage on tokenization, digital communications, and preparing for T+1 settlement in Europe.
See analysts’ full growth forecasts and estimates for BR stock (It’s free) >>>
What the Model Says for Broadridge Stock
We analyzed Broadridge through its position as the critical infrastructure provider for financial services transformation.
The company benefits from multiple growth drivers operating in parallel.
- Traditional position growth continues as equity ownership expands through managed accounts and democratized investing.
- Digital transformation creates entirely new revenue streams through tokenization platforms, AI-powered engagement tools, and omnichannel communications.
- Broadridge’s competitive moat comes from its scale and interconnected network.
- Nearly 80% of Fortune 500 companies use Broadridge for governance services. This network effect makes it extremely difficult for competitors to replicate the company’s reach and reliability.
Using forecasts of 5.6% annual revenue growth and 21% operating margins, our model projects the stock will rise to $241 within 2.3 years. This assumes a 19.3x price-to-earnings multiple.
That represents compression from Broadridge’s historical averages of 25.3x (one year) and 24.4x (five years). The lower multiple accounts for near-term uncertainty as new revenue streams from tokenization and AI scale up.
The real value lies in capturing long-term structural shifts in how financial markets operate while maintaining the stable recurring revenue base from traditional services.
Our Valuation Assumptions

Estimate a company’s fair value instantly (Free with TIKR) >>>
Our Valuation Assumptions
TIKR’s Valuation Model lets you plug in your own assumptions for a company’s revenue growth, operating margins, and P/E multiple, and calculates the stock’s expected returns.
Here’s what we used for BR stock:
1. Revenue Growth: 5.6%
Broadridge’s growth comes from both traditional and emerging sources.
The company delivered 8% constant currency recurring revenue growth in Q2, driven by position growth, sales execution, and new digital offerings.
Management expects recurring revenue growth at the higher end of 5-7% guidance for fiscal 2026.
Position growth remains healthy with mid-to-high single-digit fund positions and high single-digit equity revenue positions expected in the second half.
New revenue streams are emerging faster than expected.
Event-driven revenues hit a record $204 million in the first half.
Digital asset revenues contributed 1 point to capital markets growth. Management is using elevated event revenues to accelerate investments in tokenization, AI, and digital communications.
2. Operating margins: 21%
Broadridge targets 20-21% adjusted operating income margins for fiscal 2026.
The company balances margin expansion with strategic investments in high-growth initiatives.
Strong recurring revenue growth and operational leverage support margin improvement.
However, management deliberately reinvests windfall profits from event-driven activity into product development and infrastructure.
3. Exit P/E Multiple: 19.3x
The market currently values Broadridge at 20.3x earnings. We assume modest compression to 19.3x over our forecast period as new revenue streams prove out.
This conservative approach acknowledges execution risk in scaling tokenization platforms and AI solutions.
As these initiatives demonstrate revenue traction and Broadridge solidifies its role in next-generation market infrastructure, the multiple should stabilize or expand.
The company’s consistent track record of meeting three-year objectives supports a premium valuation.
This will be the fifth consecutive three-year period where Broadridge delivers on guidance.
Build your own Valuation Model to value any stock (It’s free!) >>>
What Happens If Things Go Better or Worse?
Financial technology companies face both adoption cycles and competitive threats. Here’s how Broadridge stock might perform under different scenarios through June 2030:
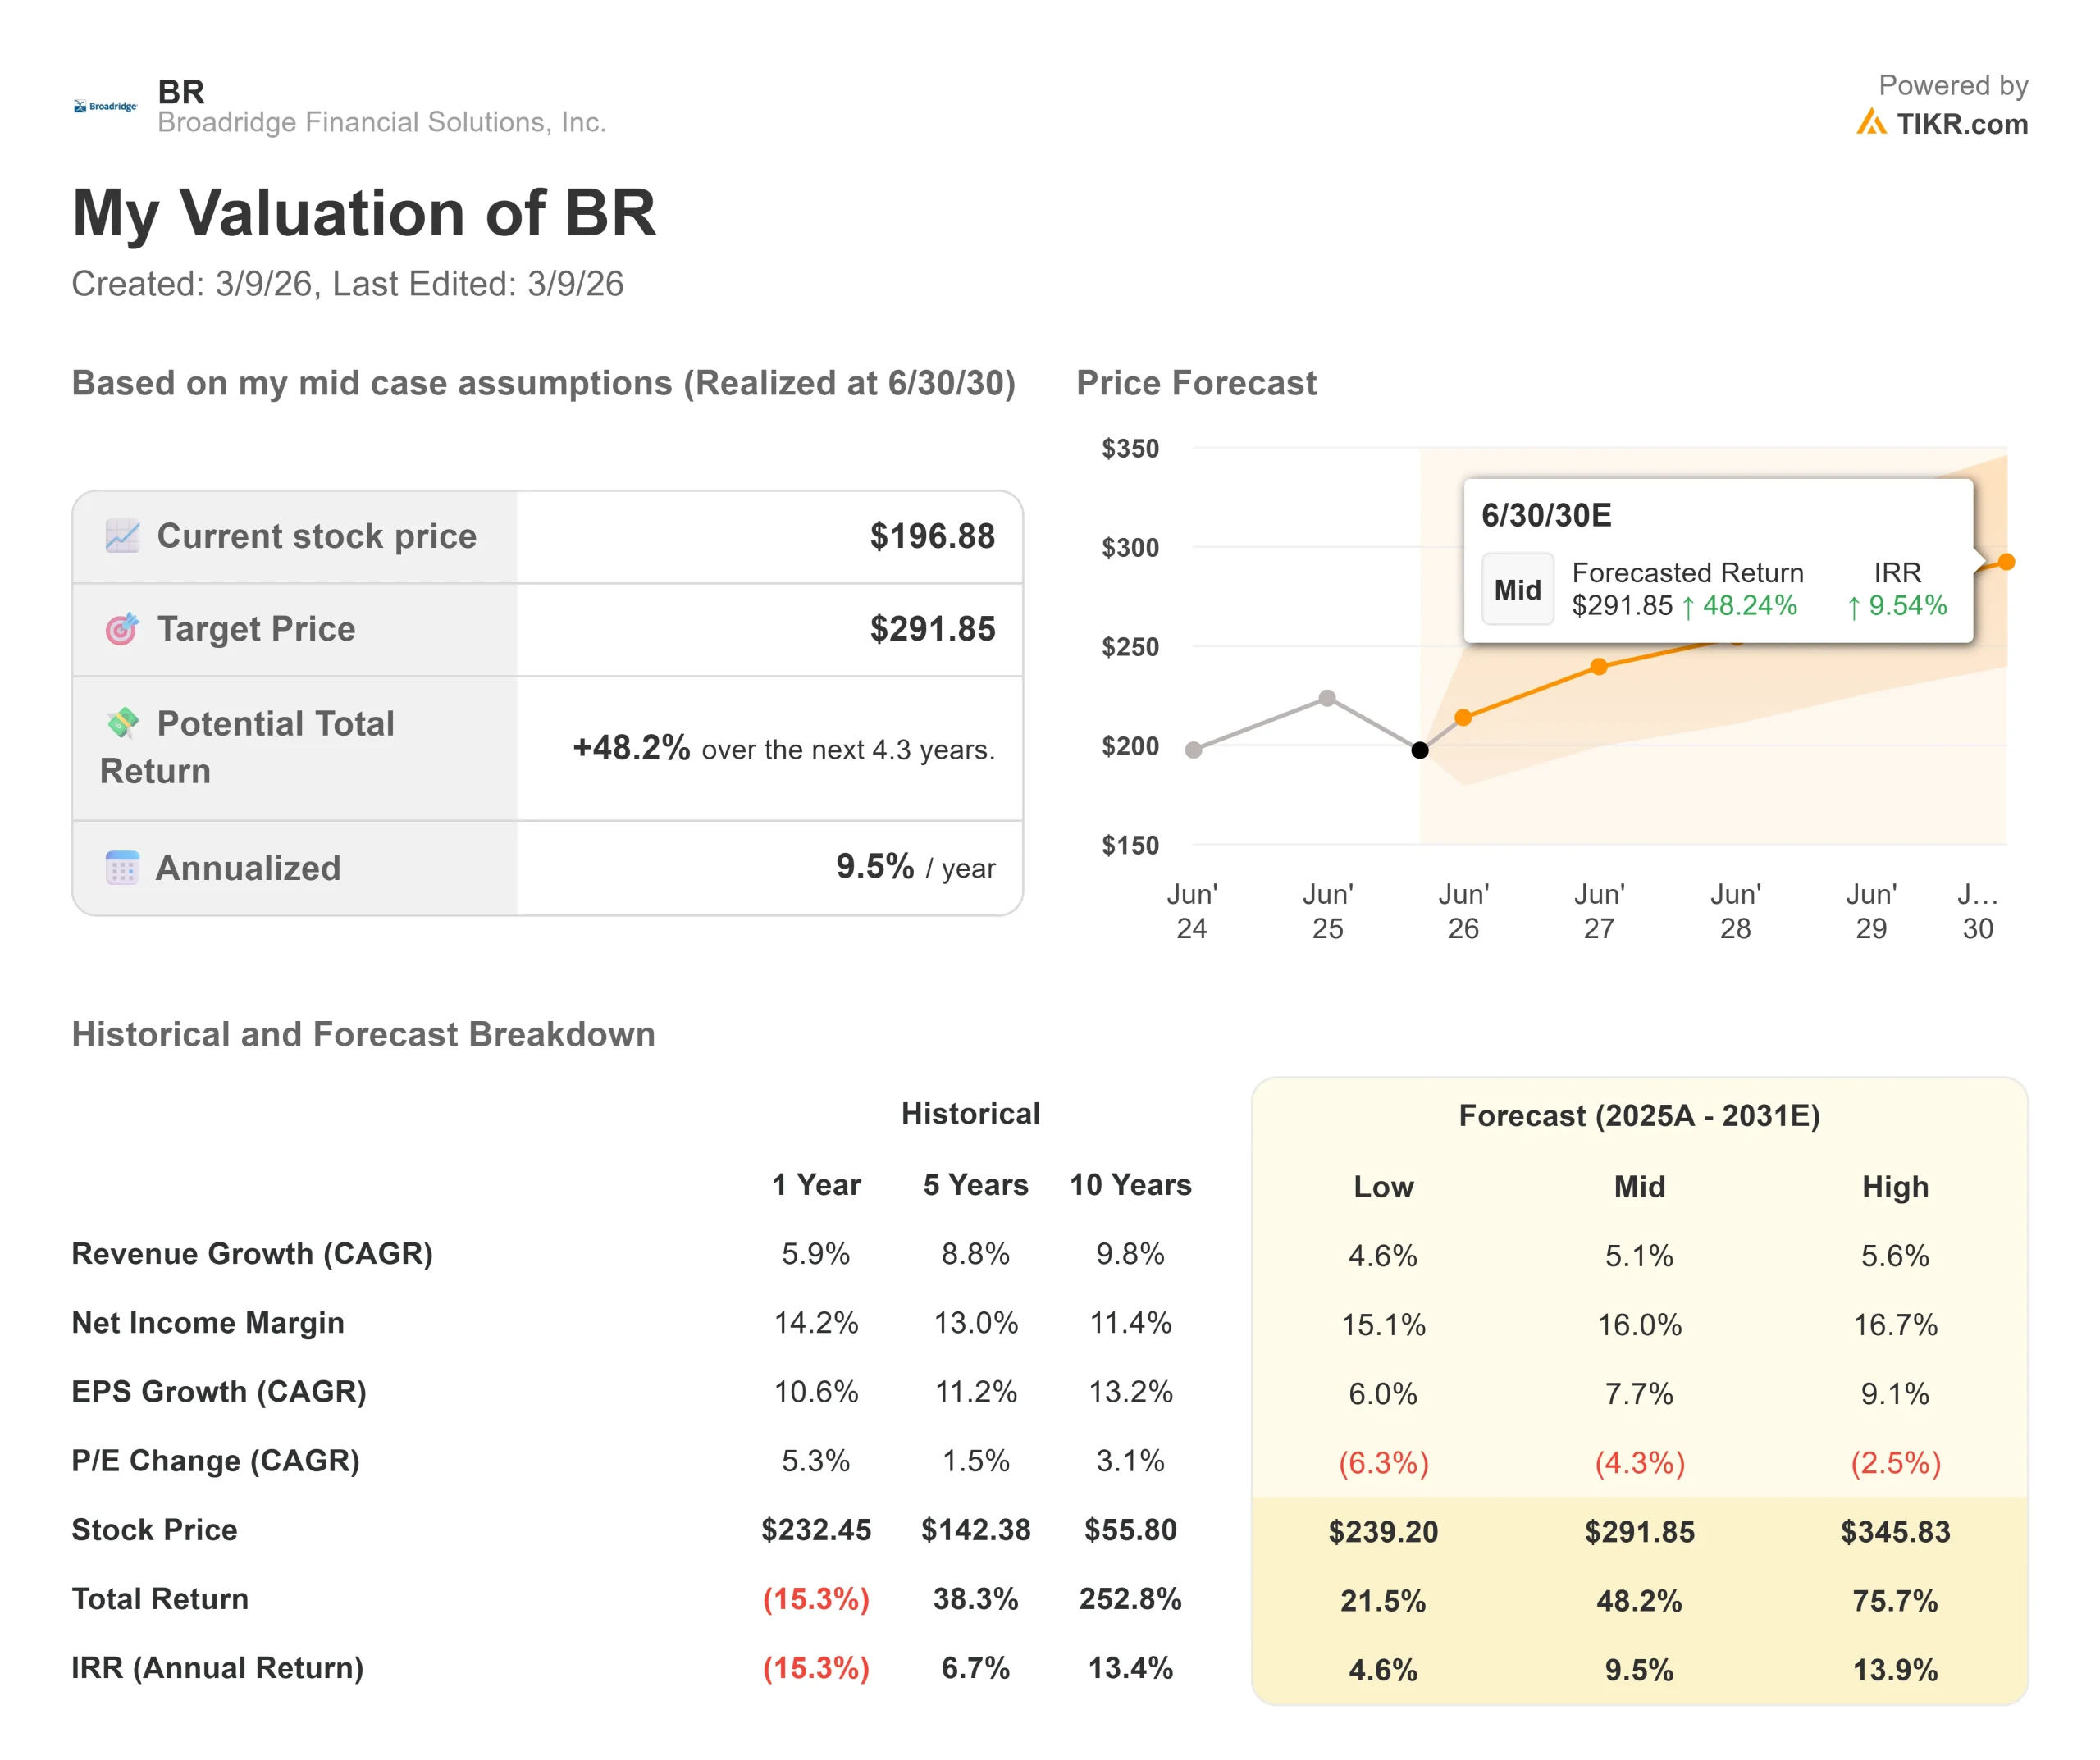
- Low Case: If revenue growth slows to 4.6% and net income margins compress to 15.1%, investors still see a 21.5% total return (4.6% annually).
- Mid Case: With 5.1% growth and 16% margins, we expect a total return of 48.2% (9.5% annually).
- High Case: If digital transformation accelerates with 5.6% revenue growth and Broadridge maintains 16.7% margins, returns could hit 75.7% total (13.9% annually).
See what analysts think about BR stock right now (Free with TIKR) >>>
The range reflects execution on tokenization adoption, success in capturing AI-driven engagement revenue, and the company’s ability to scale new platforms while protecting its core business.
How Much Upside Does Broadridge Stock Have From Here?
With TIKR’s new Valuation Model tool, you can estimate a stock’s potential share price in under a minute.
All it takes is three simple inputs:
- Revenue Growth
- Operating Margins
- Exit P/E Multiple
If you’re not sure what to enter, TIKR automatically fills in each input using analysts’ consensus estimates, giving you a quick, reliable starting point.
From there, TIKR calculates the potential share price and total returns under Bull, Base, and Bear scenarios so you can quickly see whether a stock looks undervalued or overvalued.
See a stock’s true value in under 60 seconds (Free with TIKR) >>>
Looking for New Opportunities?
- See what stocks billionaire investors are buying so you can follow the smart money.
- Analyze stocks in as little as 5 minutes with TIKR’s all-in-one, easy-to-use platform.
- The more rocks you overturn… the more opportunities you’ll uncover. Search 100K+ global stocks, global top investor holdings, and more with TIKR.
Disclaimer:
Please note that the articles on TIKR are not intended to serve as investment or financial advice from TIKR or our content team, nor are they recommendations to buy or sell any stocks. We create our content based on TIKR Terminal’s investment data and analysts’ estimates. Our analysis might not include recent company news or important updates. TIKR has no position in any stocks mentioned. Thank you for reading, and happy investing!