
Key Takeaways:
- Strategic Position: Over 95% of revenue comes from proprietary benchmarks and differentiated data that can’t be easily replicated.
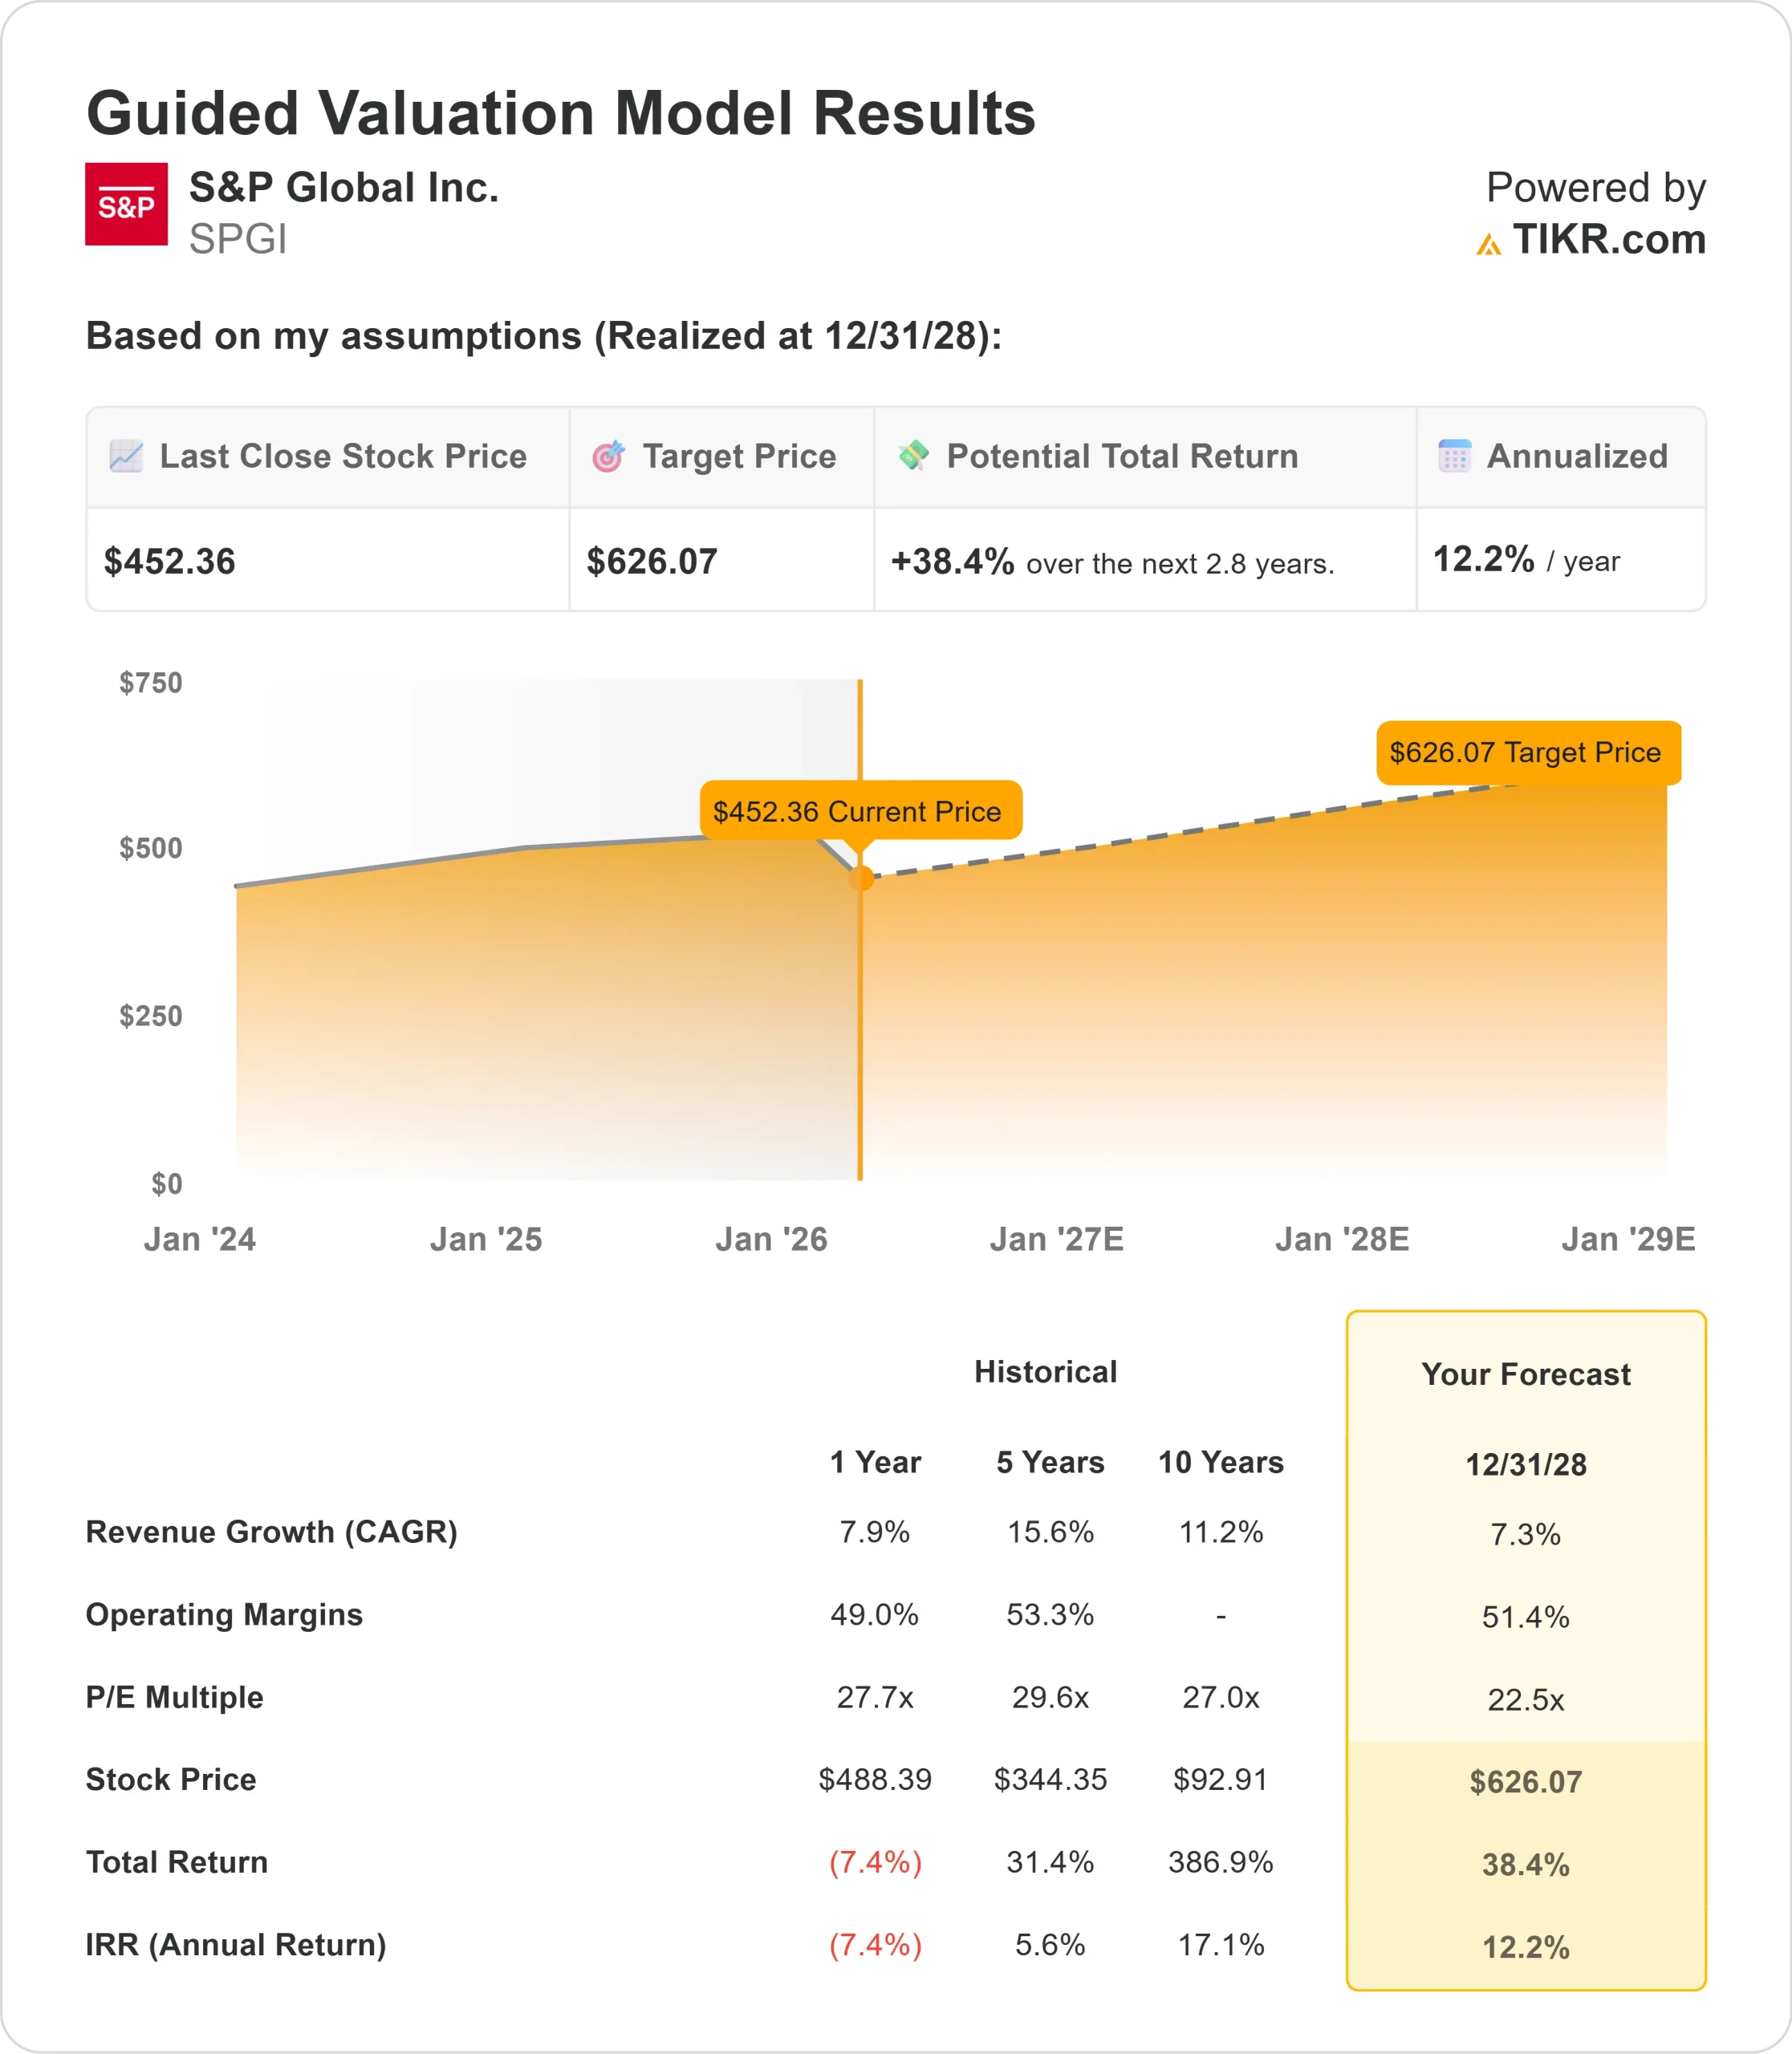
- Price Projection: Based on current execution, SPGI stock could reach $626 by December 2028.
- Potential Gains: This target implies a total return of 38% from the current price of $452.
- Annual Return: Investors could see roughly 12% growth over the next 2.8 years.
Now Live: Discover how much upside your favorite stocks could have using TIKR’s new Valuation Model (It’s free)>>>
S&P Global Inc. (SPGI) delivered exceptional results in 2025, posting strong revenue growth, meaningful margin expansion, and 14% EPS growth.
The company exceeded its initial guidance on all key metrics while returning 113% of adjusted free cash flow to shareholders through dividends and over $5 billion in stock repurchases.
CEO Martina Cheung emphasized the company’s strategic vision of “Advancing Essential Intelligence” during the fourth quarter earnings call.
- The company continues to benefit from its position as a leading provider of proprietary benchmarks, differentiated data, and critical workflow tools across its four main divisions: Market Intelligence, Ratings, Energy, and Indices.
- Market Intelligence grew subscription revenue 7% in the quarter, demonstrating the health of its core business.
- The division integrated with Intelligence in under six weeks, linking 75% of fund manager data within a month and generating over 200 cross-sell opportunities within 60 days.
- While volume-driven products saw some softness in Q4, the subscription base remains robust.
- Ratings posted 12% revenue growth driven by strong debt issuance volumes.
- The company saw balanced growth across transaction and non-transaction revenue streams.
- However, a shift toward investment-grade issuance over bank loans created a gap between 28% growth in billed issuance and 12% growth in transaction revenue, due to different monetization rates.
For 2026, management expects billed issuance to grow in the low-to-mid single digits.
This assumes refinancing of 2026 maturities without massive pull-forward from 2027-2028, modest M&A growth, and continued but measured debt issuance from hyperscalers investing in AI infrastructure.
The 2026 maturity wall shows 12% higher maturities than the prior year, with a stable mix of high-yield versus investment-grade.
The Energy division grew 6% despite sanctions creating a $3 million headwind.
Strong demand for Price Assessments and differentiated research drove growth, though consulting and events revenue remained soft. The company expects to lap sanctions impacts by Q3 2026.
Indices delivered 14% revenue growth with strength across all business lines. Asset-linked fees grew 13% from equity market appreciation and net inflows, while exchange-traded derivatives volumes jumped 20%.
See analysts’ full growth forecasts and estimates for SPGI stock (It’s free) >>>
What the Model Says for S&P Global Stock
We analyzed S&P Global’s position as the world’s leading provider of essential intelligence across financial markets, energy, and corporate data.
The company benefits from powerful network effects and high switching costs embedded in its mission-critical workflows.
Management’s enterprise initiatives are driving meaningful productivity gains. The Enterprise Data Office reduced manual data processing by over 50% in 2025 and is on track to cut run-rate expenses by more than 20% by the end of 2027.
The Chief Client Office is deepening relationships with strategic customers, creating both revenue opportunities and early insight into customer needs.
AI investments are paying off across the business.
- The company deployed AI capabilities in every division, from Document Intelligence in Market Intelligence to energy research integration with Microsoft Copilot.
- Nearly 20% of iLEVEL customers adopted the AI-powered Automated Data Ingestion tool within six months of launch.
Using a forecast of 7.3% annual revenue growth and 51.4% operating margins, our model projects the stock will rise to $626 within 2.8 years. This assumes a 22.5x price-to-earnings multiple.
That represents compression from S&P Global’s historical P/E averages of 27.7x (one year) and 29.6x (five years). The lower multiple reflects a prudent approach to 2026 given market uncertainty, though the company enters the year with strong momentum in subscription businesses and encouraging market indicators.
The real value lies in the company’s unmatched position providing proprietary benchmarks and data that become more valuable as AI adoption accelerates.
Customers consistently emphasize they want fewer vendors and deeper partnerships with comprehensive providers like S&P Global.
Our Valuation Assumptions
Estimate a company’s fair value instantly (Free with TIKR) >>>
Our Valuation Assumptions
TIKR’s Valuation Model lets you plug in your own assumptions for a company’s revenue growth, operating margins, and P/E multiple, and calculates the stock’s expected returns.
Here’s what we used for SPGI stock:
1. Revenue Growth: 7.3%
S&P Global’s growth is anchored by subscription businesses that comprise the majority of revenue.
Market Intelligence subscription revenue grew 7% in Q4, with Annual Contract Value growth accelerating to 6.5-7% for two consecutive quarters.
Management guides to 6-8% organic constant currency revenue growth for 2026.
Market Intelligence is expected to grow 5.5-7% with subscription revenue at the top half of that range.
Ratings should grow 4-7% assuming low to mid-single digit billed issuance growth.
Energy is projected at 5.5-7% growth, while Indices targets 10-12% growth.
2. Operating margins: 51.4%
For 2026, S&P Global expects to expand margins by 50 to 75 basis points Excluding the contributions from OSTTRA divestiture in 2025.
Including the impact of the OSTTRA divestiture, S&P Global would expect adjusted operating margins to expand by 10 to 35 basis points.
This reflects ongoing productivity initiatives through the Enterprise Data Office, software engineering improvements, and AI-driven efficiencies, while continuing to invest in strategic growth areas like private markets and AI capabilities.
3. Exit P/E Multiple: 22.5x
The market currently values S&P Global at 23.1x earnings. We assume modest compression to 22.5x over our forecast period, below historical averages of 27.6x (one year) and 29.6x (five years).
This conservative multiple accounts for near-term market uncertainty and the planned spin of the Mobility business.
As the company demonstrates continued execution on its strategic vision and AI investments drive accelerating growth, the valuation gap to historical levels should narrow.
Build your own Valuation Model to value any stock (It’s free!) >>>
What Happens If Things Go Better or Worse?
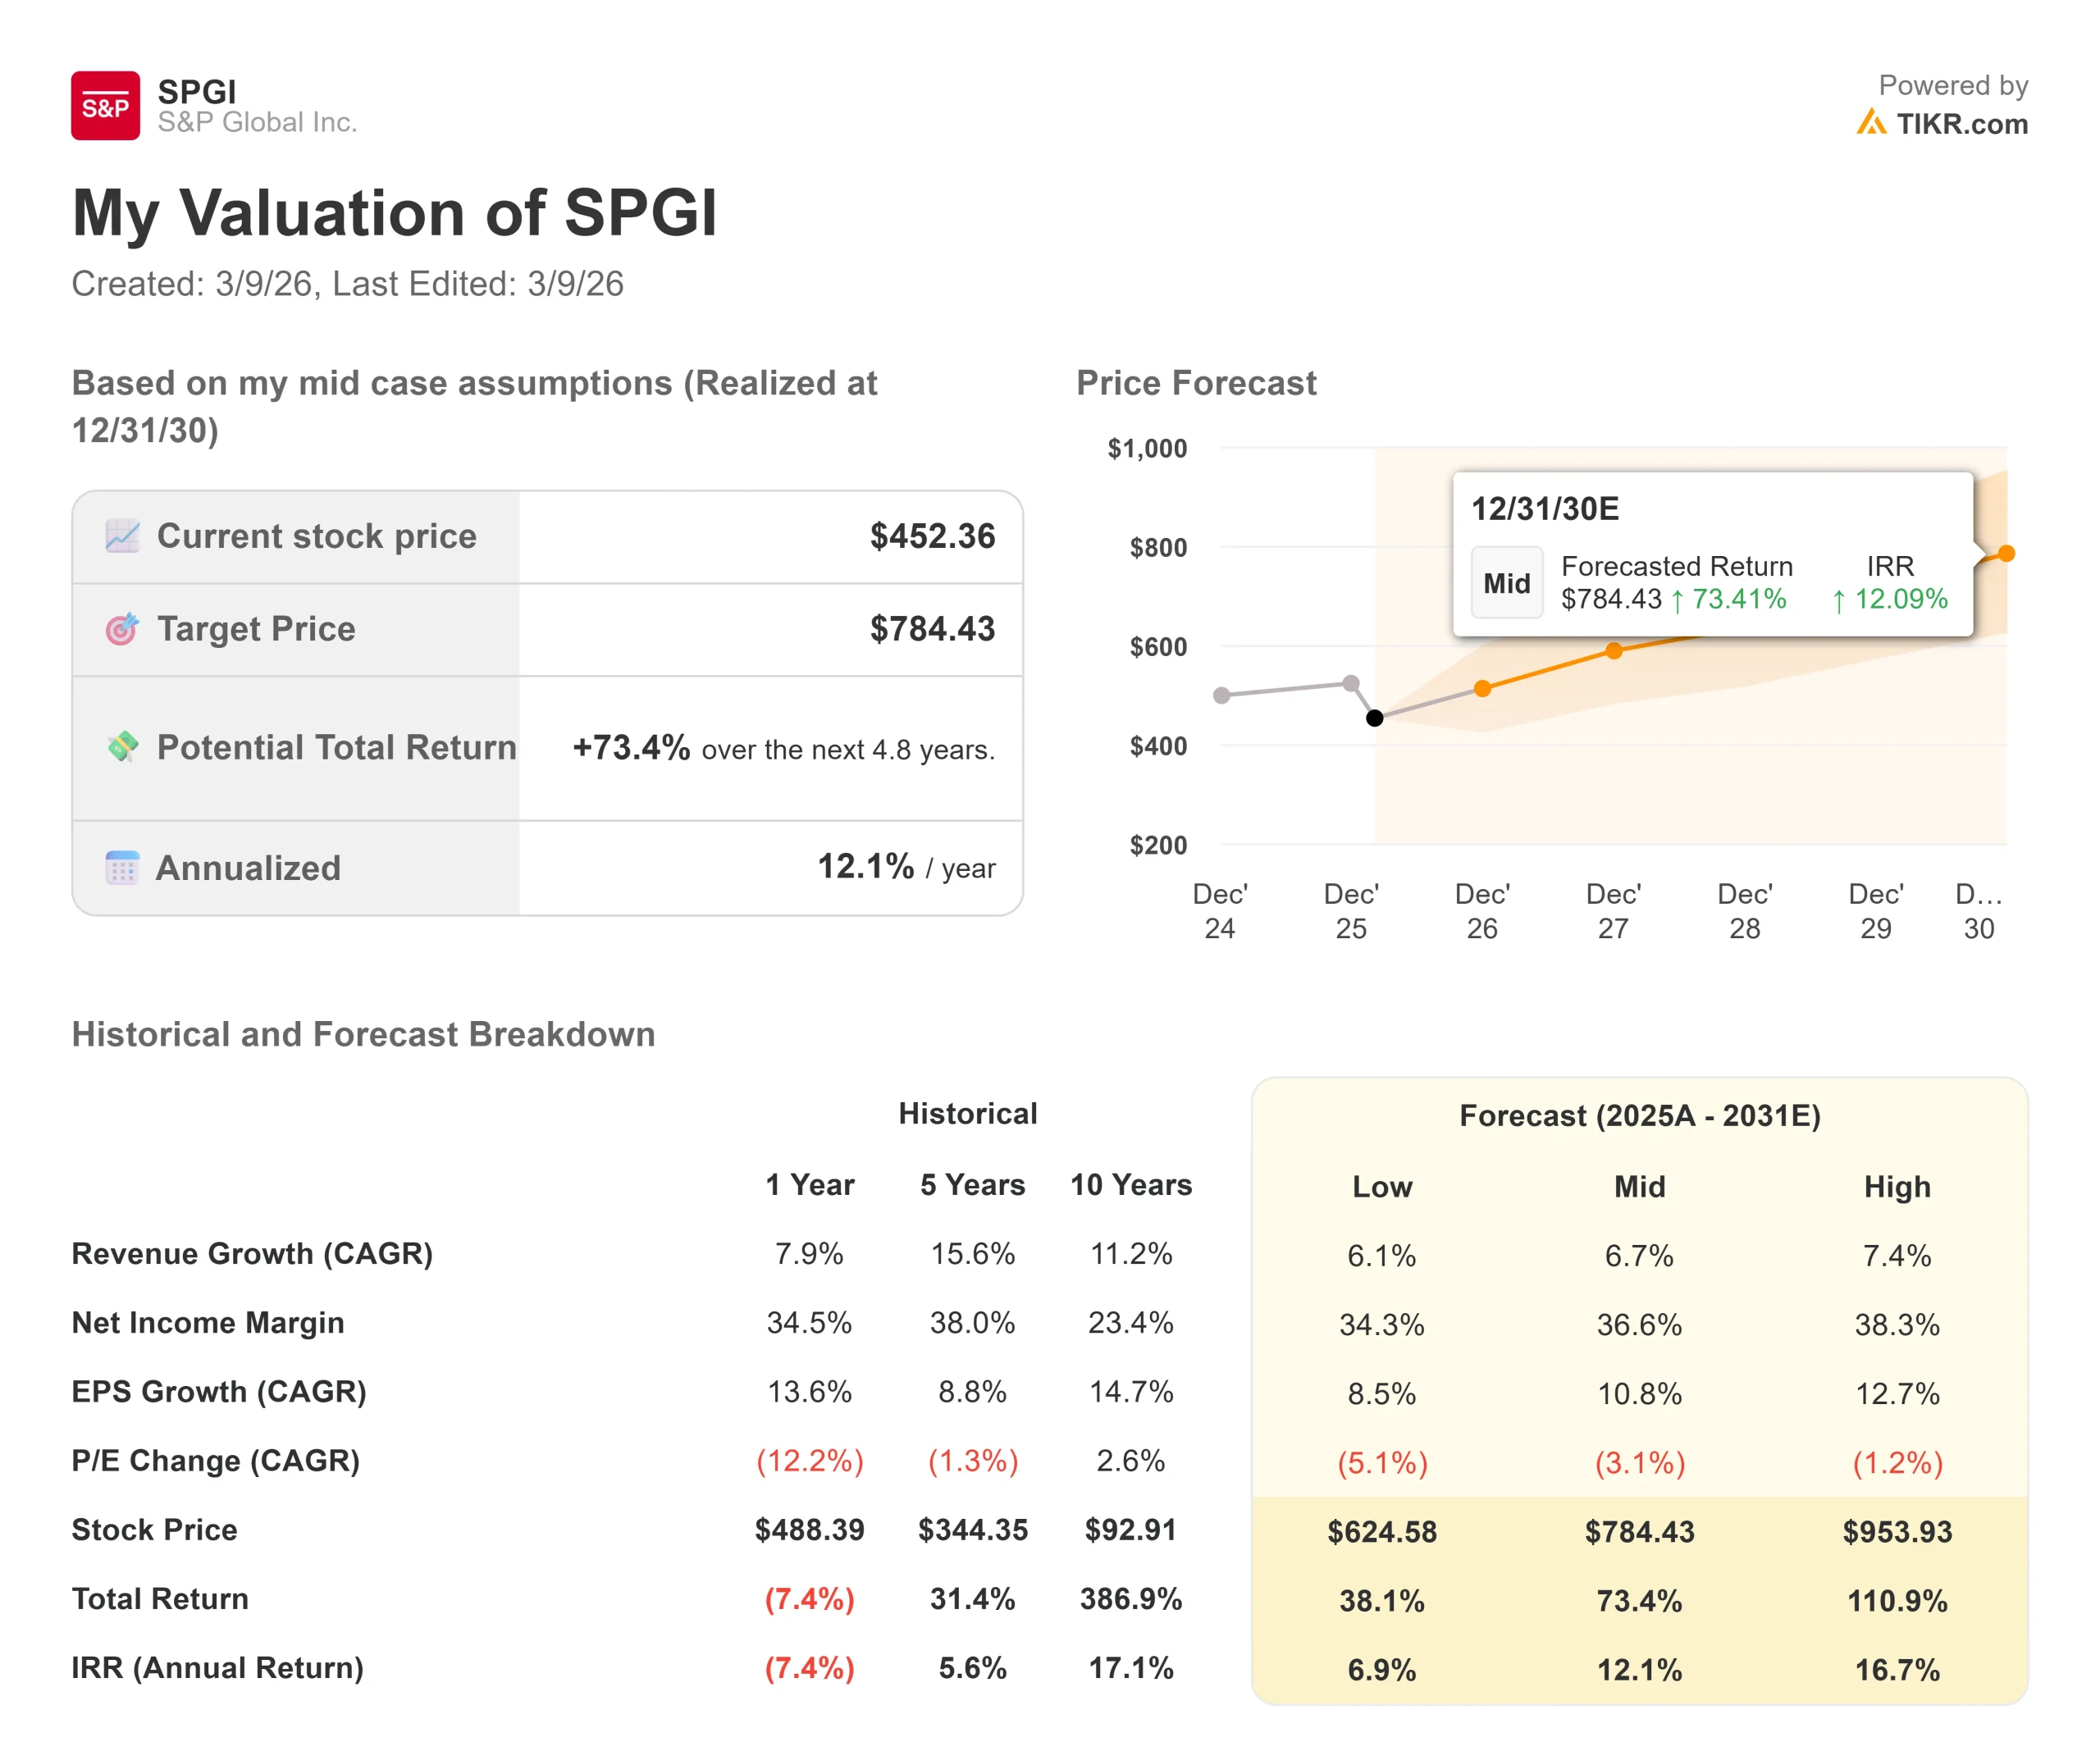
S&P Global’s diversified revenue model provides resilience, though market-driven businesses face cyclical pressures. Here’s how the stock might perform under different scenarios through December 2030:
- Low Case: If revenue growth slows to 6.1% and net income margins compress to 34.3%, investors still see a 38.1% total return (6.9% annually).
- Mid Case: With 6.7% growth and 36.6% margins, we expect a total return of 73.4% (12.1% annually).
- High Case: If strategic initiatives drive 7.4% revenue growth while S&P Global maintains 38.3% margins, returns could hit 110.9% total (16.7% annually).
See what analysts think about SPGI stock right now (Free with TIKR) >>>
The range reflects execution on AI integration, success in private markets expansion, and the company’s ability to navigate market volatility while maintaining pricing power in its essential intelligence offerings.
How Much Upside Does S&P Global Stock Have From Here?
With TIKR’s new Valuation Model tool, you can estimate a stock’s potential share price in under a minute.
All it takes is three simple inputs:
- Revenue Growth
- Operating Margins
- Exit P/E Multiple
If you’re not sure what to enter, TIKR automatically fills in each input using analysts’ consensus estimates, giving you a quick, reliable starting point.
From there, TIKR calculates the potential share price and total returns under Bull, Base, and Bear scenarios so you can quickly see whether a stock looks undervalued or overvalued.
See a stock’s true value in under 60 seconds (Free with TIKR) >>>
Looking for New Opportunities?
- See what stocks billionaire investors are buying so you can follow the smart money.
- Analyze stocks in as little as 5 minutes with TIKR’s all-in-one, easy-to-use platform.
- The more rocks you overturn… the more opportunities you’ll uncover. Search 100K+ global stocks, global top investor holdings, and more with TIKR.
Disclaimer:
Please note that the articles on TIKR are not intended to serve as investment or financial advice from TIKR or our content team, nor are they recommendations to buy or sell any stocks. We create our content based on TIKR Terminal’s investment data and analysts’ estimates. Our analysis might not include recent company news or important updates. TIKR has no position in any stocks mentioned. Thank you for reading, and happy investing!