
Key Takeaways:
- Delta generated $63.4 billion in 2025 revenue with an operating margin of around 9%, guided for roughly 20% earnings growth in 2026, and has held its full-year forecast despite macro uncertainty. Premium ticket revenue grew 14% in Q1 2026.
- United posted a record $59.1 billion in 2025 revenue, grew adjusted EPS to $10.62, and reported Q1 2026 revenue up nearly 11% year over year, with premium revenue up 14% and loyalty revenue up 13% in the same quarter.
- Delta trades at roughly 12x forward earnings with a street target of around $79. United trades at roughly 10x with no visible street target in the TIKR data, though analysts expect EPS to nearly double from 2026 to 2027.
Now Live: Discover how much upside your favorite stocks could have using TIKR’s new Valuation Model (It’s free)>>>
These two airlines were written off for dead not long ago, buried under pandemic losses and grounded fleets. The recovery since then has been one of the more impressive financial turnarounds in recent memory, and both companies have emerged structurally different from what they were in 2019.
The question right now is which one the market is pricing more favorably, and whether the premium Delta has historically commanded still makes sense given how aggressively United has been executing.
Premium Cabins, Loyalty Programs, and the Race to the Top of the Plane
At first glance, Delta (DAL) and United (UAL) look nearly identical as investments: large legacy carriers with global route networks, strong loyalty programs, and growing premium cabin revenue. The business model differences are real, but they are more subtle than dramatic.
Delta has spent years building what CEO Ed Bastian describes as a “premium-led” strategy, in which first-class, Delta One, and premium economy cabins now account for nearly 60% of total revenue, alongside loyalty income. The model leans into higher-income travelers who keep flying regardless of what is happening to the broader consumer. Bastian was direct about this on the Q1 call, noting that Delta’s customer base simply does not live at the lower end of the economic curve where pressure is building.
United has been running a parallel playbook, just louder about it. The airline hit a record 27.4 million premium seats flown in 2025, representing 12% of all seats, and has been rolling out new premium cabin products, including the United Polaris Studio suite on its 787-9 fleet. CEO Scott Kirby’s framing is similar: win brand-loyal customers by giving them meaningfully better products and then monetize that loyalty through MileagePlus.

The distinction that still matters is operational consistency. Delta has a long track record of running a reliable network and protecting margins through disruptions. United’s execution has improved materially over the past three years, but the perception gap with Delta has not fully closed, and that still shows up in the multiples.
The Numbers Behind the Recovery
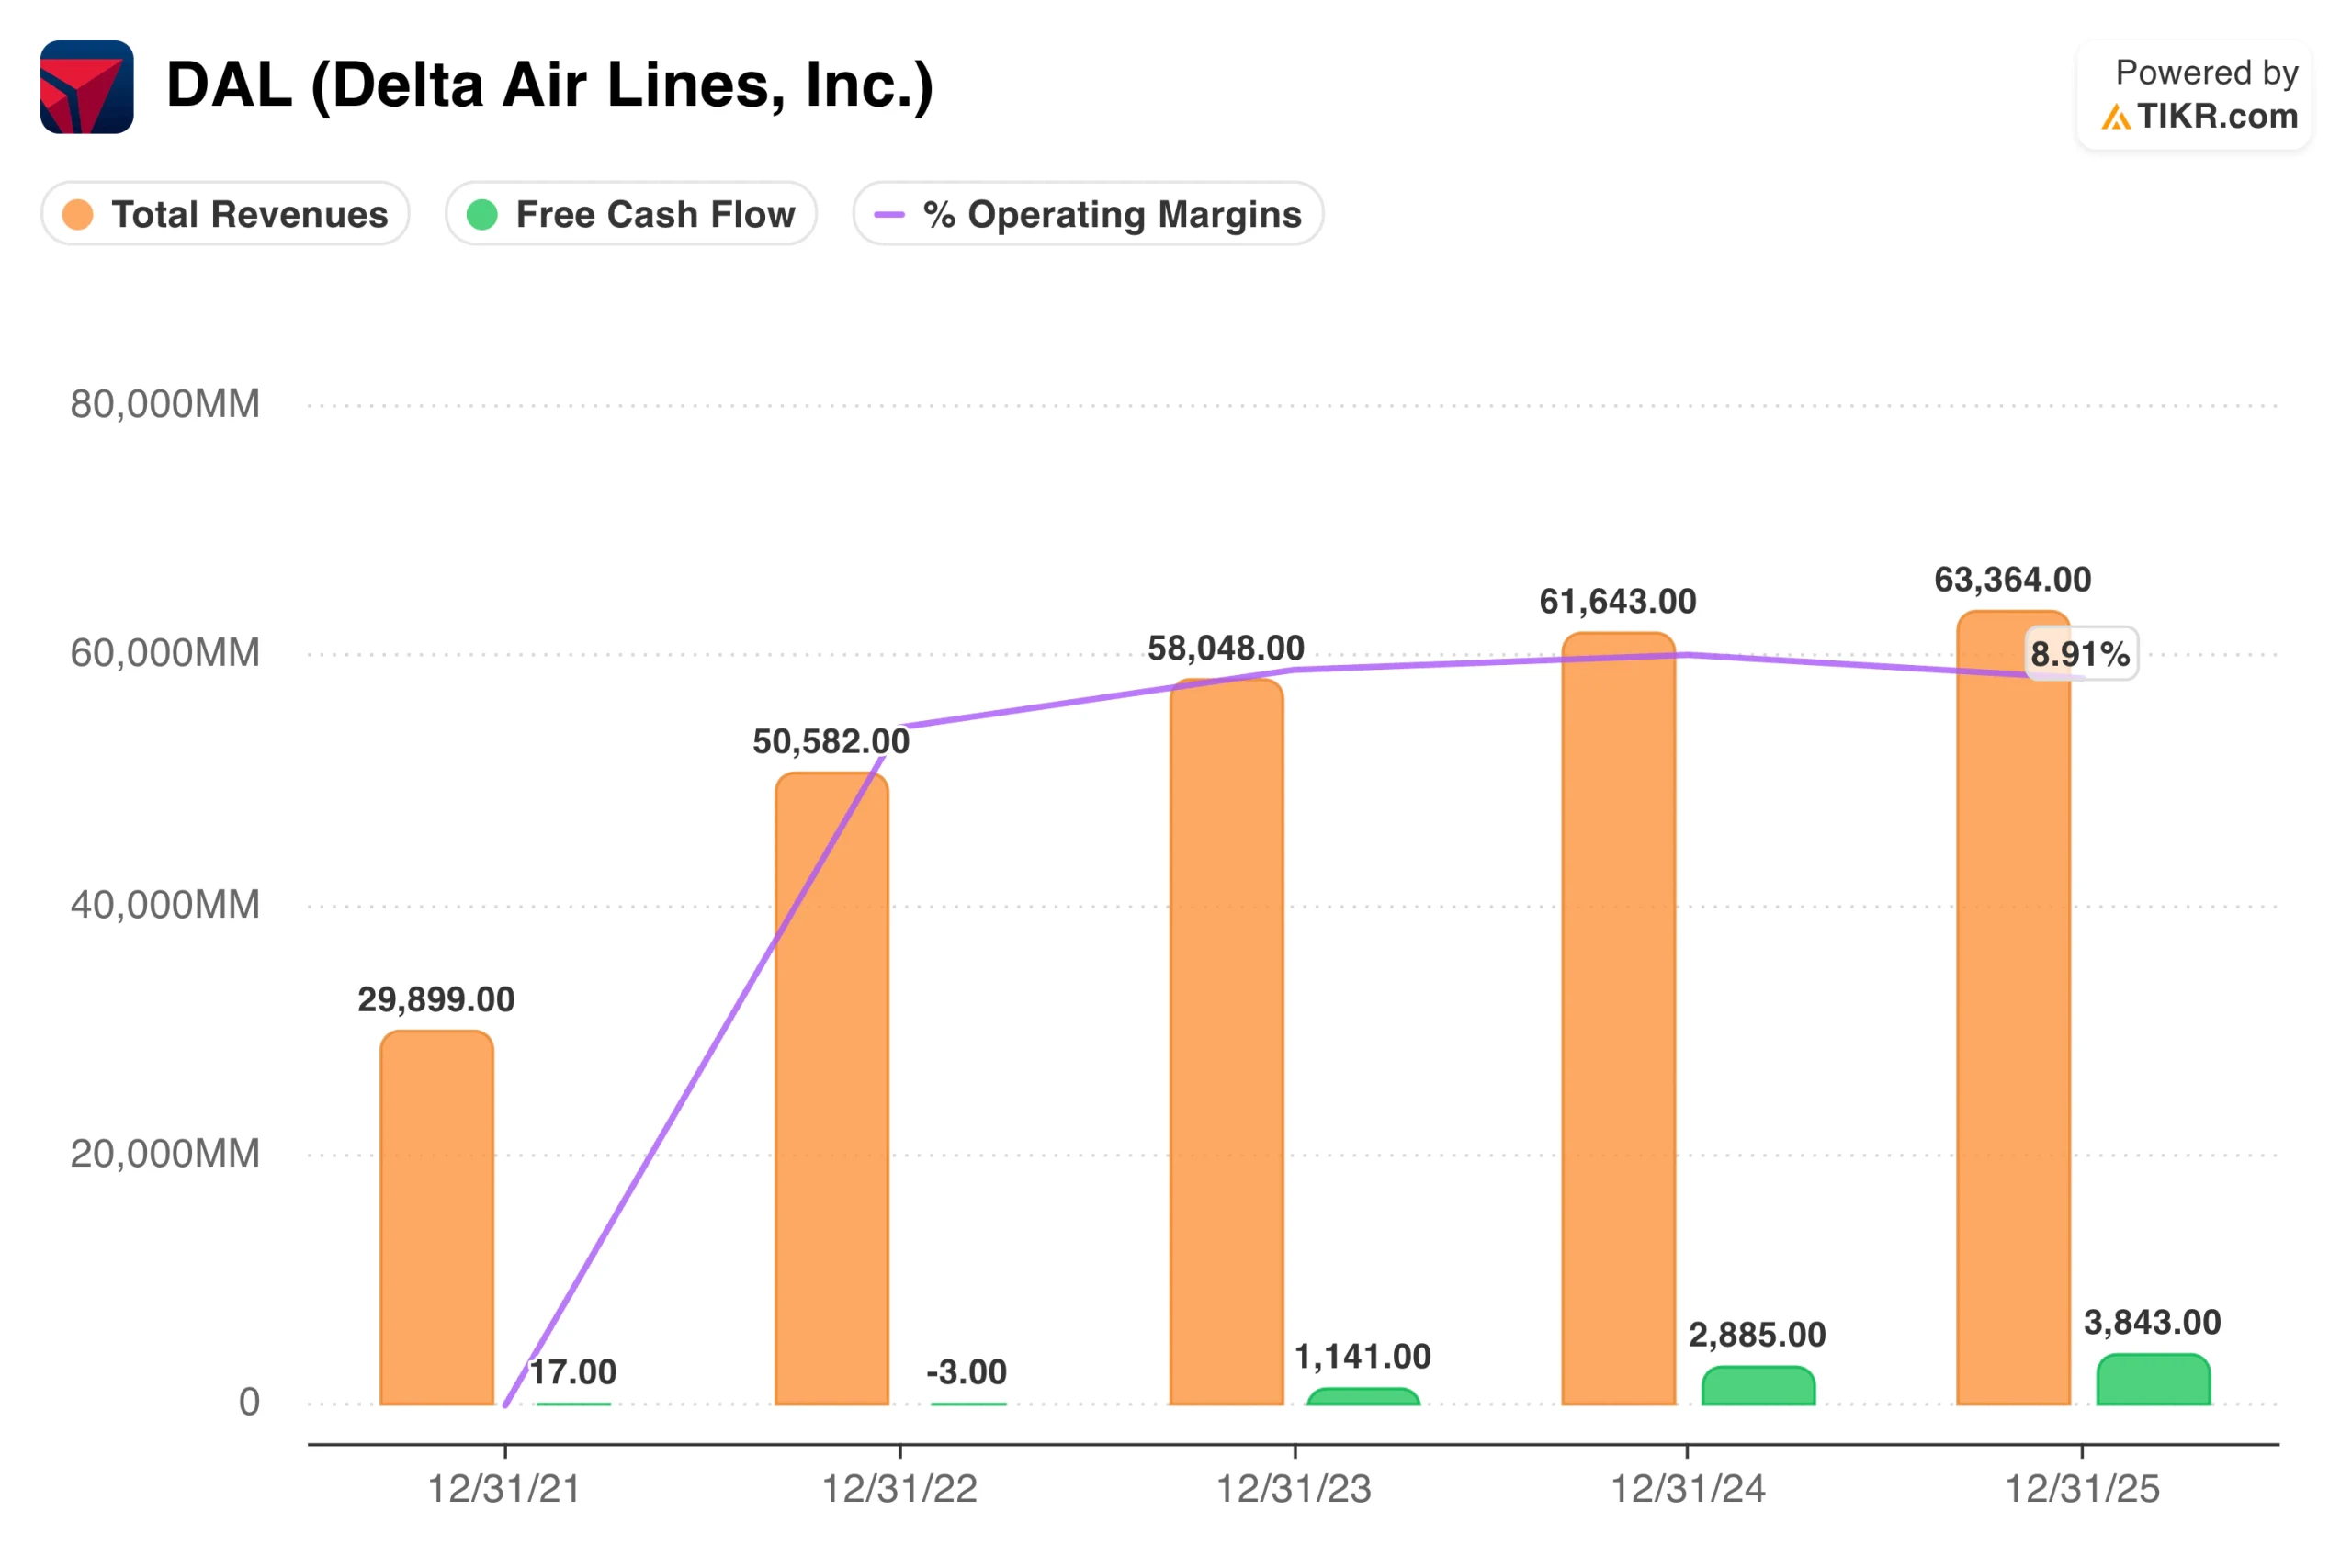
The financial charts for both airlines trace the same broad arc: near-zero revenue in 2021 as travel returned, rapid growth through 2022 and 2023, and steadier compounding since then.
Delta grew revenue from $29.9 billion in 2021 to $63.4 billion in 2025, with operating margins expanding consistently from negative territory to around 9% and free cash flow reaching $3.8 billion last year. That free cash flow trajectory matters because Delta has been using it to pay down debt and return capital, getting adjusted net debt below 2019 levels.
United’s chart shows a similar trajectory, with revenue growing from $24.6 billion in 2021 to $59.1 billion in 2025 and operating margins reaching around 8.6%. Free cash flow at United came in at $2.6 billion in 2025, somewhat lower than Delta’s, and the company has guided for a similar level in 2026.
The operating margin gap between the two is narrower than it has historically been, which is part of why United’s valuation discount to Delta is the smallest it has been in years.
See historical and forward estimates for United Airlines stock (It’s free!) >>>
What Wall Street Is Expecting From Each Carrier
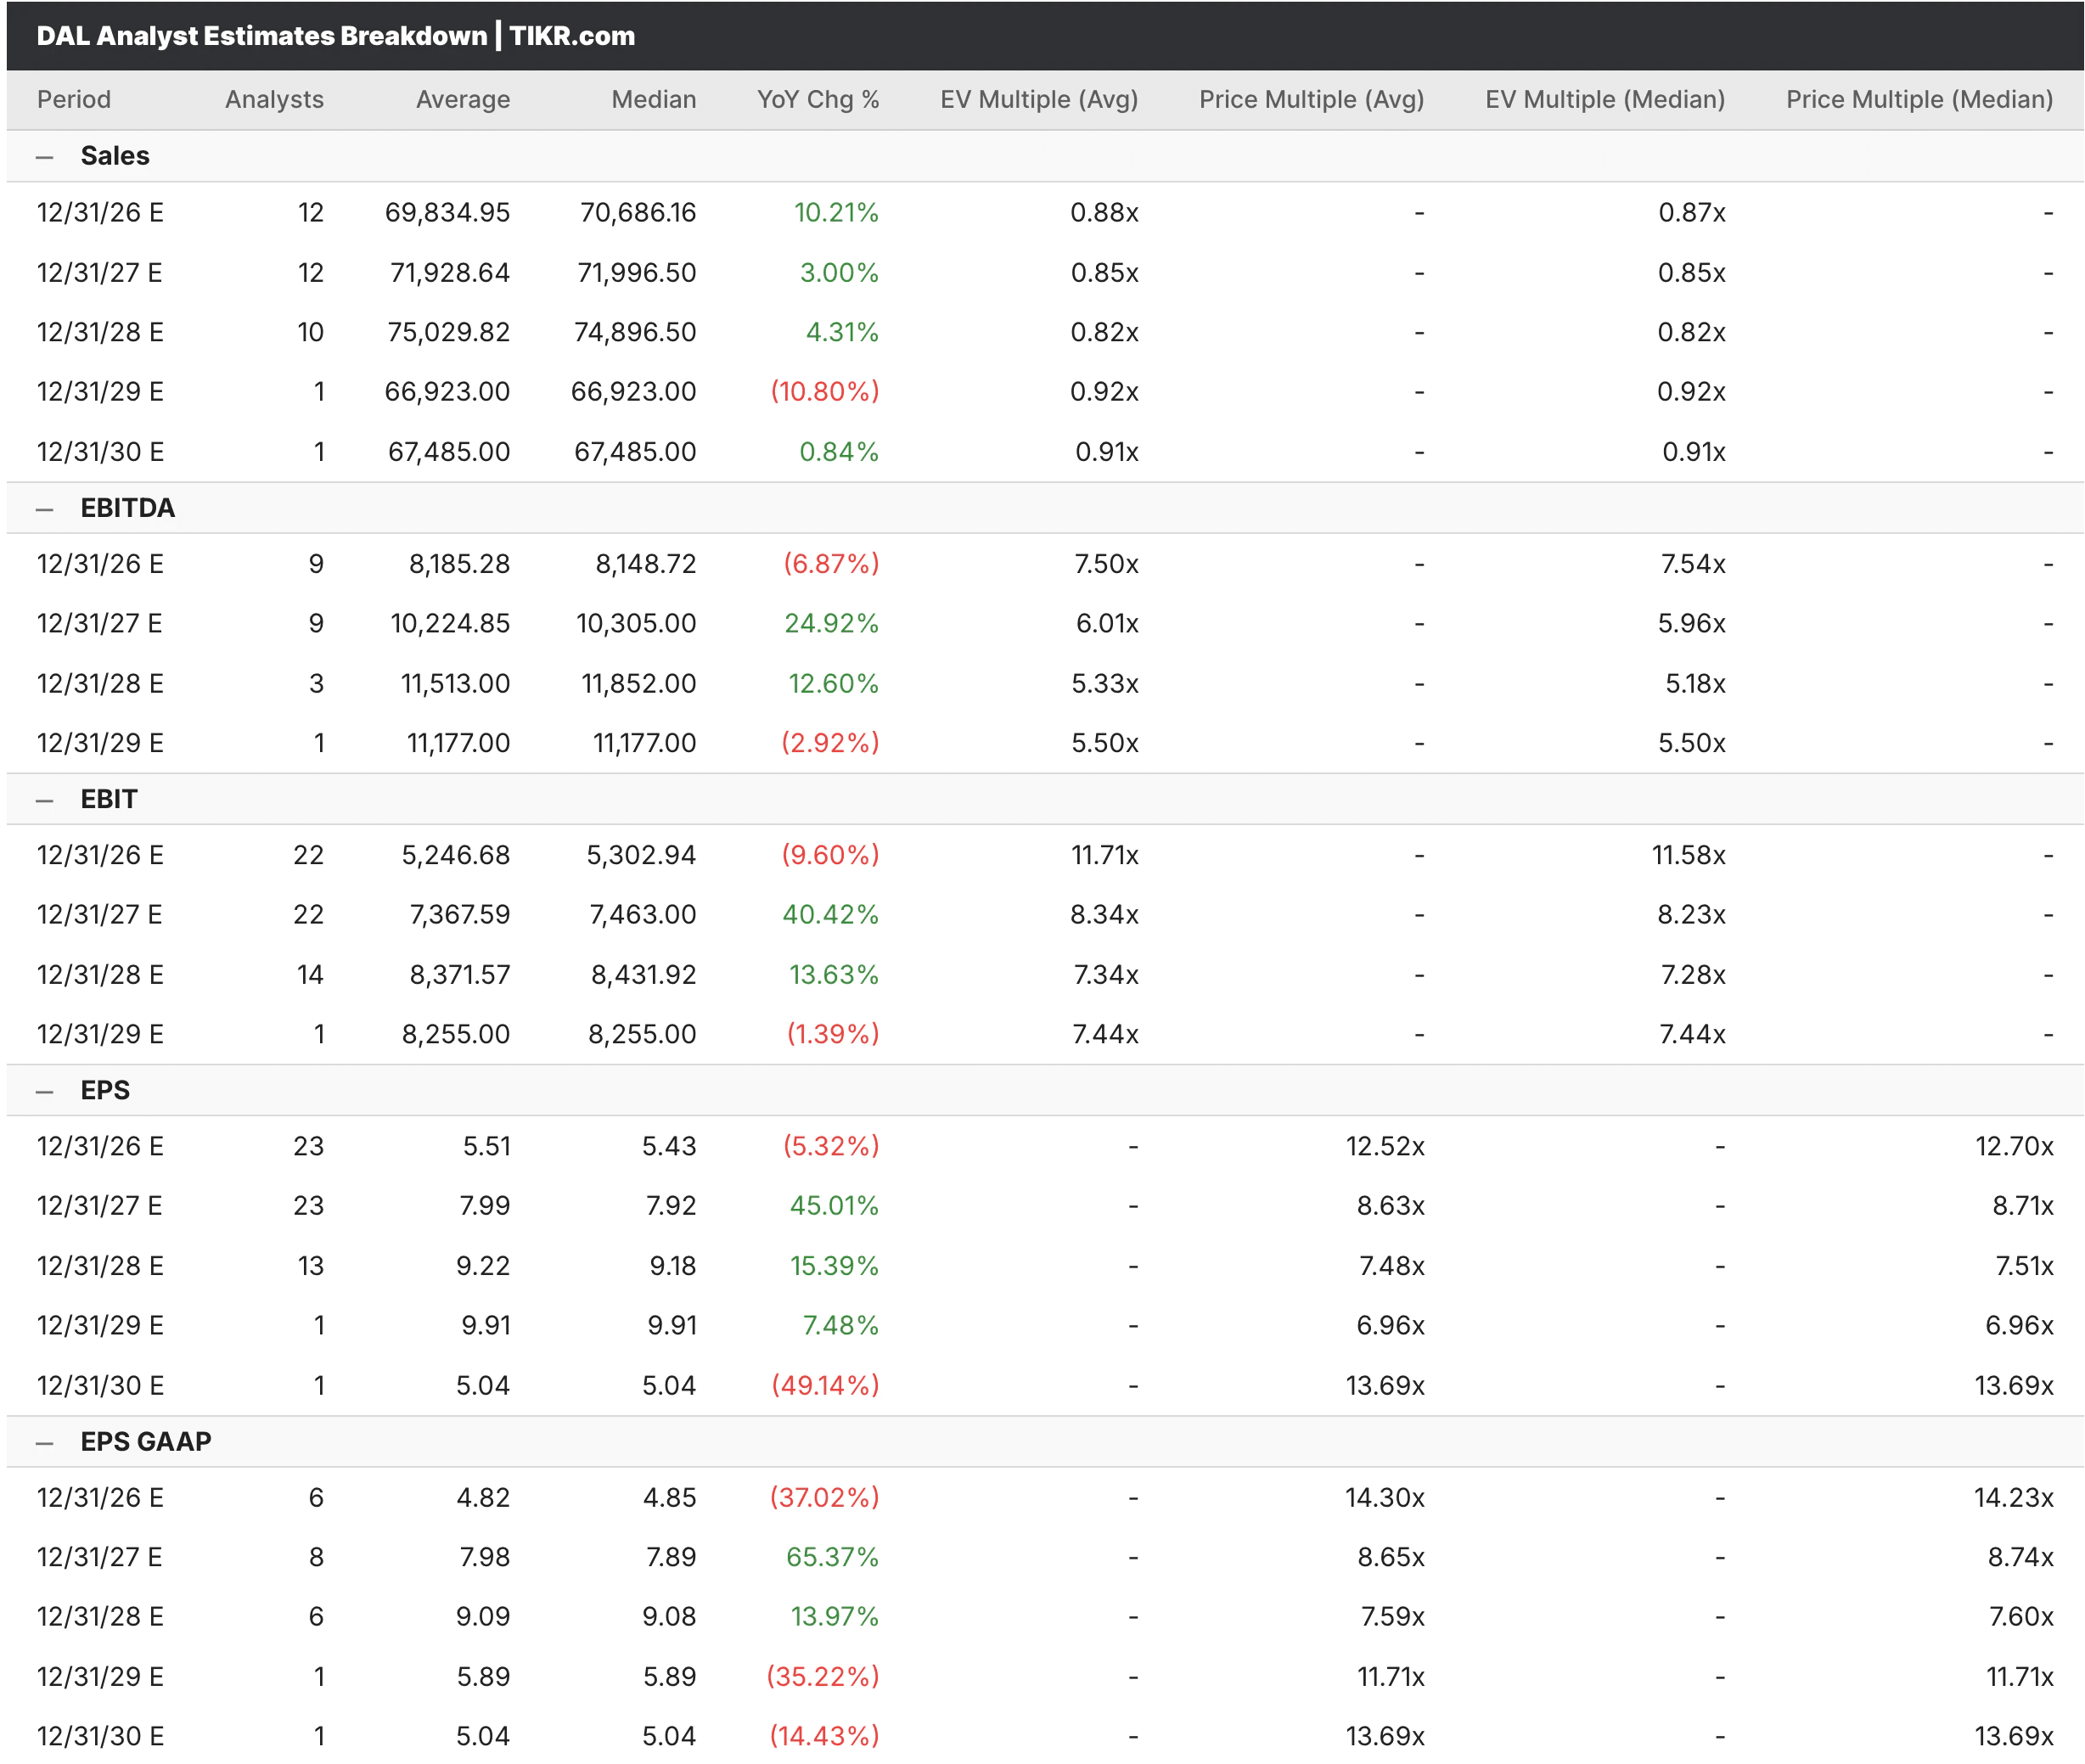
From the TIKR Estimates tab, analysts expect Delta revenue to reach around $70 billion in 2026, growing roughly 10%, with EPS of around $5.43 for the year before accelerating sharply to around $7.99 in 2027 as fuel costs normalize and premium capacity growth compounds. The 2026 EPS estimate reflects a year-over-year decline from 2025, largely driven by higher fuel expenses, a trend Delta explicitly acknowledged in its Q1 guidance.
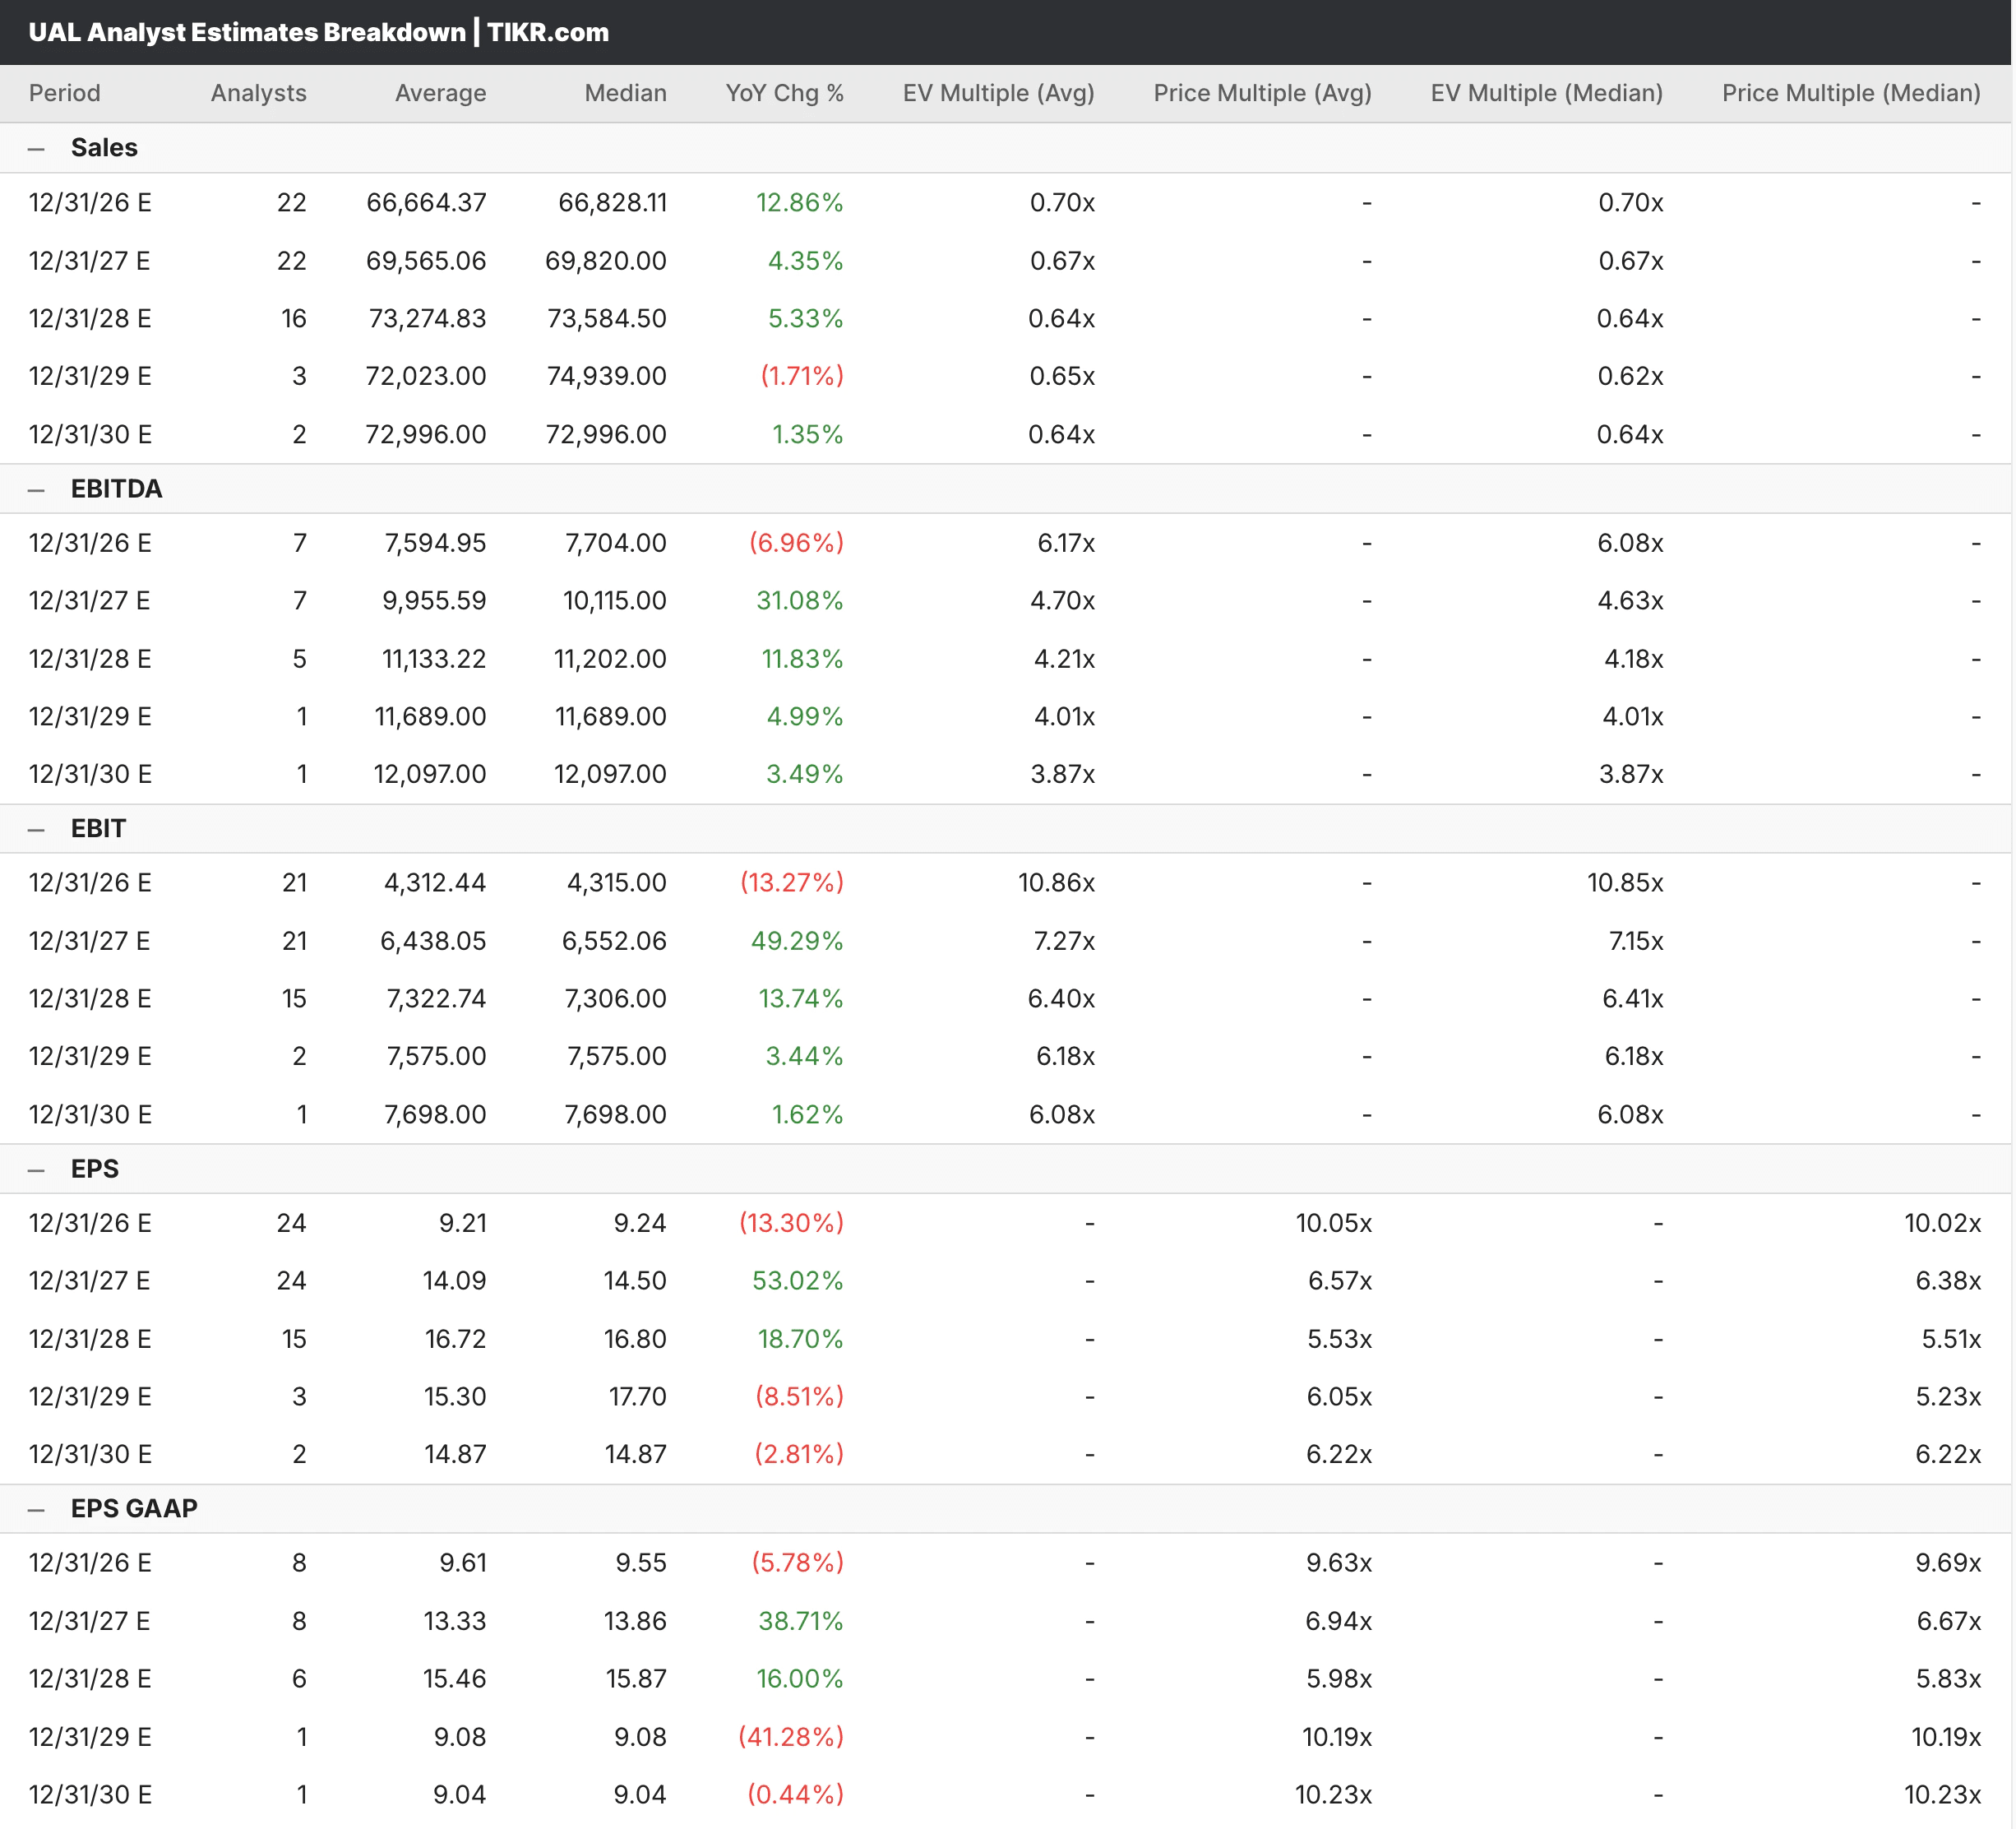
United’s estimates show a similar pattern, with 2026 revenue consensus of around $66.7 billion, growing by around 13%, and EPS of around $9.21 in 2026, before an expected surge to around $14.09 in 2027. That near-doubling of EPS from 2026 to 2027 is the central bull case for United, reflecting the operating leverage that kicks in once the revenue base stabilizes and fuel headwinds ease.
Both airlines are being valued as recovery and growth stories simultaneously, which is a balancing act that depends heavily on fuel prices and consumer spending holding up through the back half of the year.
See what analysts think about Delta stock right now (Free with TIKR) >>>
Cheap for a Reason, or Just Cheap?
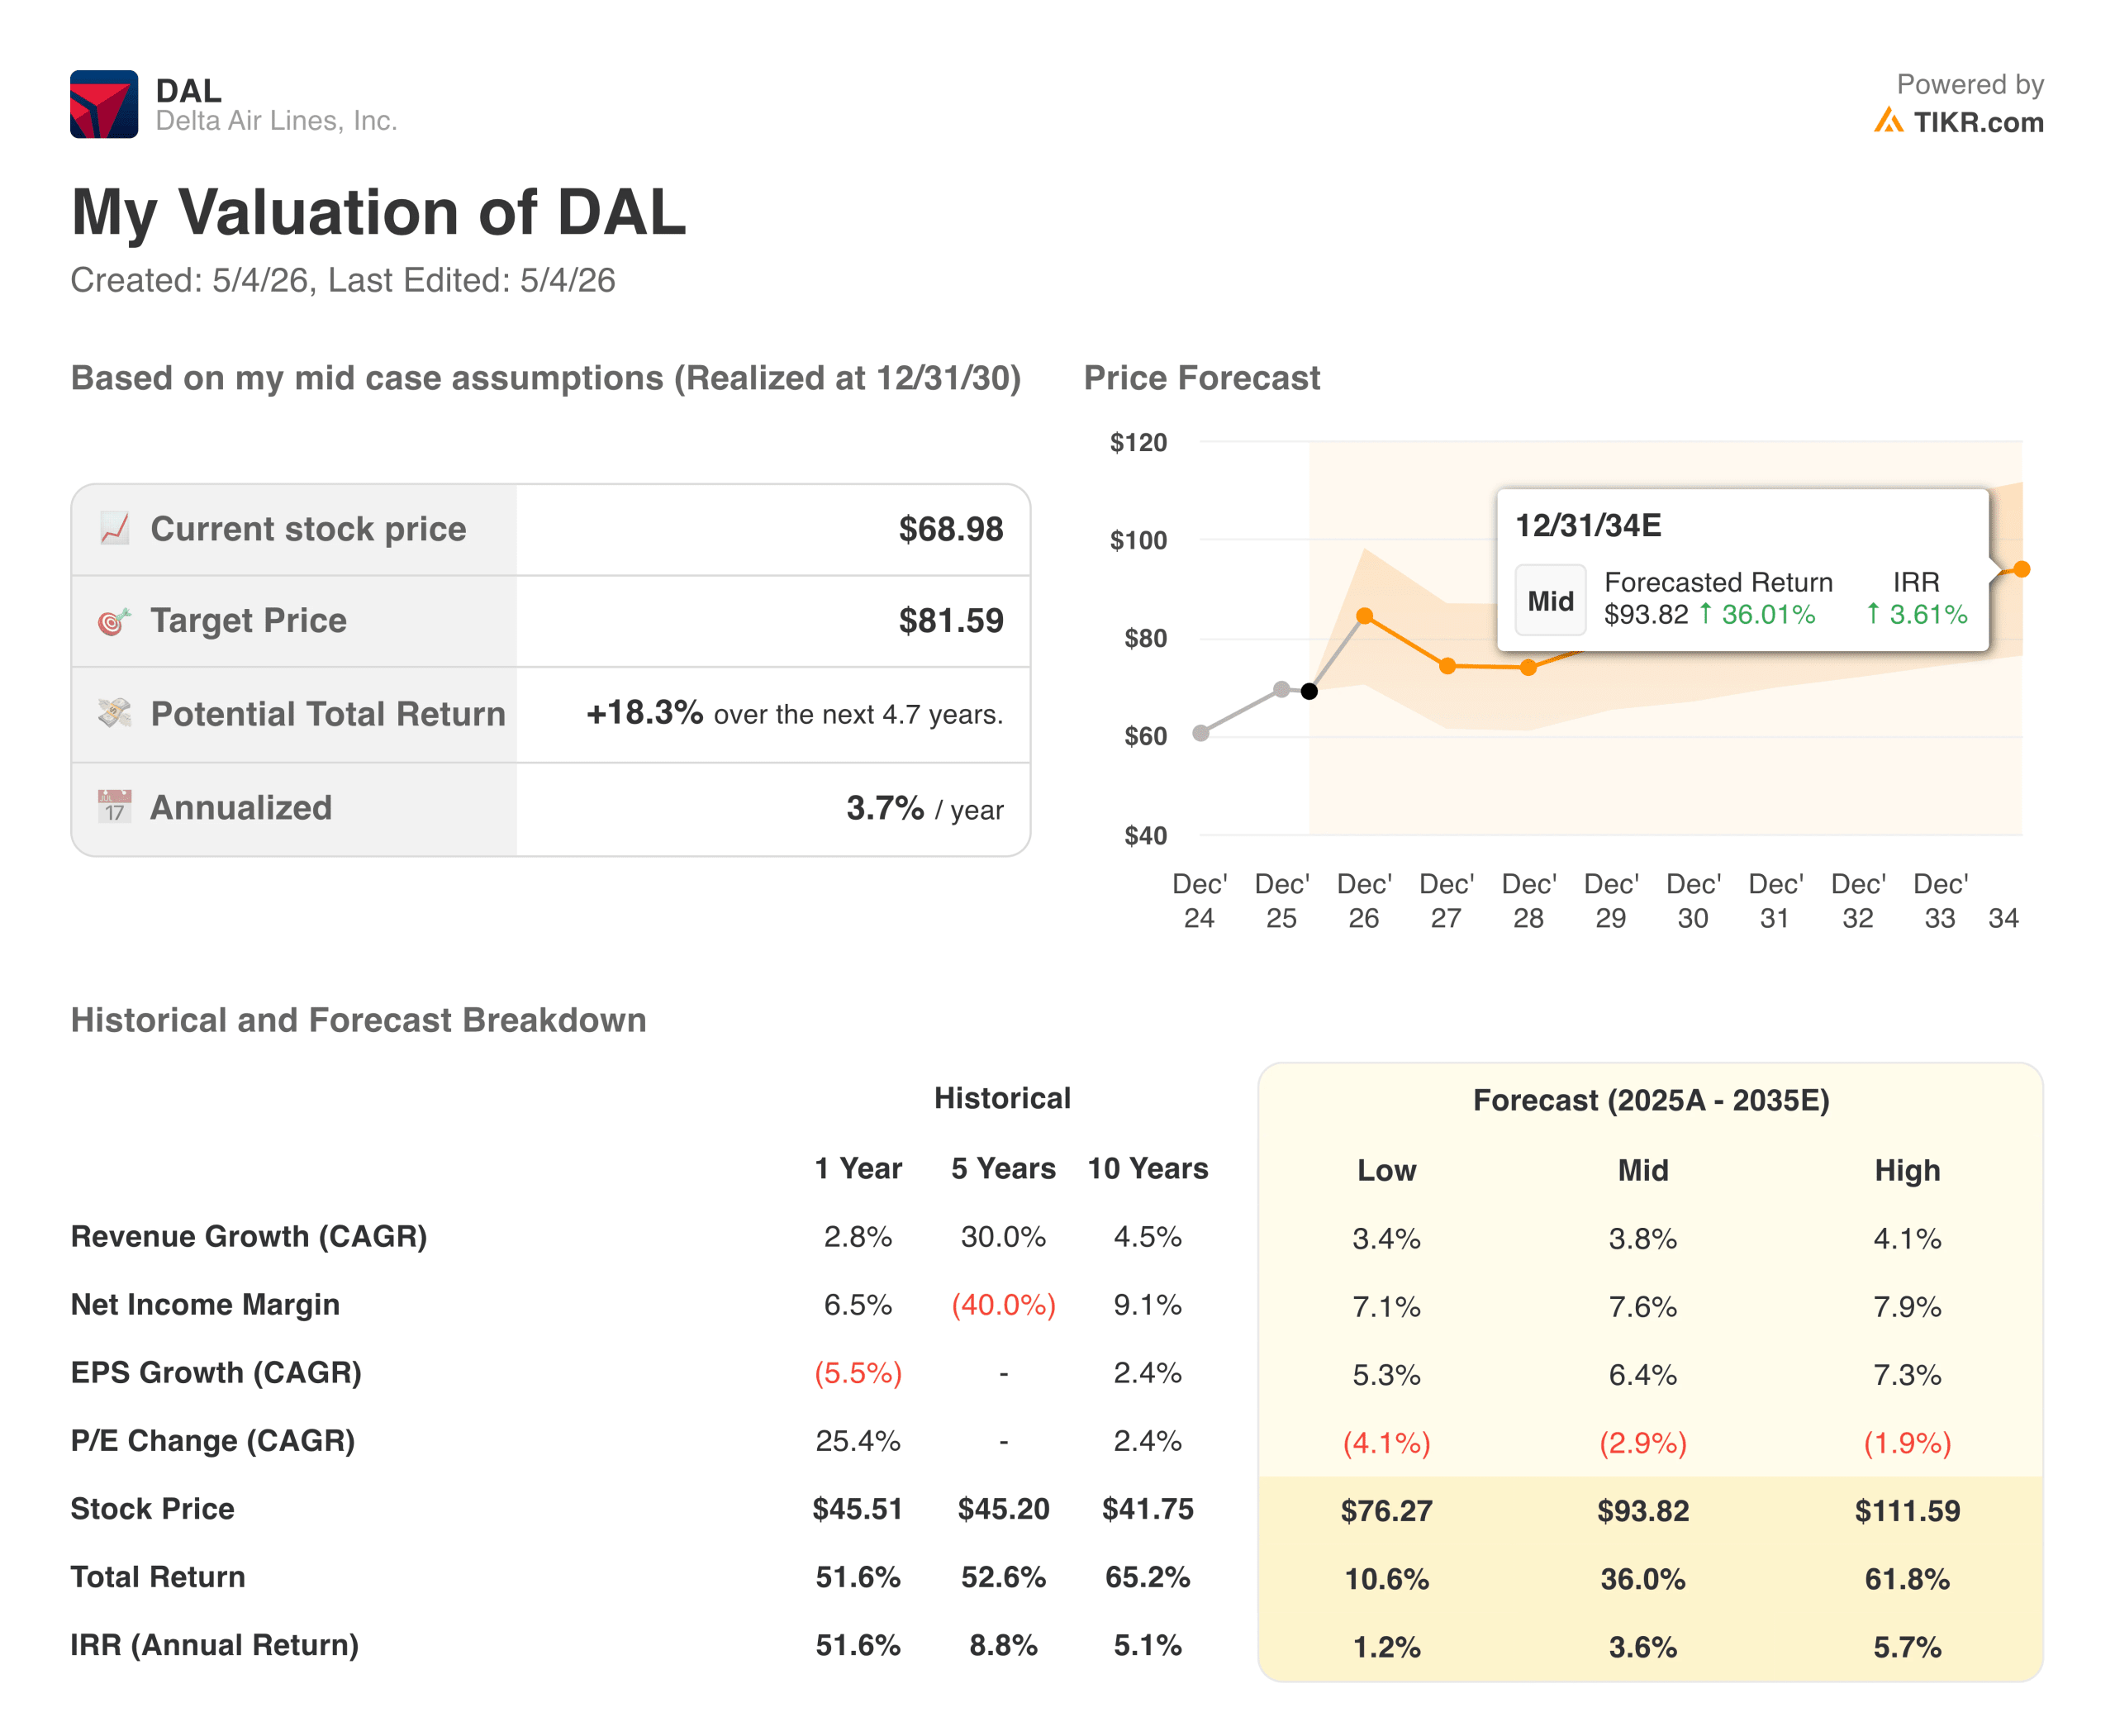
Delta trades at roughly 12x forward earnings and 7.5x forward EV/EBITDA, with the street consensus target at around $79, implying meaningful upside from the current price of around $69. The TIKR model targets around $82 in the mid-case, with an annualized return of roughly 4%, reflecting a business that is well-run and reasonably priced but not dramatically mispriced at current levels.
United trades at roughly 10x forward earnings and 6.2x forward EV/EBITDA, a notable discount to Delta on both metrics. The ROIC data tell an interesting story here: Delta’s ROIC is 12.4% versus United’s 10.5%, which partly explains the premium, though the gap is smaller than it once was.

The street target for Delta implies around 16% upside from current prices. United’s valuation multiples are lower across the board, which means United is either a better value or reflects a justified discount for operational uncertainty, and that is exactly the debate worth having.
See analysts’ full growth forecasts and estimates for United Airlines stock (It’s free) >>>
Which Seat Would You Rather Own?
Delta is the more defensive of the two. The premium-led revenue model, stronger free cash flow, and long track record of operational consistency give it a more predictable earnings profile, and the TIKR model suggests the stock is reasonably valued even in a softer demand environment.
United is the more interesting growth setup right now. The EPS trajectory from 2026 to 2027 is among the more dramatic in the large-cap industrial sector, the premium product investment is real and showing up in the revenue numbers, and the valuation discount to Delta is the narrowest it has been in years.
Neither stock is pricing in a recession. Both have meaningful fuel cost exposure that can move earnings significantly in either direction. And both are fundamentally better businesses than they were five years ago, which is the most important context for evaluating either one as a long-term holding.
Build your own Valuation Model to value any stock (It’s free!) >>>
How Much Upside Does Each Stock Have From Here?
With TIKR’s new Valuation Model tool, you can estimate a stock’s potential share price in under a minute.
All it takes is three simple inputs:
- Revenue Growth
- Operating Margins
- Exit P/E Multiple
If you’re not sure what to enter, TIKR automatically fills in each input using analysts’ consensus estimates, giving you a quick, reliable starting point.
From there, TIKR calculates the potential share price and total returns under Bull, Base, and Bear scenarios so you can quickly see whether a stock looks undervalued or overvalued.
See a stock’s true value in under 60 seconds (Free with TIKR) >>>
Looking for New Opportunities?
- See what stocks billionaire investors are buying so you can follow the smart money.
- Analyze stocks in as little as 5 minutes with TIKR’s all-in-one, easy-to-use platform.
- The more rocks you overturn… the more opportunities you’ll uncover. Search 100K+ global stocks, global top investor holdings, and more with TIKR.
Disclaimer:
Please note that the articles on TIKR are not intended to serve as investment or financial advice from TIKR or our content team, nor are they recommendations to buy or sell any stocks. We create our content based on TIKR Terminal’s investment data and analysts’ estimates. Our analysis might not include recent company news or important updates. TIKR has no position in any stocks mentioned. Thank you for reading, and happy investing!