Key Takeaways
- Western Digital stock’s TIKR model targets ~19% IRR versus Intel stock’s ~8%, anchored by faster revenue growth and a cleaner margin recovery.
- Western Digital gross margins recovered from 22% in FY23 to near 39% in FY25; Intel’s compressed from 55% to ~37% over the same span.
- Intel stock trades at 92x NTM P/E against a 5-year mean of 43x, pricing in a recovery FY26 EPS of $1.08 hasn’t confirmed.
- The key risk in Western Digital stock is a NAND pricing reversal; for Intel stock, it is foundry execution missing the ~8% revenue CAGR.
Key Stats
Western Digital Corporation (WDC)
- Price: $442
- 52-Week Range: $44 – $454
- Market Cap: $152.5B
- Enterprise Value: $151B
- Analyst Mean Target: $479
- Analyst Consensus: 16 Buys, 4 Outperforms, 4 Holds, 1 Underperform
Intel Corporation (INTC)
- Price: $96
- 52-Week Range: $19 – $100
- Market Cap: $481.4B
- Enterprise Value: $506.9B
- Analyst Mean Target: $79
- Analyst Consensus: 11 Buys, 2 Outperforms, 30 Holds, 3 Underperforms, 2 Sells
The Upcycle vs. The Restructuring
Western Digital Corporation (WDC) is a pure-play storage company designing NAND flash and hard disk drives (HDDs) for data centers, consumer electronics, and cloud infrastructure.
The business is structurally tied to the NAND pricing cycle, which bottomed in early FY23 and has recovered sharply since.
Western Digital’s data center HDD segment has benefited directly from hyperscaler capacity expansion, with cloud customers pulling in orders ahead of expected demand.
Management noted on the most recent earnings call that nearline HDD demand remains robust, with lead times extending as supply stays disciplined.
The gross margin inflection from 22.2% in FY23 to 38.8% in FY25 reflects both better NAND pricing and a mix shift toward higher-margin enterprise storage.
Intel Corporation (INTC) is a diversified semiconductor company spanning client PCs, data center CPUs, and an emerging contract chip manufacturing business called Intel Foundry.
The investment thesis today is not a single upcycle but a multi-year restructuring bet: that Intel can stabilize its core CPU franchise while building a credible foundry business to compete with TSMC.
Intel’s new CEO has streamlined the product roadmap, reduced headcount by roughly 15,000, and positioned Intel Foundry as an independent business unit with its own P&L.
Management commentary from the most recent earnings call highlighted progress on the 18A process node, which is the technology generation Intel needs to win external foundry customers.
FY25 revenue stabilized at $52.85B after four consecutive years of declines, and consensus now expects $58.58B in FY26.
The tension is structural, not cyclical. Western Digital is riding a storage upcycle with improving fundamentals and a clean balance sheet; Intel is attempting a strategic transformation with a valuation that has already re-rated significantly.
The Consensus Gap: One Recovery in Actuals, One in the Multiple
The business model difference between these two companies translates directly into the shape of the forward earnings curve.
Western Digital’s recovery is tied to a NAND upcycle already showing up in actuals. Intel’s recovery depends on PC cycle normalization, data center CPU share recovery, and foundry ramp: three drivers operating on different timelines.
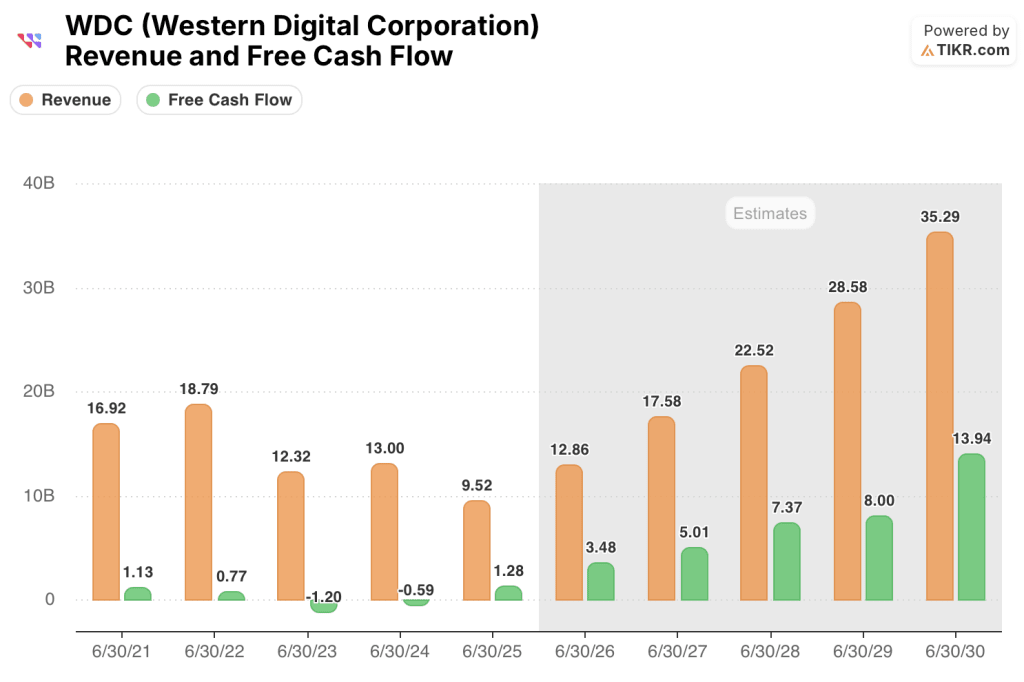
Western Digital consensus revenue of $12.86B in FY26 represents 35% growth over FY25’s $9.52B, with EPS of $9.92 expected, up 101.2% year-over-year.
FCF is expected to reach $3.48B in FY26, more than doubling from $1.28B in FY25.
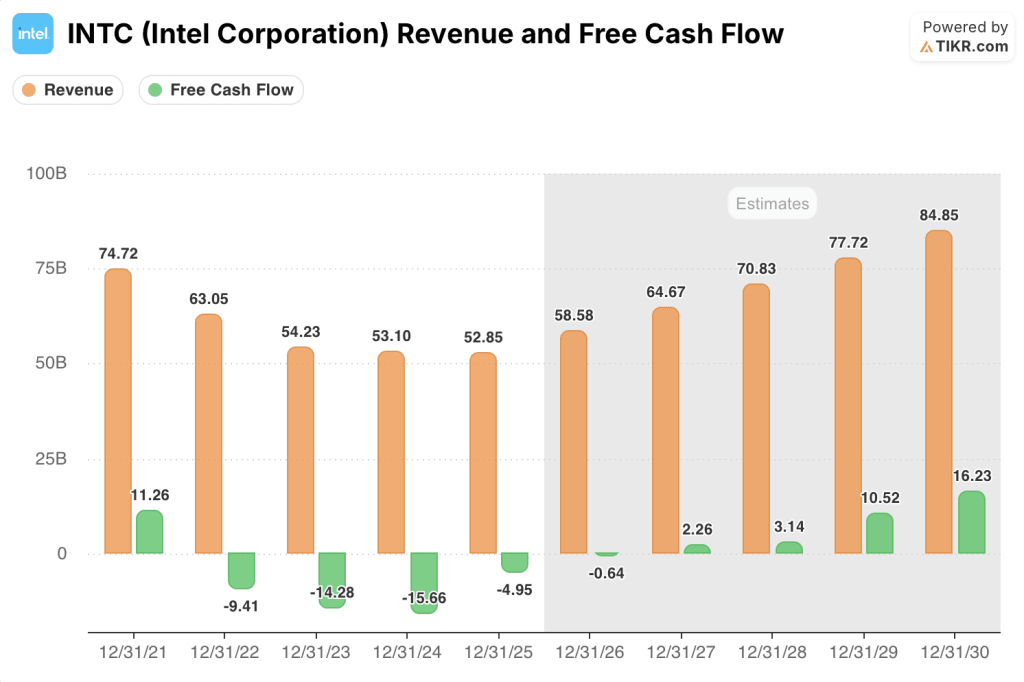
Intel consensus revenue of $58.58B in FY26 represents 10.8% growth over FY25’s $52.85B, with EPS of $1.08 expected, up 157.4% but from a deeply depressed base of $0.42.
Intel FCF is expected at negative $0.64B in FY26 before inflecting to $2.26B in FY27.
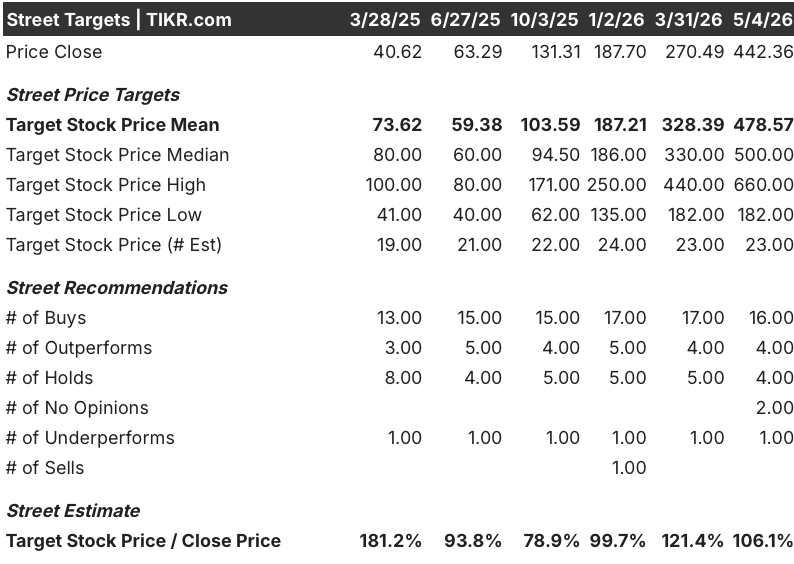
Coverage for Western Digital stock includes 16 buys, 4 outperforms, 4 holds, and 1 underperform among 23 analysts, with a mean target of $479 implying roughly 6% upside from the current price of $442.
The Street’s mean target has tracked the stock’s surge closely, rising from $328.39 in March to $478.57 today, but the high target of $660.00 suggests a portion of the coverage sees significantly more room from here.
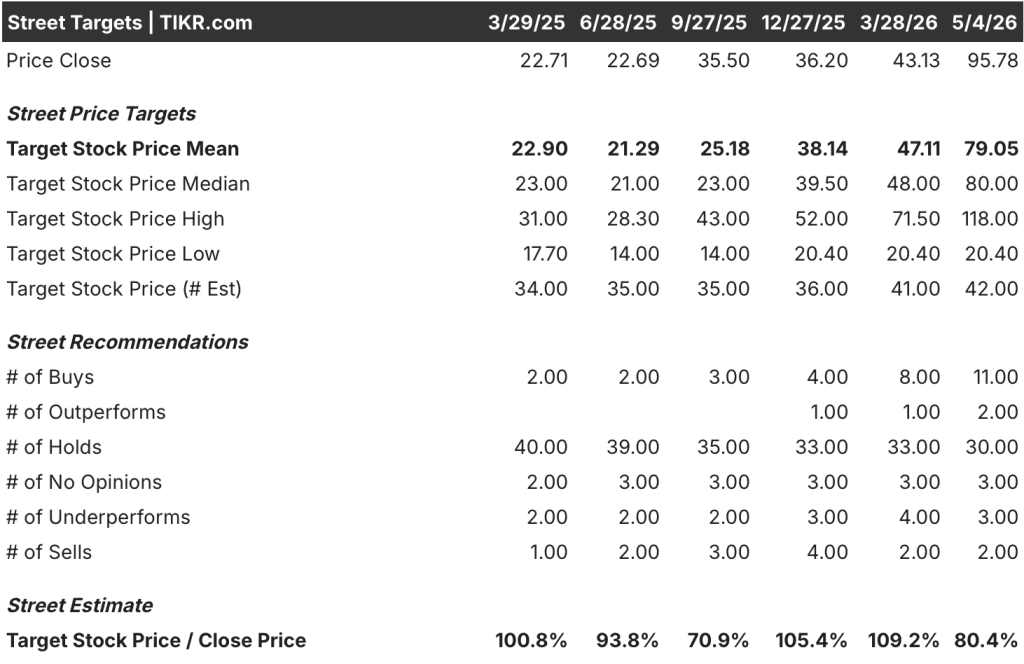
Intel stock draws considerably more cautious coverage: 11 buys, 2 outperforms, 30 holds, 3 underperforms, and 2 sells among 48 analysts, with a mean target of $79 sitting around 18% below the current price of $96.
The Street’s mean target has risen from $47 in March to $79 today, but the stock has outrun analyst revisions entirely, trading near its 52-week high of $100 on a high target of just $118.
Gross Margins Tell the Story
The gross margin trajectories of these two companies run in opposite directions, and that divergence is the central profitability story of this comparison.
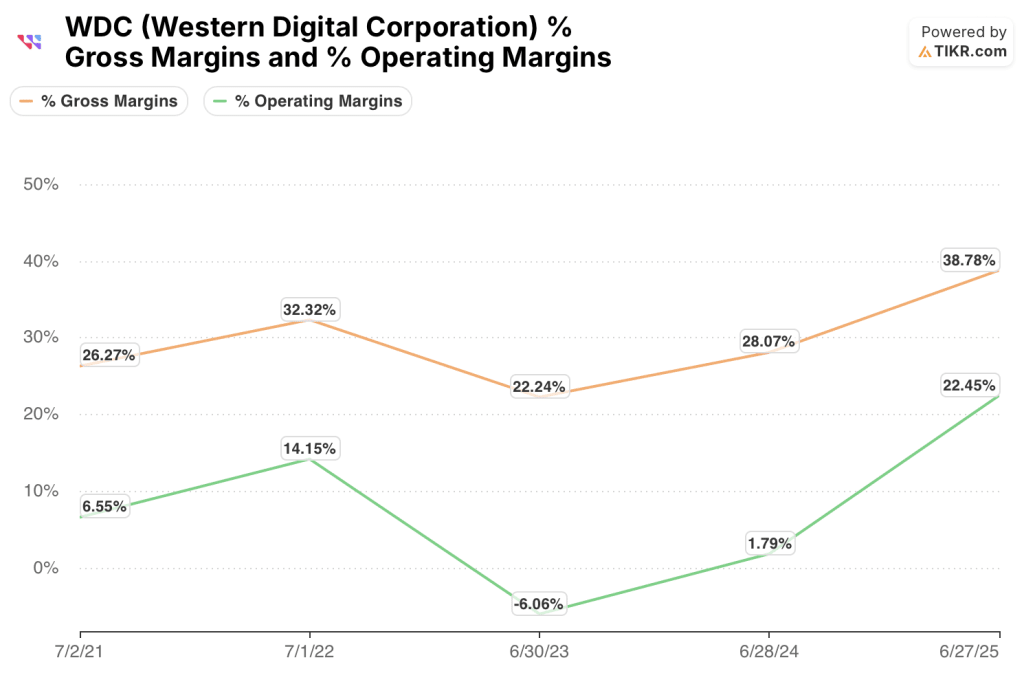
Western Digital’s gross margins collapsed to 22.2% in FY23 as NAND prices fell sharply, then recovered to 28.1% in FY24, 38.8% in FY25, and 42.7% on an LTM basis.
Operating margins followed the same arc, moving from negative 6.1% in FY23 to 22.4% in FY25 and 28.0% LTM, driven by the operating leverage embedded in a fab-heavy business and the pricing power that returns when NAND supply tightens.
Intel’s trajectory runs the other way.
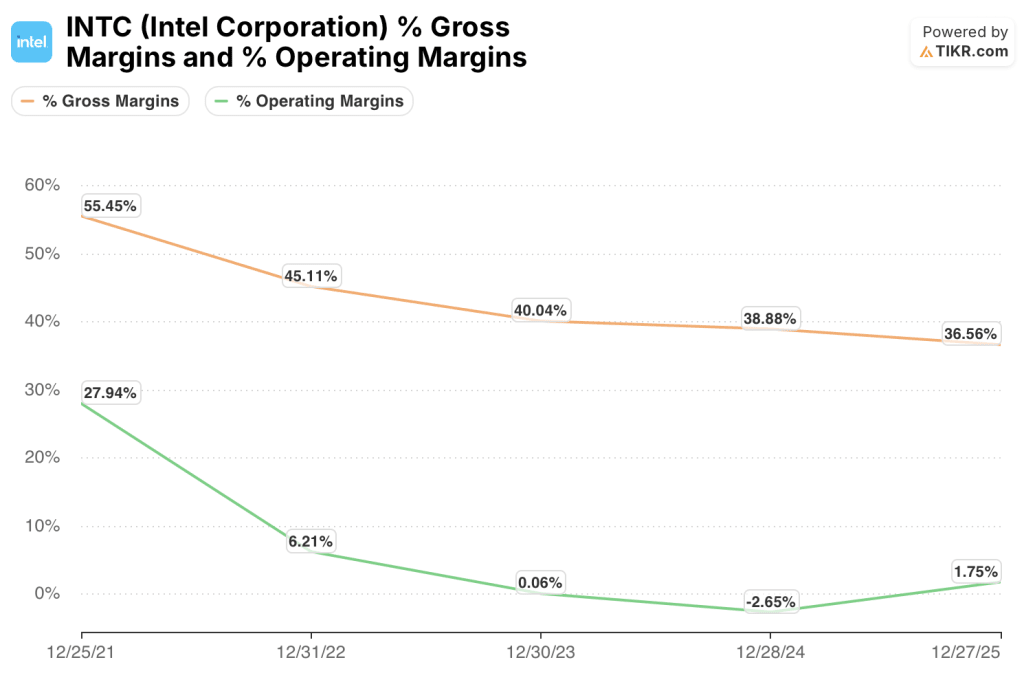
Gross margins were 55.4% in FY21, the structural premium that comes with dominant CPU market share and captive manufacturing.
By FY25, they had compressed to 36.6%, with operating margins falling from 27.9% to 1.8% over the same period.
LTM gross margins have stabilized at 37.2%, but that is still below where Western Digital stands today.
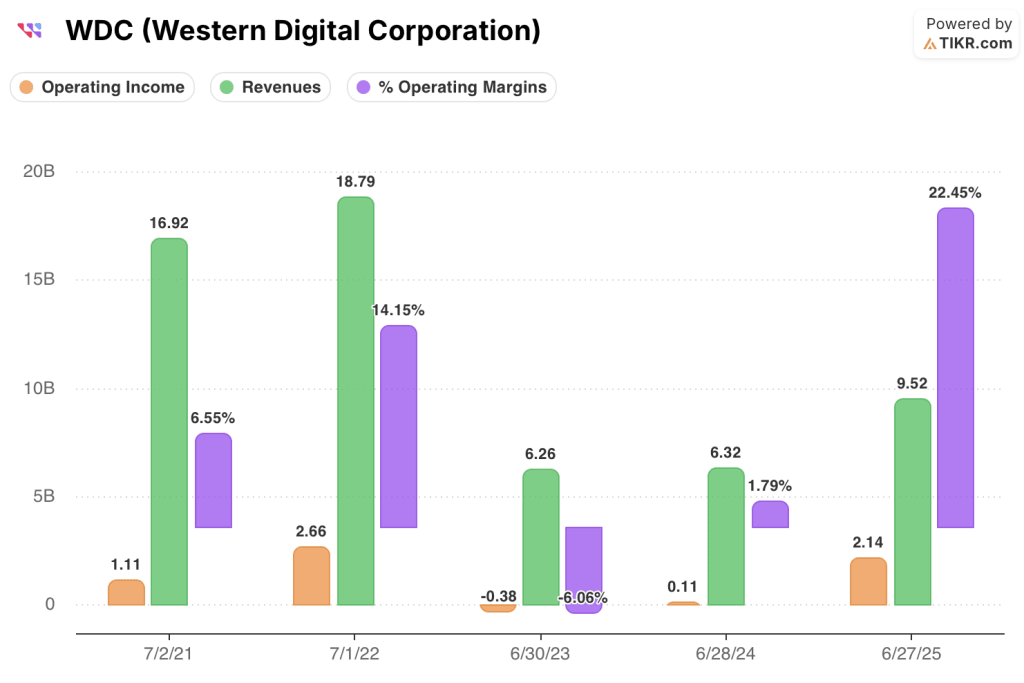
Western Digital generated $2.14B in operating income in FY25 on $9.52B in revenue, a 22.4% margin, from a base of near-zero operating income in FY24.
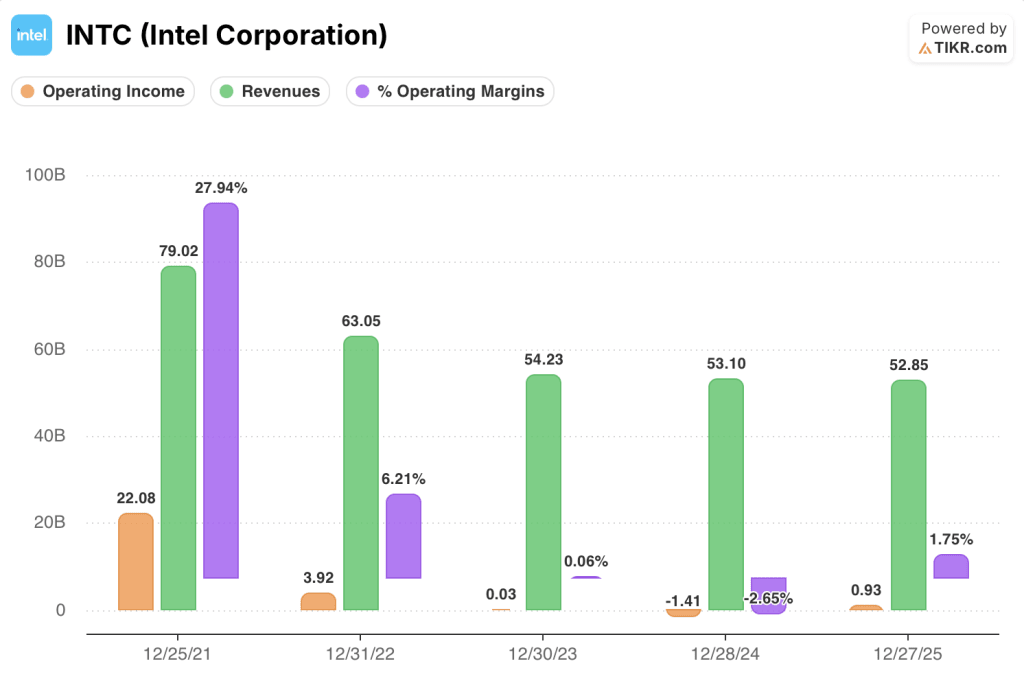
Intel generated $0.93B in operating income in FY25 on $52.85B in revenue, a 1.8% margin, from a base that included a $1.41B operating loss in FY24.
Western Digital is turning faster on less revenue; Intel’s scale has not yet translated into operating leverage at the current cost structure.
Intel’s gross margin recovery requires both successful 18A node yields and a mix shift back toward higher-margin server CPUs. Western Digital’s requires only sustained NAND pricing and continued data center HDD demand, both of which are already showing up in the actuals.
Valuation Model Take + Head-to-Head Scenario Breakdown
TIKR’s valuation model targets $925 for Western Digital stock on a mid-case basis, implying a 109% total return from the current price of $442 over 4 years.

Western Digital stock appears undervalued at current levels, with the mid-case IRR of around 19% anchored to a near 23% revenue CAGR assumption and a 39% net income margin target, both of which the FY26 consensus already approaches on the EBITDA line.
TIKR’s valuation model targets $189 for Intel stock on a mid-case basis, implying a 97% total return from the current price of $96 over ~5 years, but at an annualized IRR of only 8%.

Intel stock appears fairly valued to moderately overvalued at current levels, with the mid-case model requiring an approximate 8% revenue CAGR and near 14% net income margins: achievable, but leaving little margin of safety at a price already above the Street mean target of $79.
The 11% point IRR gap between Western Digital stock at 19% and Intel stock at 8% reflects not just a difference in growth speed but a difference in how much of each recovery has already been priced in.
The argument between these two stocks hinges on one question: how much of each company’s earnings recovery is already in the multiple versus still ahead of it.
The Case for Western Digital Corporation
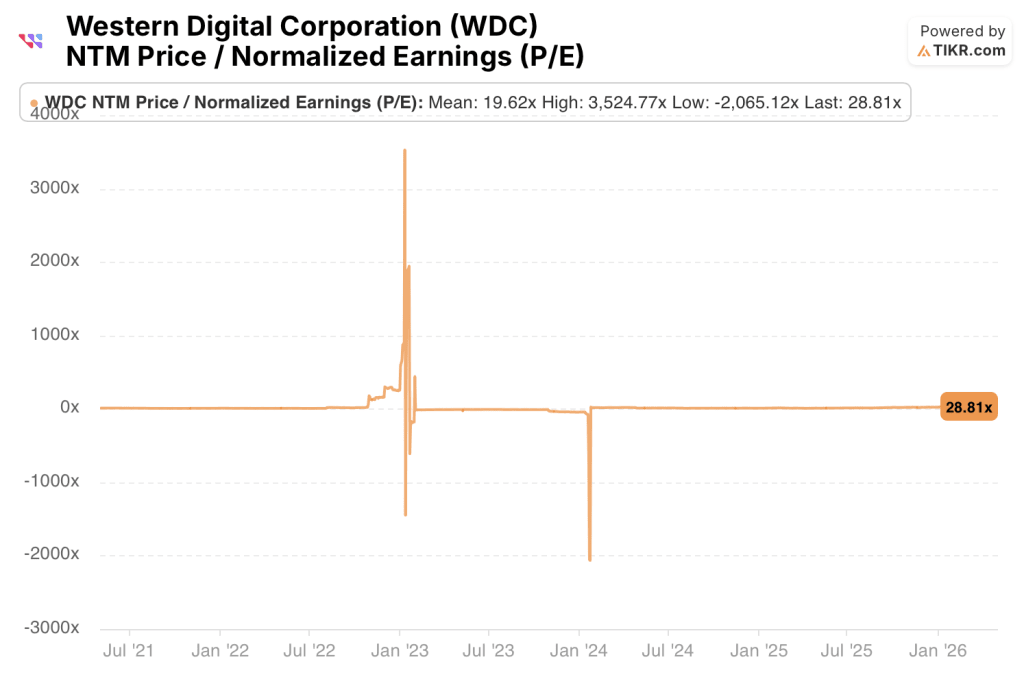
Western Digital stock trades at 29x NTM P/E against a 5-year mean of around 20x, a premium that is earning its keep as EPS is expected to more than double in FY26.
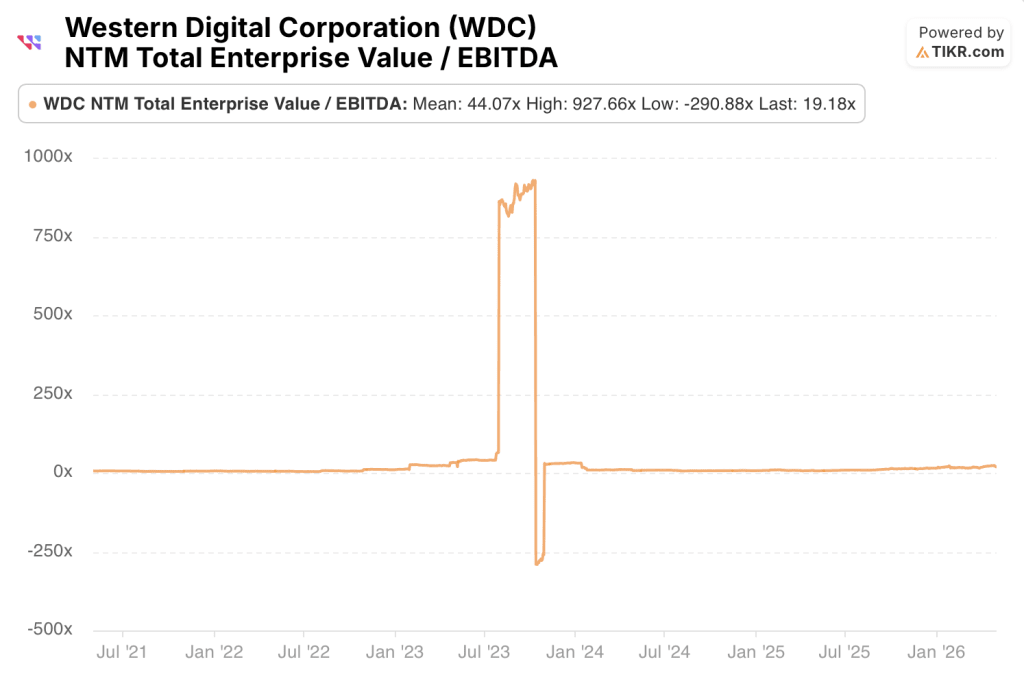
The NTM EV/EBITDA of 19x looks undemanding on a normalized cycle basis, with EBITDA margins expanding toward 40% in FY26 and FCF more than doubling from $1.28B to $3.48B.
The TIKR high-case target of $2,688 per share at a 25% IRR reflects the scenario where NAND pricing continues tightening through FY27 and consensus EBITDA margins approach 52%.
The Case for Intel Corporation
Intel stock trades at 92x NTM P/E against a 5-year mean of 43x, pricing in an earnings recovery that FY26 EPS of $1.08 has not yet confirmed.
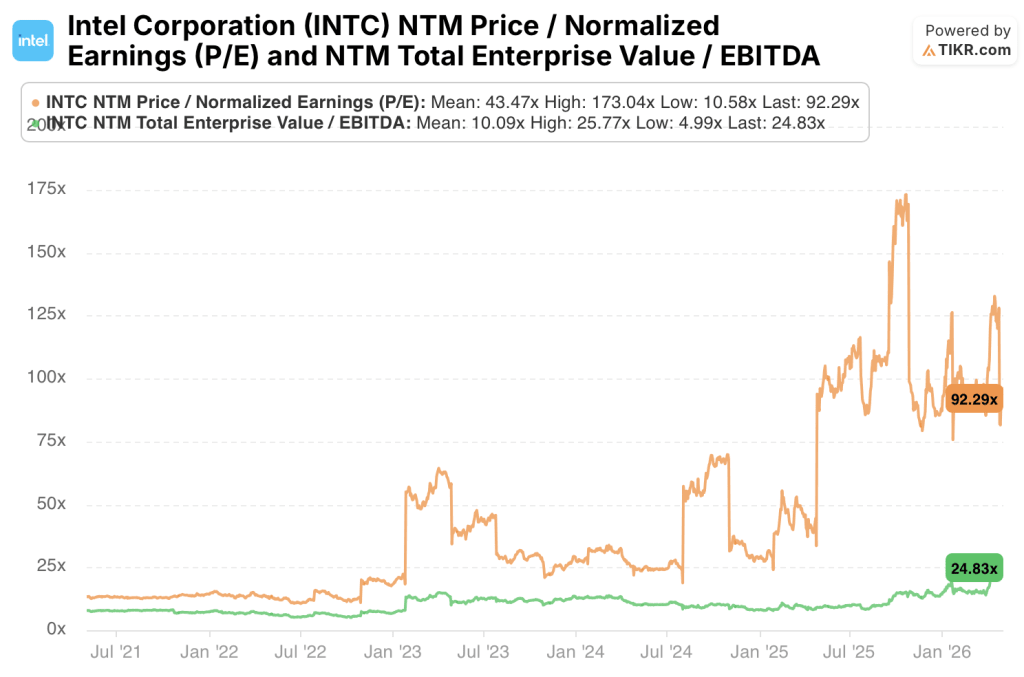
The NTM EV/EBITDA of 25x against a 5-year mean of 10x tells the same story: the multiple has re-rated ahead of the fundamental delivery, leaving little room for execution misses.
Intel’s 18A process node has two anchor customers engaged, the primary catalyst for foundry revenue to appear in the model by FY27.
The TIKR high-case target of $237 at an 11% IRR requires three or more external foundry customers by FY28 and net income margins approaching 15%.
Should You Invest in Western Digital Corporation or Intel Corporation?
The only way to really know is to look at the numbers yourself. TIKR gives you free access to the same institutional-quality financial data that professional analysts use to answer exactly that question.
Pull up Western Digital Corporation stock and Intel Corporation stock and you’ll see years of historical financials, what Wall Street analysts expect for revenue and earnings in the quarters ahead, how valuation multiples have moved over time, and whether price targets are trending up or down for both companies.
You can build a free watchlist to track Western Digital Corporation and Intel Corporation alongside every other stock on your radar. No credit card required. Just the data you need to decide for yourself.
Access Professional Tools to Analyze WDC and INTC stock on TIKR for Free →