Key Takeaways:
- UPS generated $88.7 billion in full-year 2025 revenue, down around 3% year over year, with operating margins compressing to around 9.6% from a peak of 14.3% in 2022. The recovery is real but slow, and management does not expect meaningful momentum until the second half of 2026.
- FedEx has delivered a genuine turnaround, with its DRIVE restructuring program generating over $2.2 billion in permanent cost savings and Q3 fiscal 2026 adjusted EPS of $5.25 coming in 27% above consensus.
- At current prices, UPS offers a 6.1% dividend yield and trades at roughly 14x forward earnings, while FedEx trades at roughly 19x with a 1.5% yield. The TIKR models imply better annualized returns on UPS, but FedEx is the one actually executing right now.
Now Live: Discover how much upside your favorite stocks could have using TIKR’s new Valuation Model (It’s free)>>>
For the first time in memory, FedEx (FDX) has surpassed UPS (UPS) in market capitalization, a fact that would have seemed improbable just a few years ago when UPS was the undisputed margin leader in logistics. The reversal reflects two companies that entered the same freight downcycle with similar problems and chose very different paths through it.
The freight market itself is still finding its footing. Volume trends softened through 2023 and 2024 as the post-pandemic e-commerce boom normalized and industrial demand stayed muted. That backdrop matters because both companies’ margin trajectories depend heavily on volume returning, and tariff-related disruptions are adding another layer of uncertainty to the timing.
Estimate a company’s fair value instantly (Free with TIKR) >>>
Two Companies, Two Very Different Turnaround Stories
At first glance, these two look like interchangeable proxies for the parcel economy, but what each does beneath the revenue line tells a more nuanced story.
UPS is in the middle of a deliberate and painful transition away from its single largest customer. Amazon accounted for roughly 11% of UPS’s total revenue and an estimated 20-25% of its U.S. domestic volume, primarily through low-margin residential deliveries. CEO Carol Tomé decided to prioritize yield improvement over volume retention.
The strategy makes long-term sense. UPS is building toward a $20 billion healthcare revenue target by the end of 2026, supported by the acquisition of Andlauer Healthcare Group, which strengthened its cold chain and pharmaceutical logistics capabilities. Network restructuring is still underway, and management has been clear that meaningful recovery of operating margin will not occur until the second half of 2026.
FedEx is delivering a faster, more visible turnaround. The DRIVE restructuring program and Network 2.0 initiative, which merged the company’s historically separate Express and Ground operations into a single integrated network, have delivered over $2.2 billion in permanent cost savings, as reflected in the numbers. The planned spin-off of FedEx Freight on June 1 removes the drag of a structurally challenged LTL segment and lets the core business be valued on its own merits.
What the TIKR Financials Charts Show
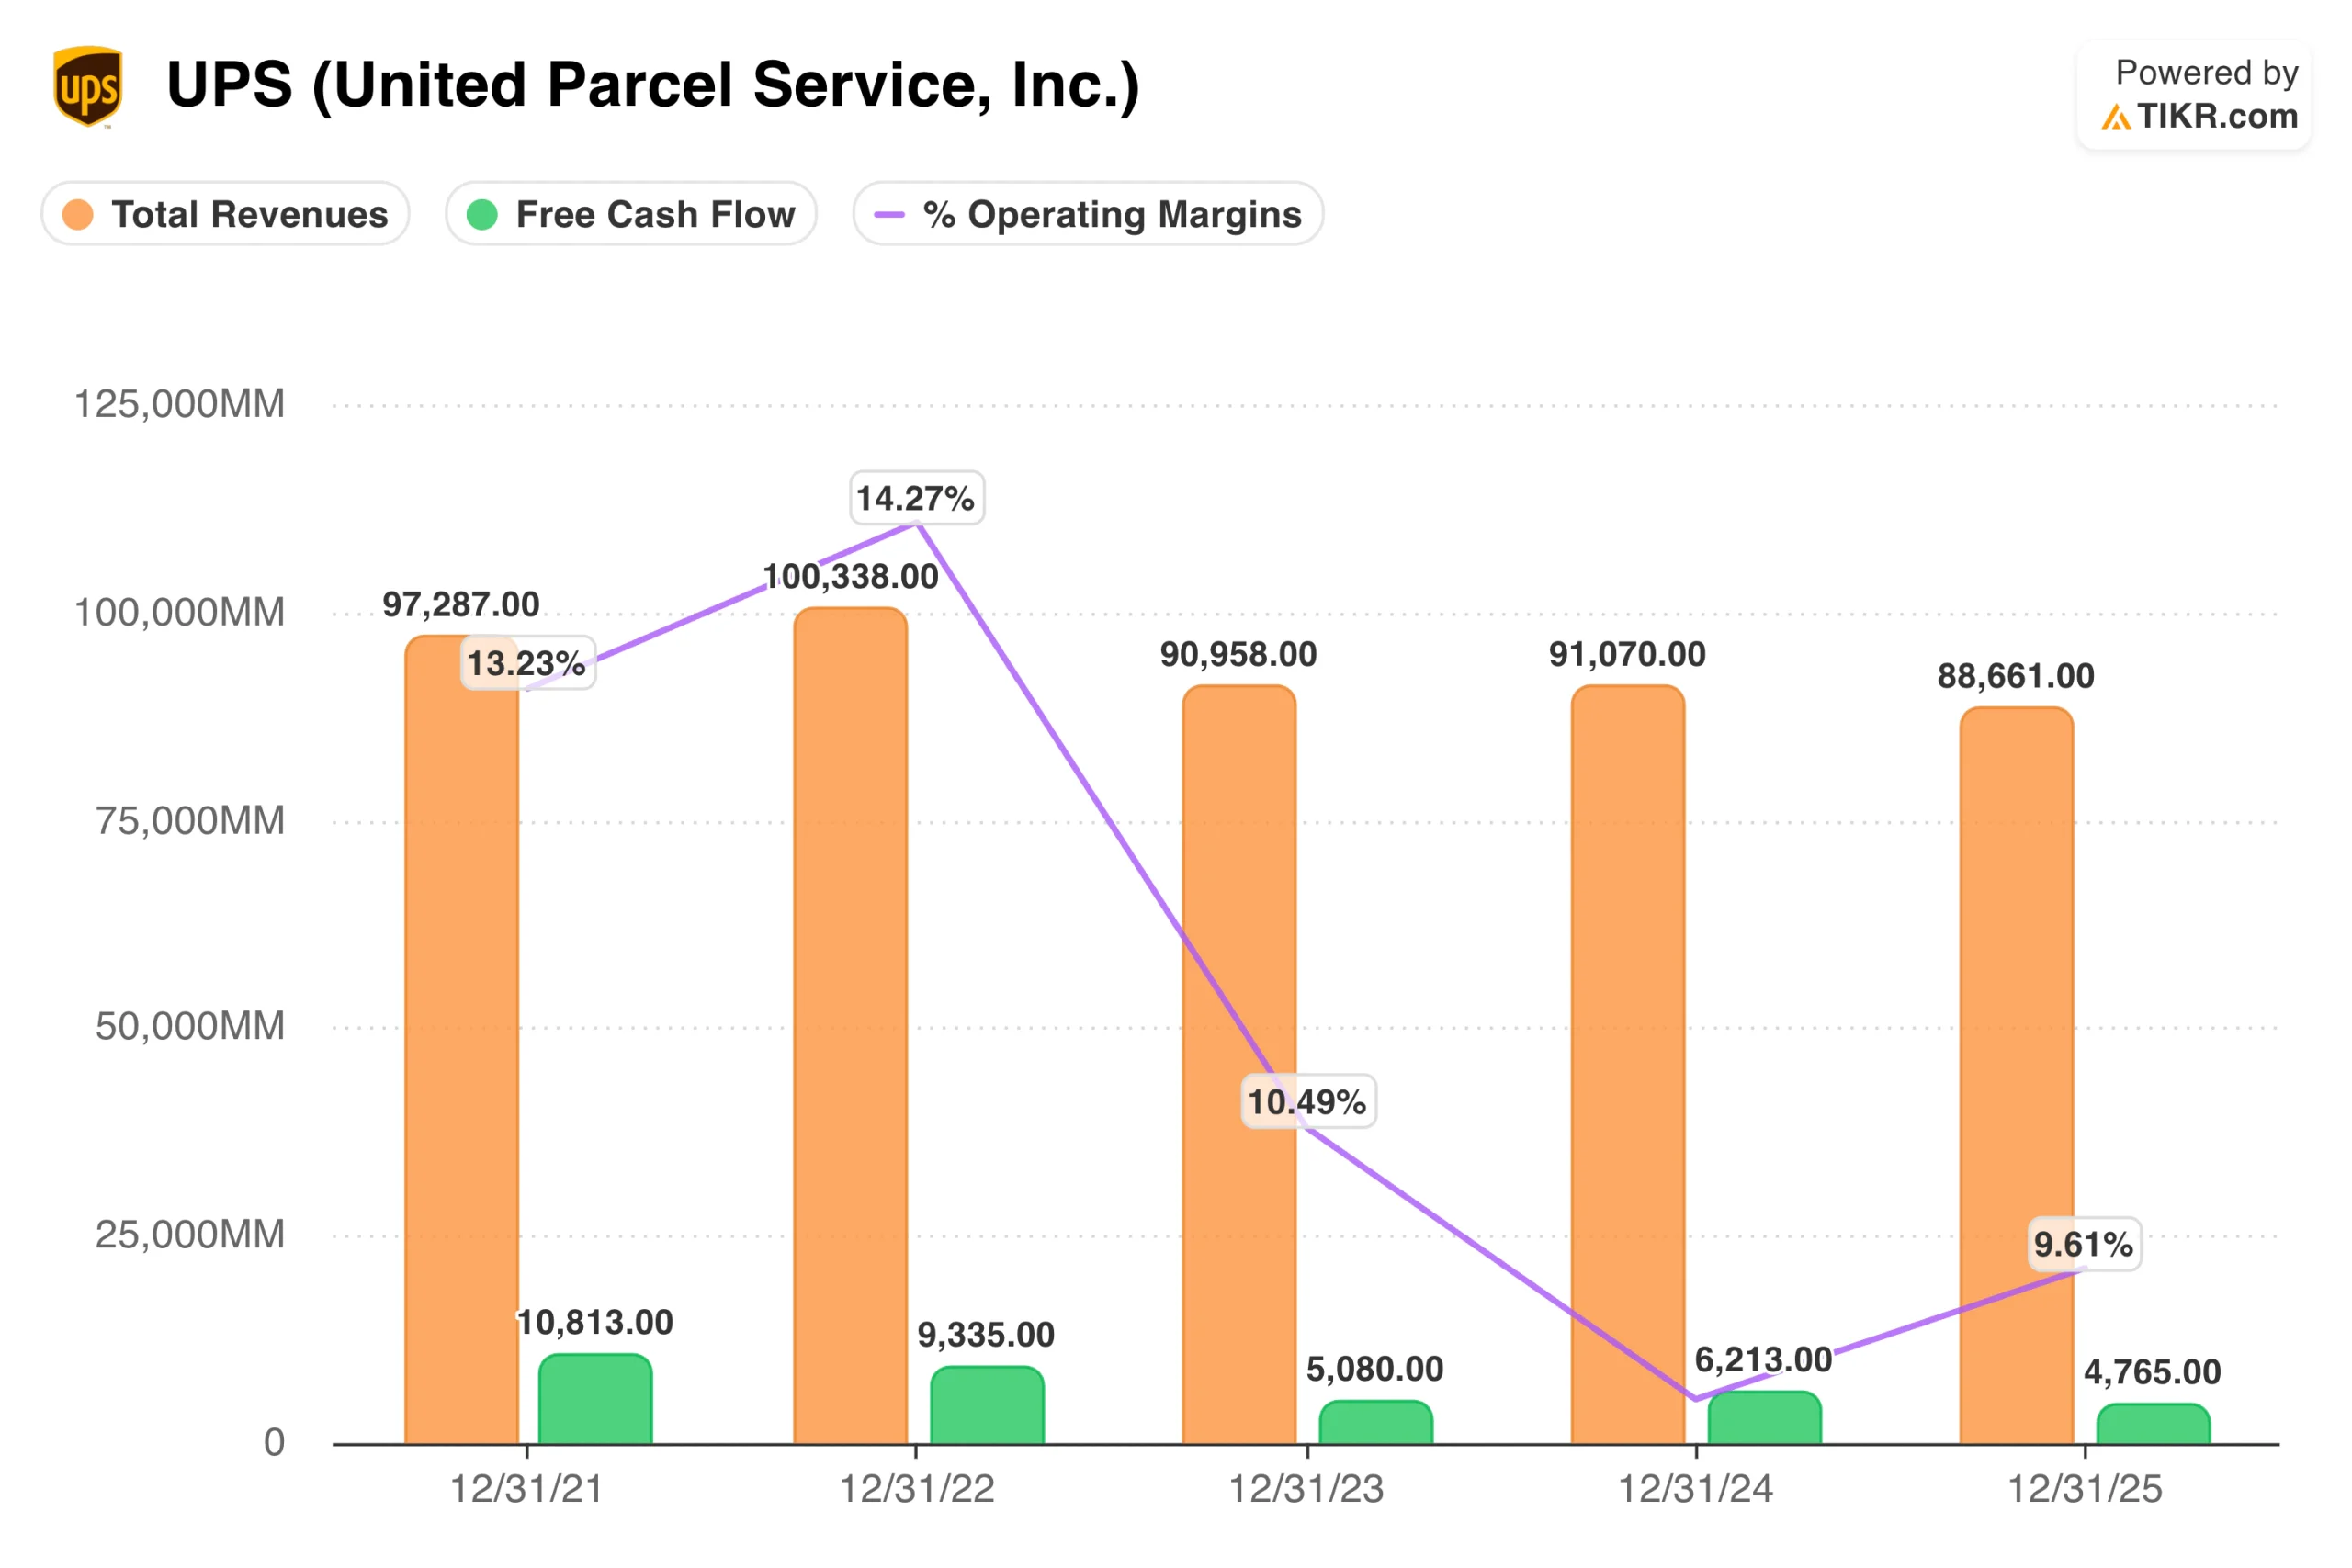
For UPS, revenue peaked at around $100 billion in 2022 and has since declined to $88.7 billion in 2025, with operating margins compressing from 14.3% at the peak to around 9.6% today. Free cash flow has followed, falling from $10.8 billion in 2021 to $4.8 billion in 2025. It is a business that over-earned during the pandemic shipping boom and is now working back toward a sustainable run rate from a lower revenue base.
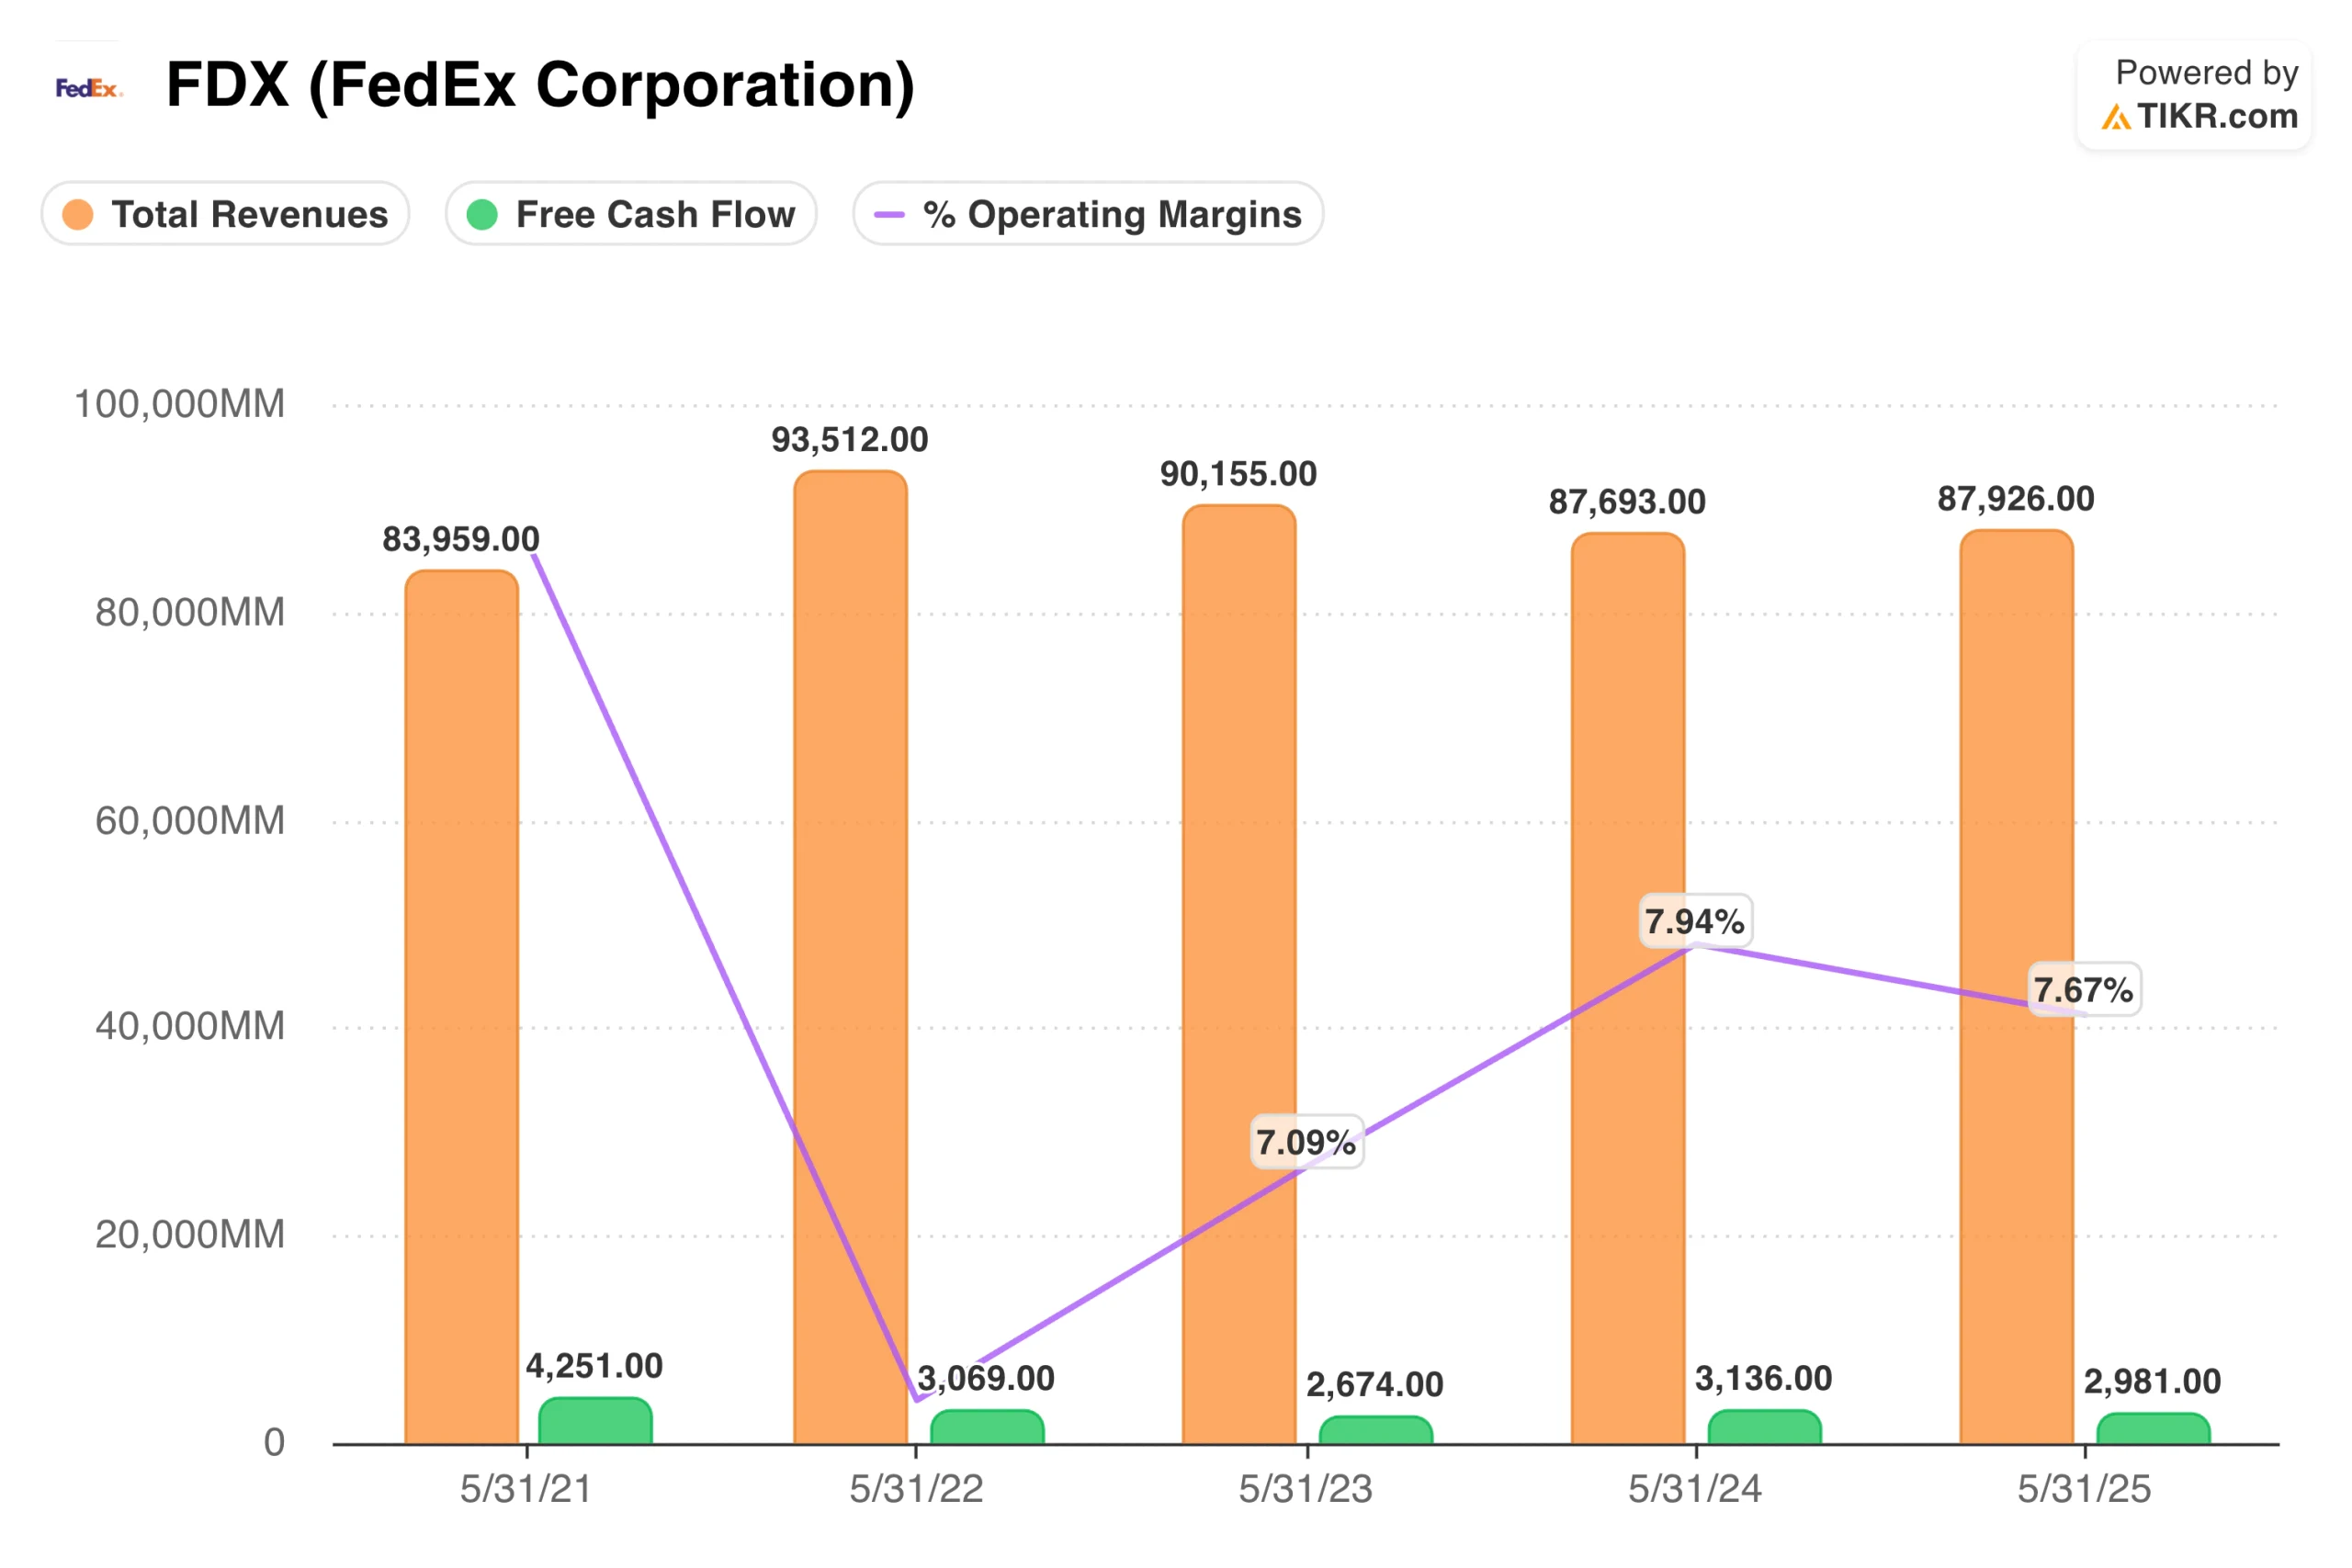
FedEx shows a similar revenue decline, from $93.5 billion in fiscal 2022 to $87.9 billion in fiscal 2025, but the operating margin line has behaved differently, recovering from a trough of around 7.1% in fiscal 2023 back toward 7.7% in fiscal 2025 and continuing to improve as Network 2.0 savings compound. Free cash flow at FedEx has historically been within a tighter range, which is why the dividend yield is lower and payout sustainability is less of a debate.
The Dividend Question
UPS currently yields around 6.1%, an unusually high yield for a large-cap industrial stock and one that reflects both the stock’s decline and the market’s skepticism about its sustainability. Full-year 2025 free cash flow came in at $4.8 billion, while dividend payments are expected to total around $5.4 billion in 2026, leaving a thin margin of safety that has raised real questions.
FedEx’s 1.5% yield is a much smaller part of the investment case, with a far more conservative payout ratio. For investors who want logistics exposure without dividend risk as a primary concern, FedEx is the cleaner setup.
See what analysts think about UPS stock right now (Free with TIKR) >>>
What Consensus Estimates Are Pricing In
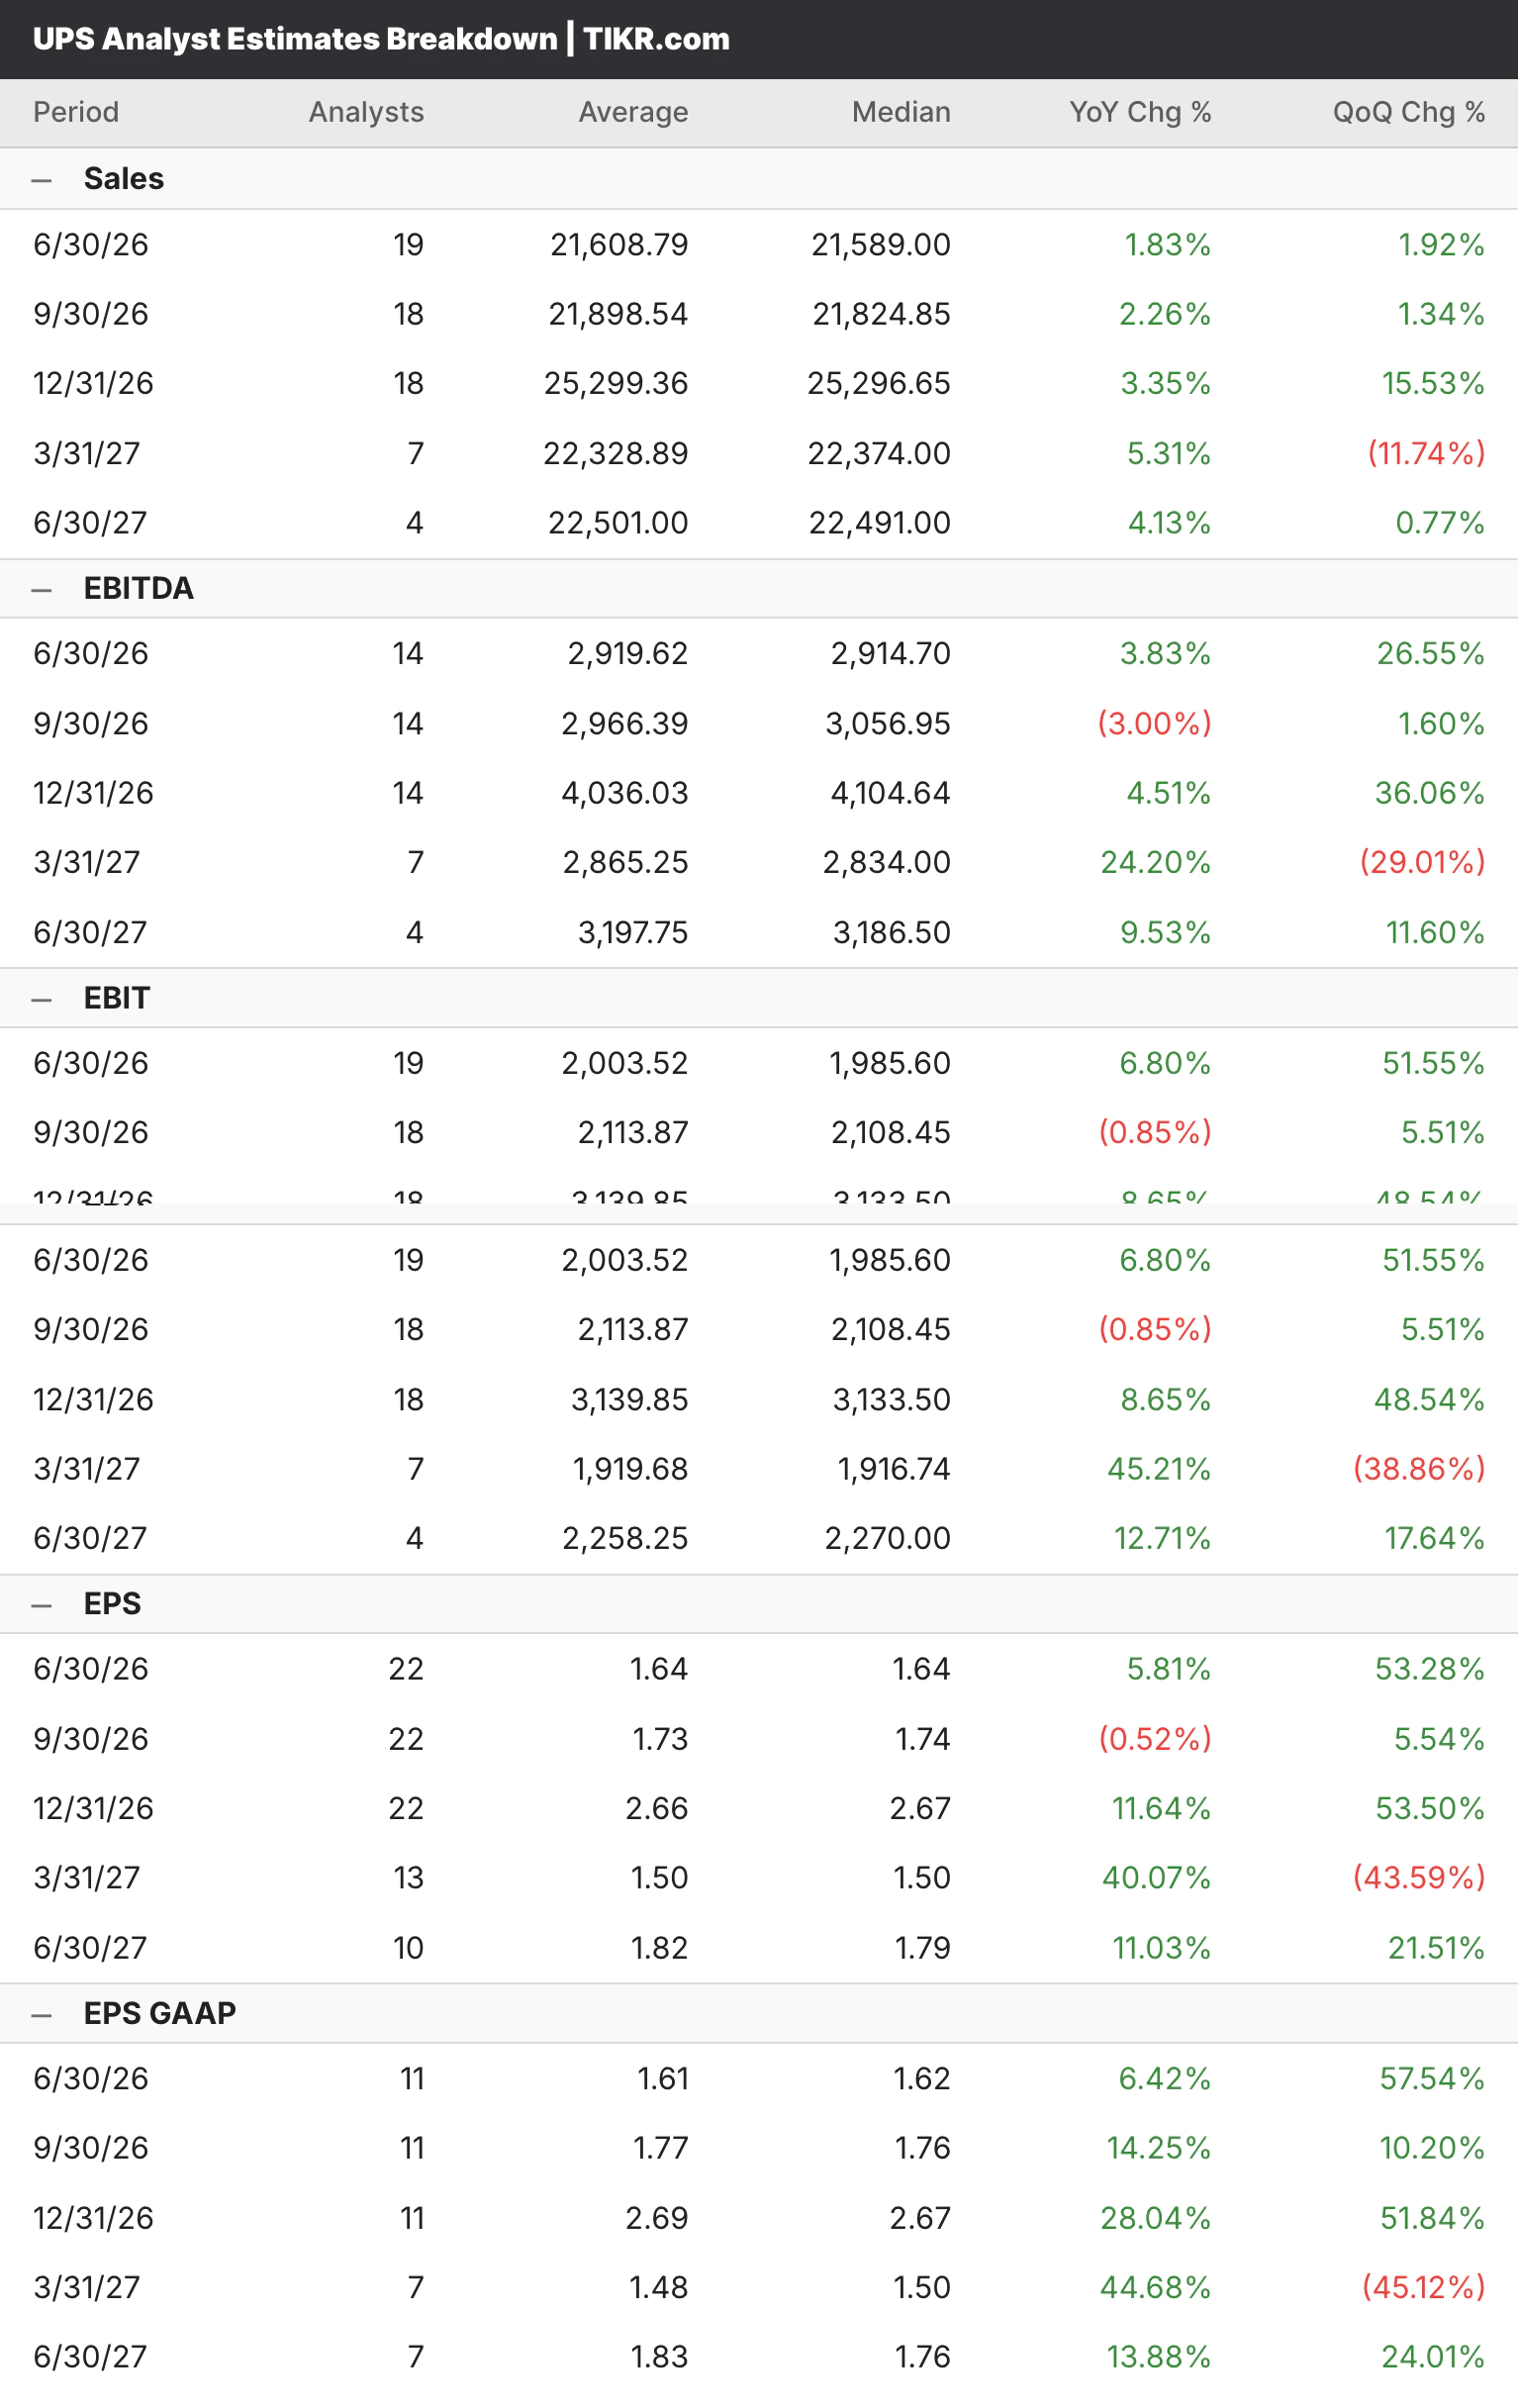
Analysts expect UPS revenue to recover modestly through 2026 and 2027, with quarterly EPS climbing from around $1.64 in Q2 toward $2.66 in Q4 as the Amazon transition completes and volume trends normalize. The recovery is back-half weighted, meaning investors buying today are largely betting on an inflection that has not fully arrived yet.
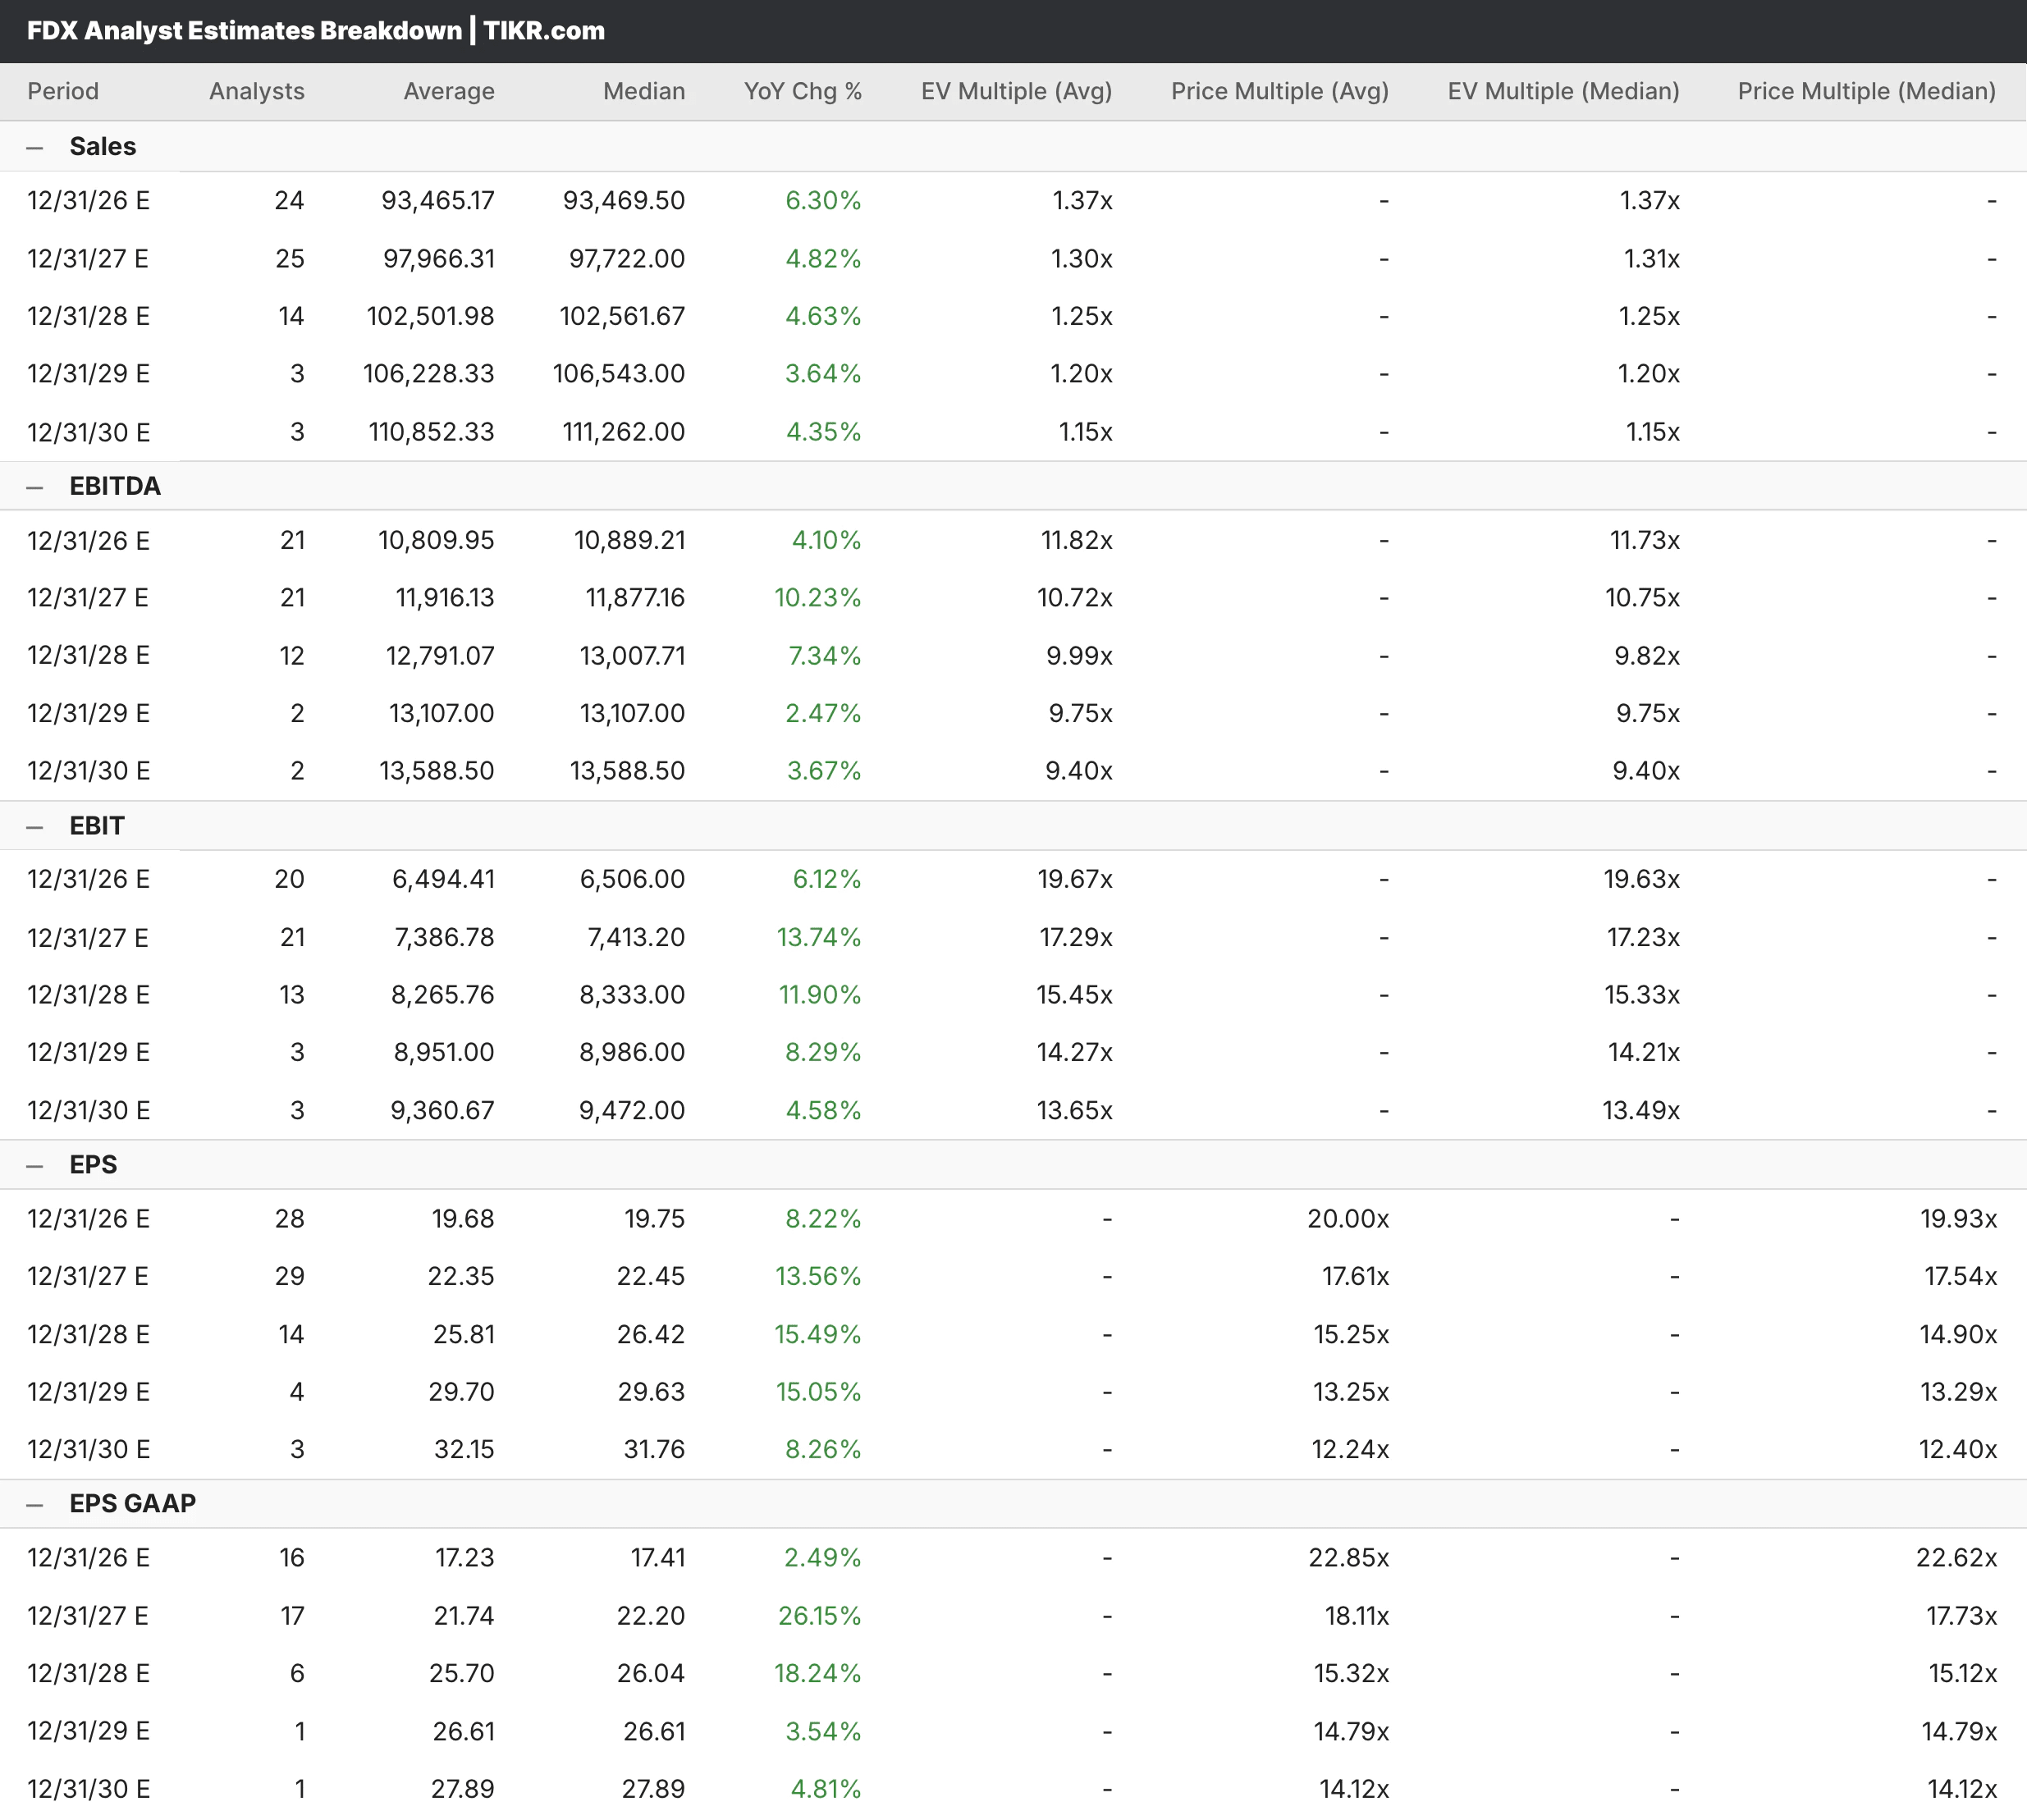
For FedEx, analysts expect full-year revenue of around $93.5 billion in 2026, growing around 6%, with EPS of around $19.75 growing to around $22.45 in 2027 as Network 2.0 savings continue compounding. Major banks have been raising price targets aggressively, with JPMorgan moving to $424 and Deutsche Bank reiterating a buy with a $479 target.
See analysts’ full growth forecasts and estimates for FedEx stock (It’s free) >>>
What the TIKR Models Say
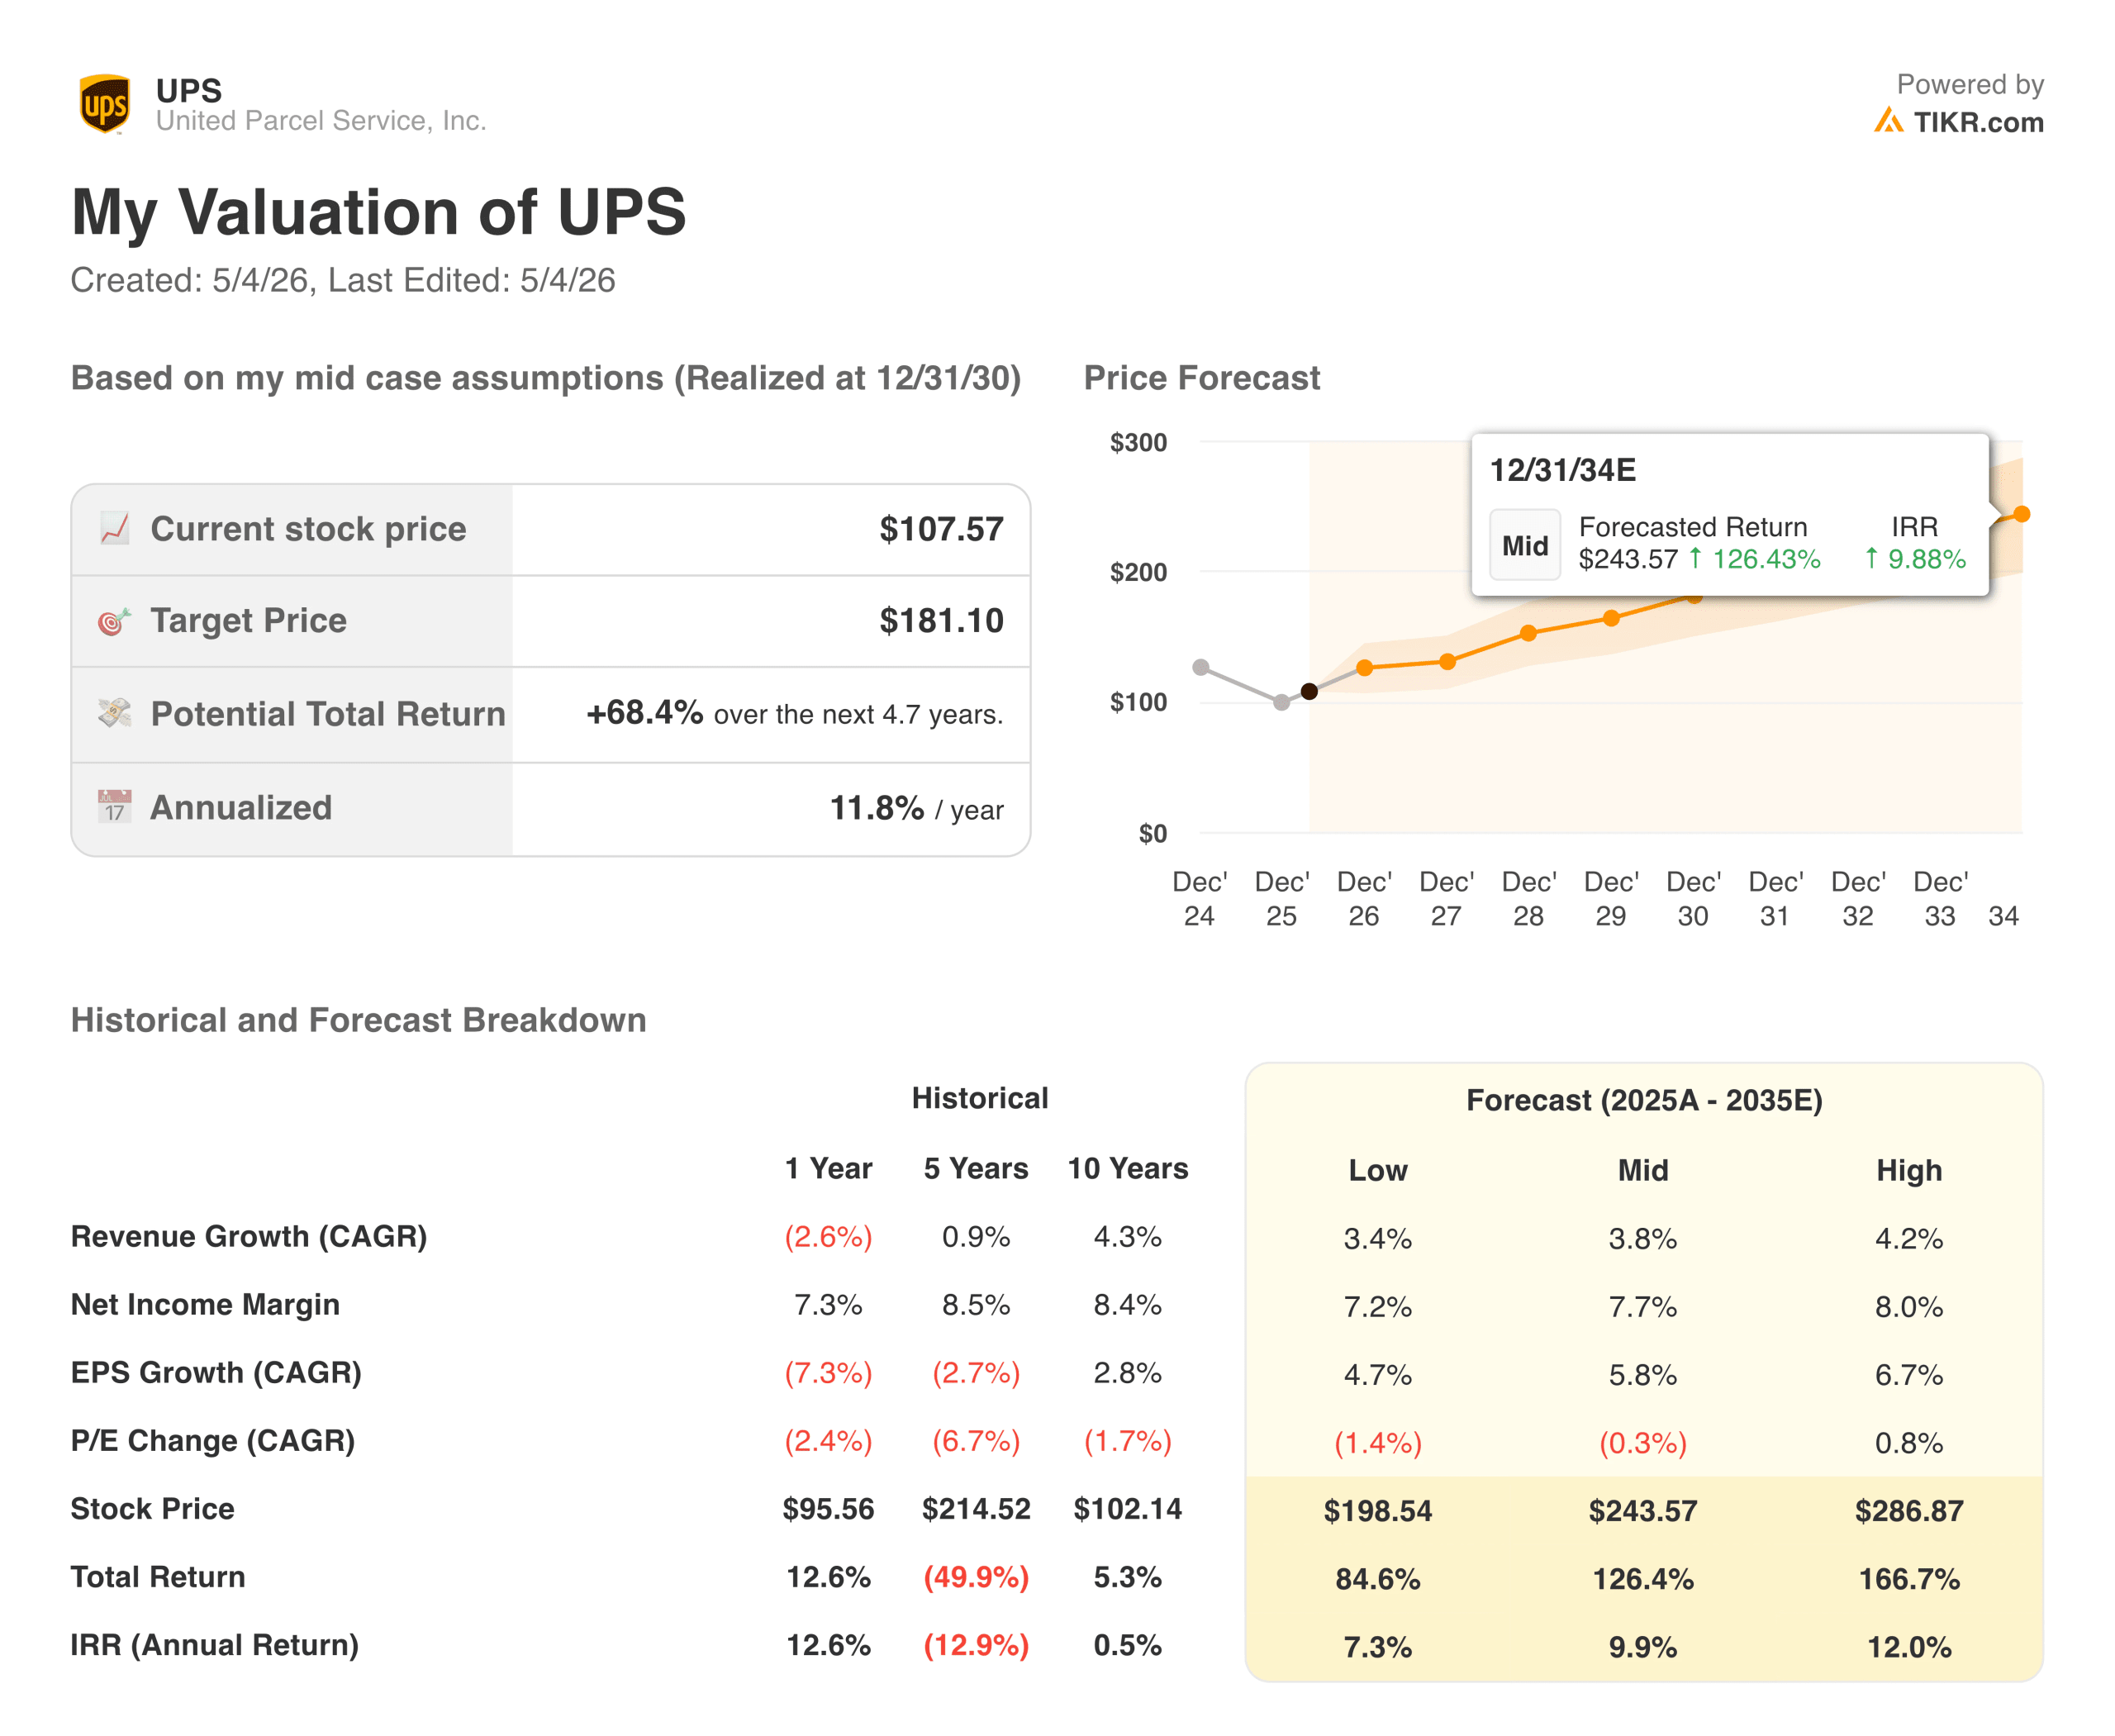
The TIKR model for UPS targets around $181, implying roughly 68% upside from the current price of around $108 and an annualized return of nearly 12% per year. The mid-case assumes modest revenue growth of around 4% annually and net income margins recovering toward 7.7%, both achievable if the volume recovery materializes on the timeline management is guiding toward.
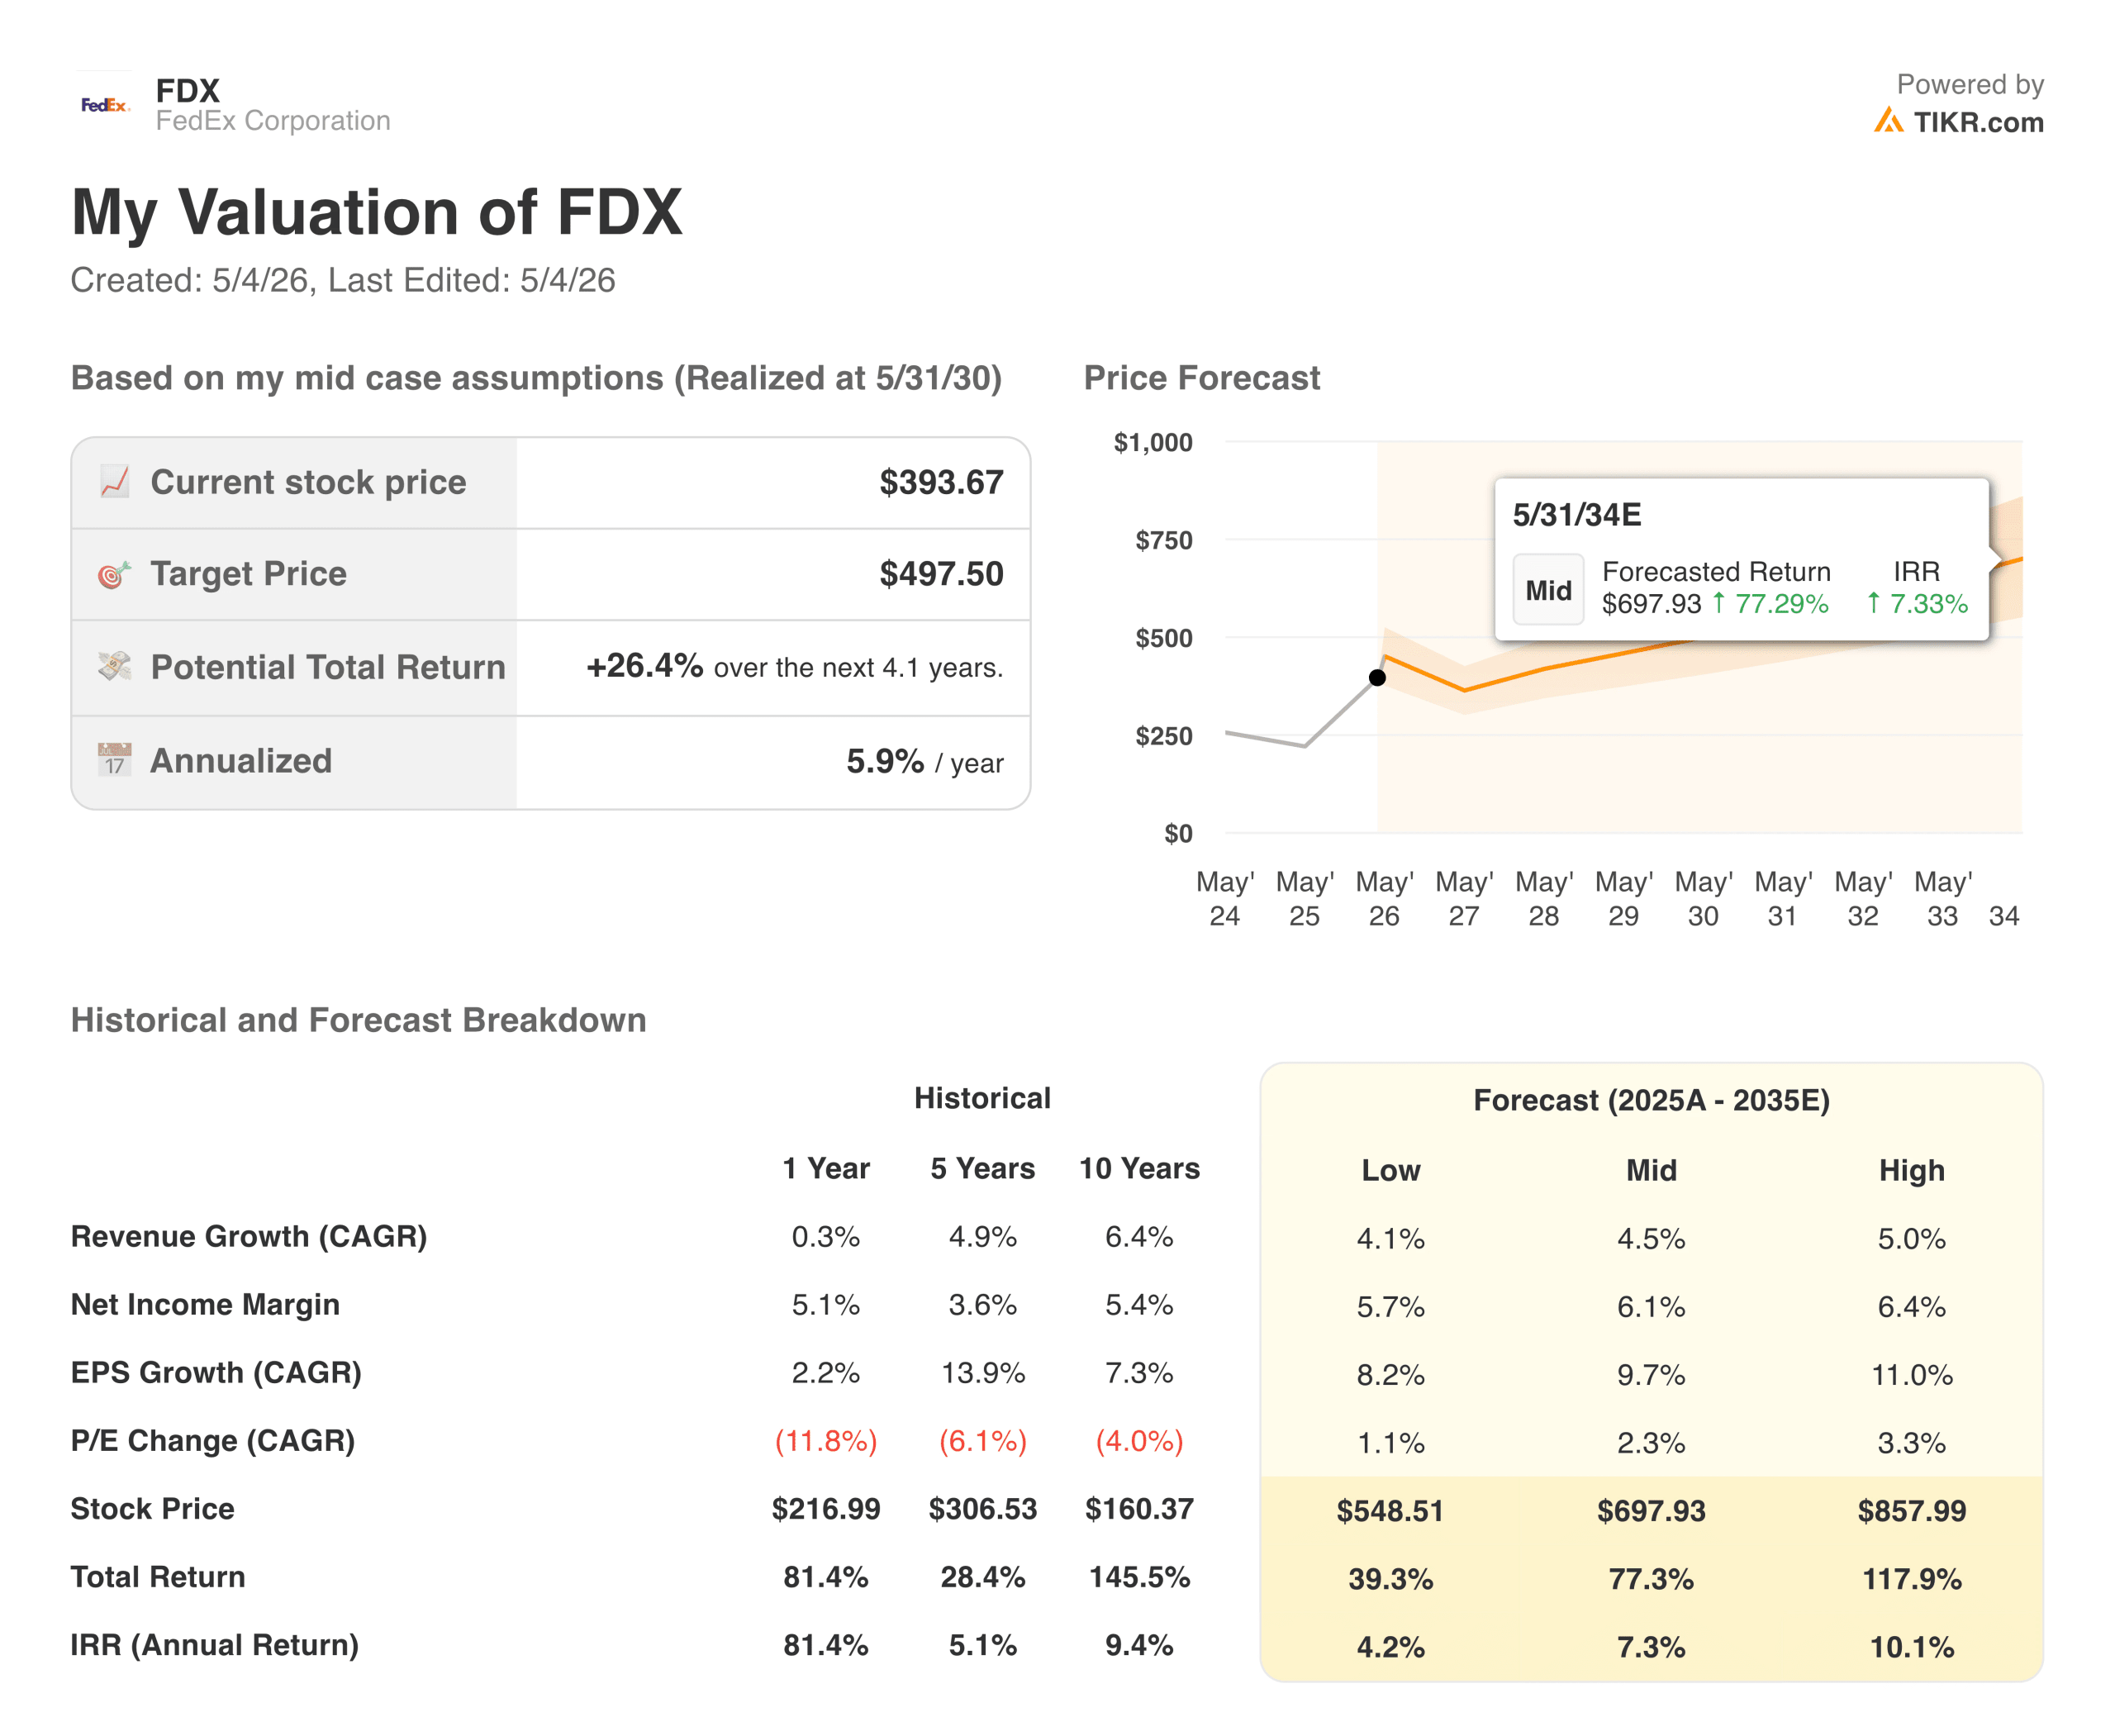
The TIKR model for FedEx targets around $498, implying 26% upside from the current price of roughly $394 and an annualized return of around 6%. The more modest implied return reflects the reality that FedEx’s turnaround is already well recognized, and a meaningful portion of the good news is already sitting in the stock price.
The Bottom Line for Investors
FedEx is executing, and the DRIVE program is working, the Network 2.0 integration is delivering ahead of schedule, and the Freight spin-off is a near-term catalyst that could unlock further value. If you want the logistics company that has already demonstrated it can deliver on a restructuring promise, FedEx is it, even if much of that story is reflected in the multiple.
UPS is the patient bet for investors as the dividend yield is high enough to pay you to wait, the TIKR model implies better annualized returns from current prices, and the healthcare and SMB strategy is sound even if the timeline is longer than investors would like. The risk is that the recovery takes longer than expected and the dividend coverage becomes a real problem rather than just a theoretical one.
What both share is leverage to a freight market recovery that has not fully arrived, which means either stock could look meaningfully different a year from now, depending on how global trade volumes evolve.
Build your own Valuation Model to value any stock (It’s free!) >>>
How Much Upside Does Each Stock Have From Here?
With TIKR’s new Valuation Model tool, you can estimate a stock’s potential share price in under a minute.
All it takes is three simple inputs:
- Revenue Growth
- Operating Margins
- Exit P/E Multiple
If you’re not sure what to enter, TIKR automatically fills in each input using analysts’ consensus estimates, giving you a quick, reliable starting point.
From there, TIKR calculates the potential share price and total returns under Bull, Base, and Bear scenarios so you can quickly see whether a stock looks undervalued or overvalued.
See a stock’s true value in under 60 seconds (Free with TIKR) >>>
Looking for New Opportunities?
- See what stocks billionaire investors are buying so you can follow the smart money.
- Analyze stocks in as little as 5 minutes with TIKR’s all-in-one, easy-to-use platform.
- The more rocks you overturn… the more opportunities you’ll uncover. Search 100K+ global stocks, global top investor holdings, and more with TIKR.
Disclaimer:
Please note that the articles on TIKR are not intended to serve as investment or financial advice from TIKR or our content team, nor are they recommendations to buy or sell any stocks. We create our content based on TIKR Terminal’s investment data and analysts’ estimates. Our analysis might not include recent company news or important updates. TIKR has no position in any stocks mentioned. Thank you for reading, and happy investing!