
Key Stats for Block Stock
- Current Price: $72.33
- Target Price (Mid): ~$146
- Street Target: ~$90
- Potential Total Return: ~100%
- Annualized IRR: ~16% / year
- Earnings Reaction: +6.72% (5/7/26)
Now Live: Discover how much upside your favorite stocks could have using TIKR’s new Valuation Model (It’s free) >>>
What Happened?
Block (XYZ) investors got exactly what they were hoping for this week. The stock rose 6.72% on May 7 after Block posted record adjusted margins and raised its full-year guidance for the second consecutive quarter. Bulls read it as confirmation that a leaner Block is a structurally more profitable one. Bears point to a large GAAP net loss and an ongoing Department of Justice inquiry as evidence that the adjusted numbers obscure real complexity. The question investors are now debating: has Block’s AI-driven transformation already been priced in, or is the real compounding only beginning?
From a Payments Company to an Intelligence Company
The earnings beat is the headline. The more important story is what CEO Jack Dorsey said about where Block is actually going.
“I believe we evolve into an intelligence company,” Dorsey said on the call. “We’re looking deeply at our understanding of our sellers and our Cash App customers and delivering them exactly what they need at the right moment.” Block now has working products to support that claim.
Moneybot, Block’s AI financial assistant inside Cash App, reached general availability in Q1 and drew 1 million active users in a single week with no in-app or external marketing. According to business lead Owen Jennings, more than one-third of customers making a money movement through Moneybot are attaching to a net-new product in the process, a free cash flow opportunity buried inside an engagement metric.
Managerbot, the AI assistant for Square sellers, has crossed 1 million active sellers and is on track to reach all Square sellers by June. Jennings said retention has “surprised to the upside,” with sellers returning at high rates after their first session. Each seller gets more than 100 AI agents acting on their behalf, pulling sales data, flagging revenue trends, and automating routine tasks. That stickiness matters directly for Square’s gross profit retention.
The internal velocity numbers back up the product story. Production code changes per engineer increased more than 2.5 times from January to April, and non-engineer code contributions were up nearly 60% over the same period, per CFO Amrita Ahuja on the earnings call. Jennings illustrated the shift with a concrete example: a Buy Now, Pay Later integration for Cash App Pay (Block’s merchant payment link, allowing consumers to pay in installments at checkout) that was scoped for three months and five engineers, and was built by two engineers in three to four weeks.
See historical and forward estimates for Block stock (It’s free!) >>>
The Neighborhoods Flywheel
Neighborhoods may be the growth driver the market is most underestimating.
The program connects Cash App consumers to Square merchants through a loyalty and discovery feed, letting sellers build a Cash App follower base that receives targeted offers. As of March 2026, Neighborhoods had reached $320 million in annualized gross payment volume (GPV), the total value of card transactions processed through Block’s platform, up 190% since December. In April alone, Block added more sellers to Neighborhoods than in the product’s entire prior history.
What makes the data compelling is the network effect. Jennings noted on the call that followers from Neighborhoods account for roughly 10% of a seller’s total GPV within a few quarters of enrollment. About half of those followers were not active Cash App users in the month before joining, meaning Neighborhoods is expanding Block’s network, not just recycling it. This is exactly the kind of economic moat competitors cannot easily replicate: a closed loop that monetizes both sides of the counter using infrastructure Block already owns.
Management said Neighborhoods will be more than a “rounding error” for Cash App monthly transacting actives in the second half of 2026. With actives growing only in the low-single-digit range recently, any acceleration would be a meaningful re-rating catalyst.
Strong Adjusted Results, Real Risks Underneath
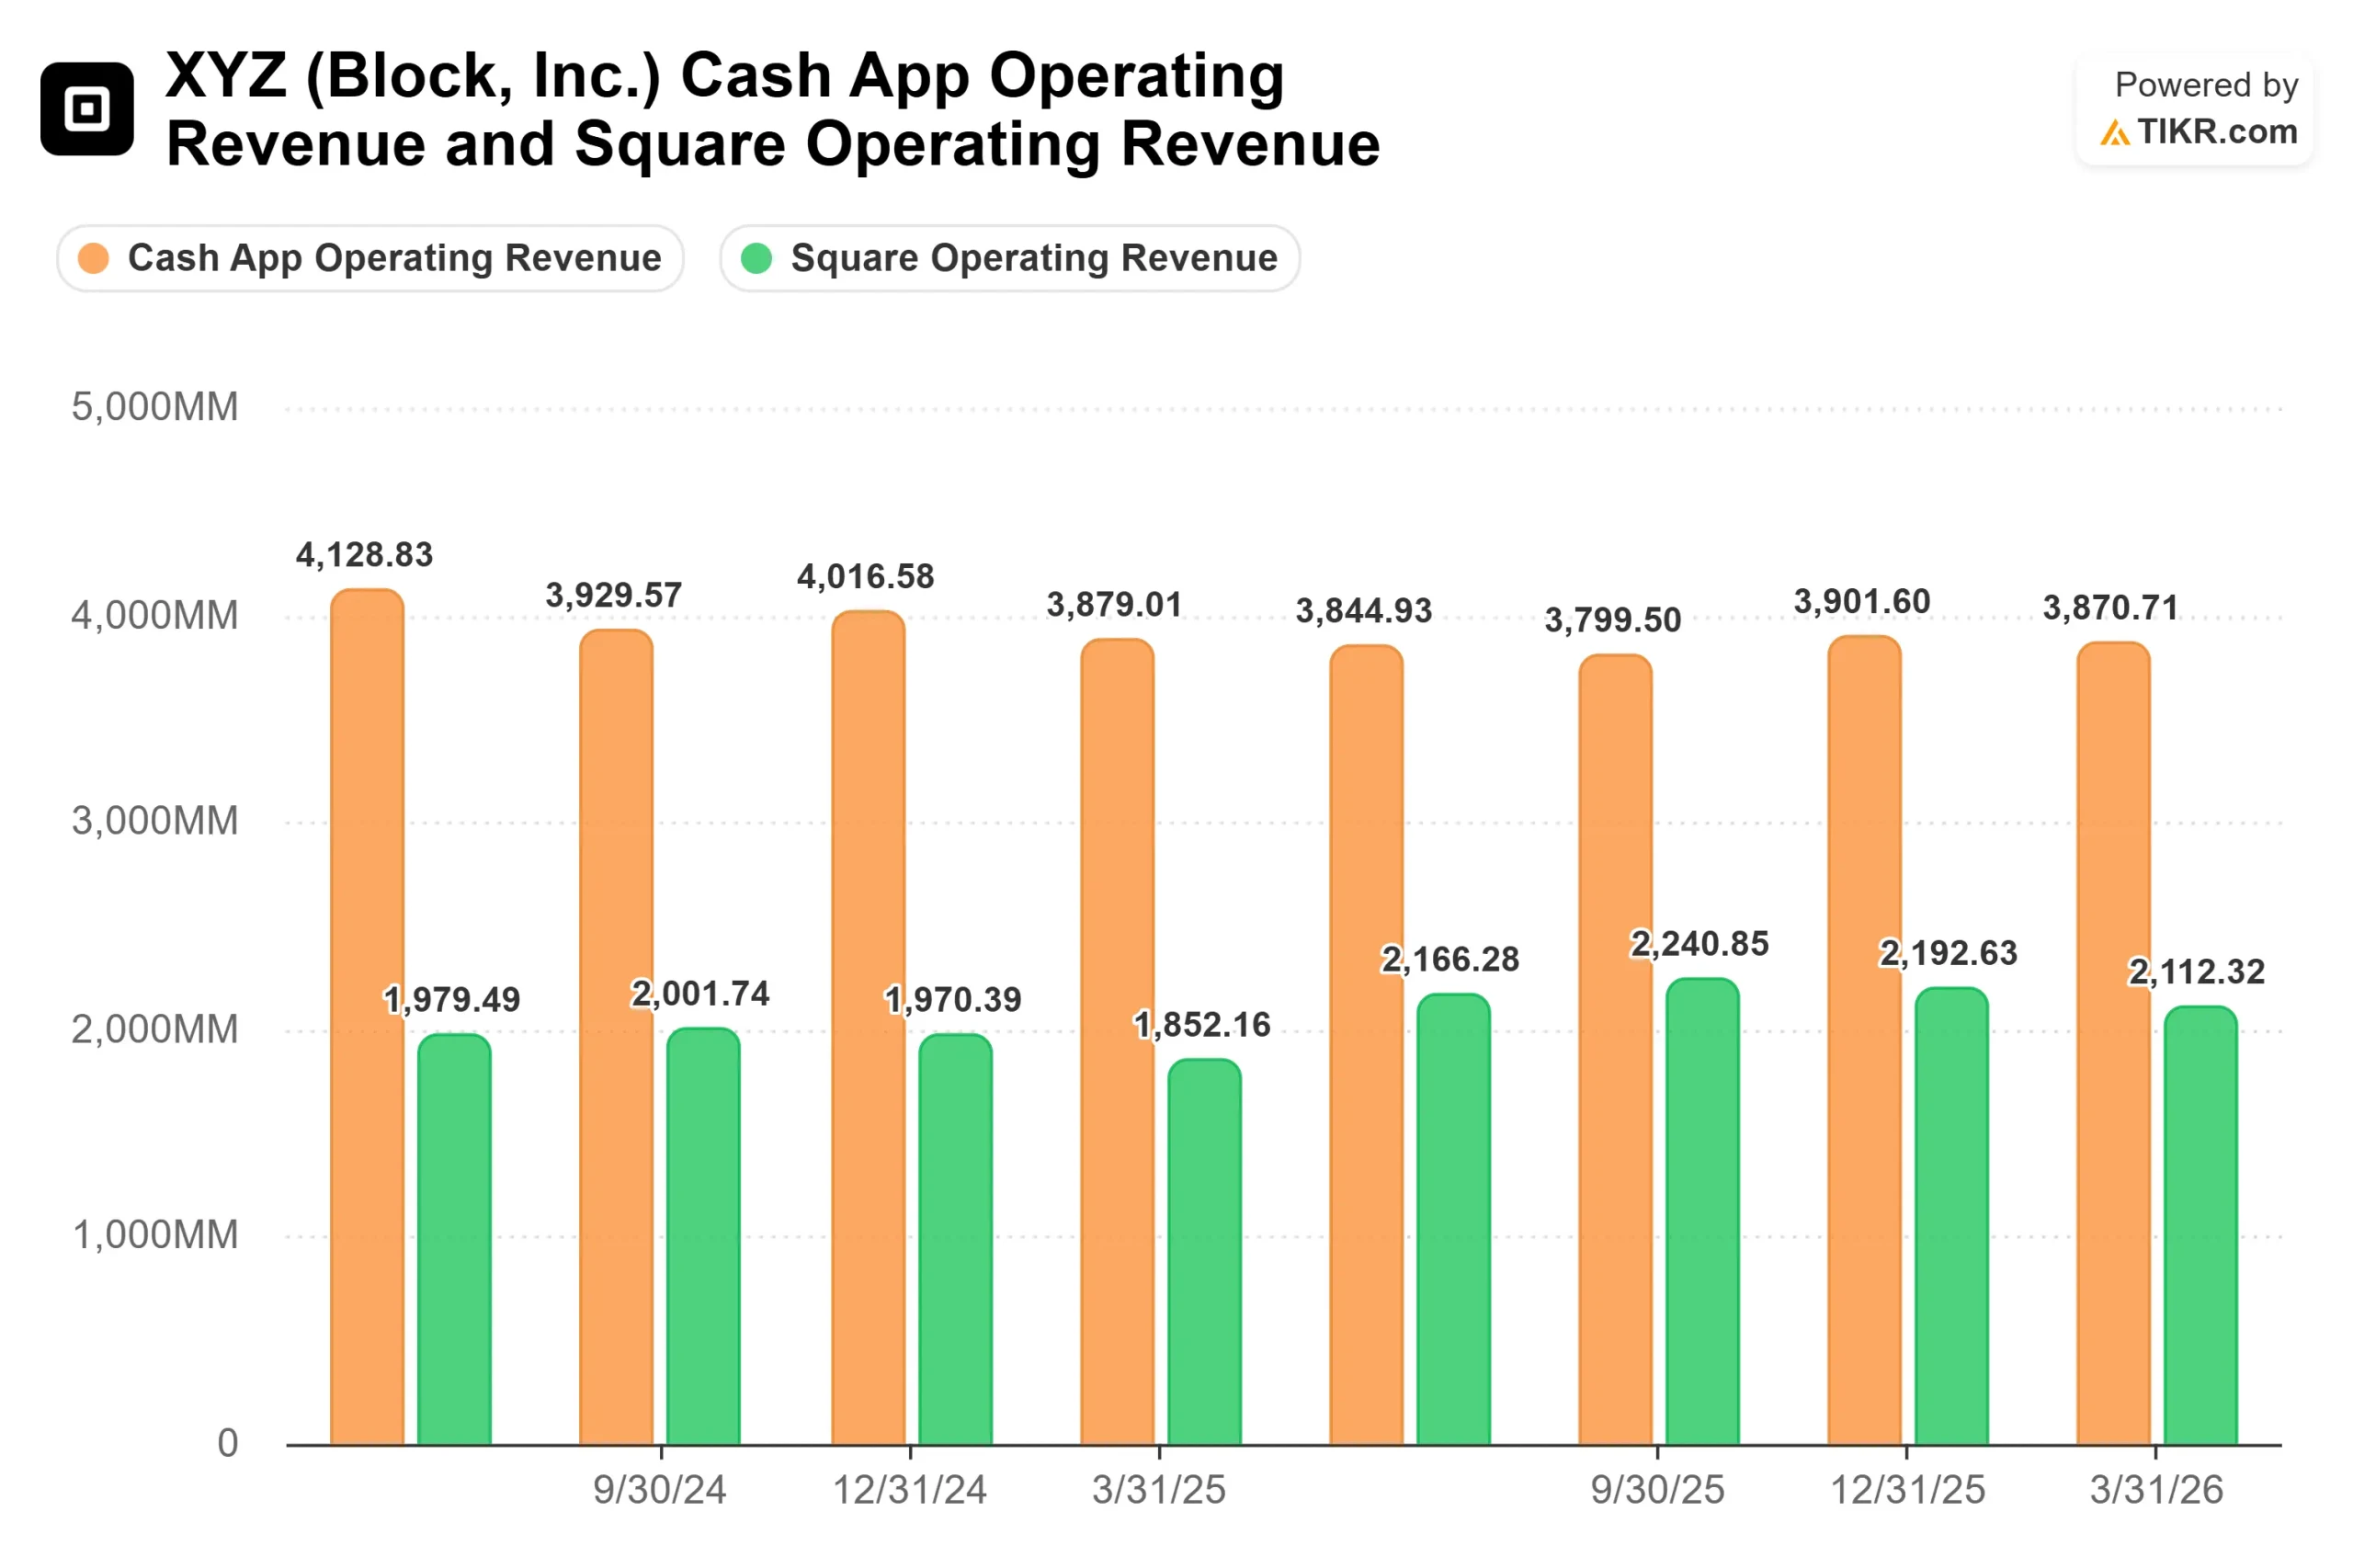
The Q1 numbers were strong on an adjusted basis. Gross profit grew 27% year-over-year to $2.91 billion, driven by 38% growth in Cash App and 9% in Square. Adjusted operating income rose 56% to $728 million at a record 25% margin. Adjusted diluted EPS reached $0.85, up 52% and well ahead of the $0.68 consensus estimate per TIKR. Block then raised full-year 2026 guidance to $12.33 billion in gross profit (19% growth), $3.34 billion in adjusted operating income at a 27% margin, and $3.85 in adjusted diluted EPS, representing 62% growth year-over-year.
The GAAP picture carries real weight. According to Block’s Q1 2026 earnings release, the company posted a net loss driven by large restructuring charges tied to its workforce reduction of more than 40% and elevated transaction and consumer receivable losses. Block also accrued $240 million for a potential resolution of an ongoing DOJ inquiry related to Cash App compliance practices, disclosing that ultimate losses could exceed that amount and be material. That is not a footnote; it is a live legal overhang that investors should carry in every valuation discussion.
Beyond the legal risk, Block’s growth depends on Borrow (its short-term consumer lending product) normalizing without disrupting margins. Consumer lending originations grew 82% year-over-year in Q1. Ahuja confirmed on the call that this rate will normalize as the product laps strong prior-year comparisons in the back half of 2026. Whether loss rates in newer borrower cohorts stay within targets, the newest cohort ran at 3.16% versus 2.67% for customers with 13-plus months on the platform, will determine whether Cash App’s free cash flow trajectory holds.
See how Block performs against its peers in TIKR (It’s free!) >>>
TIKR Advanced Model Analysis
- Current Price: $72.33
- Target Price (Mid): ~$146
- Potential Total Return: ~100%
- Annualized IRR: ~16% / year
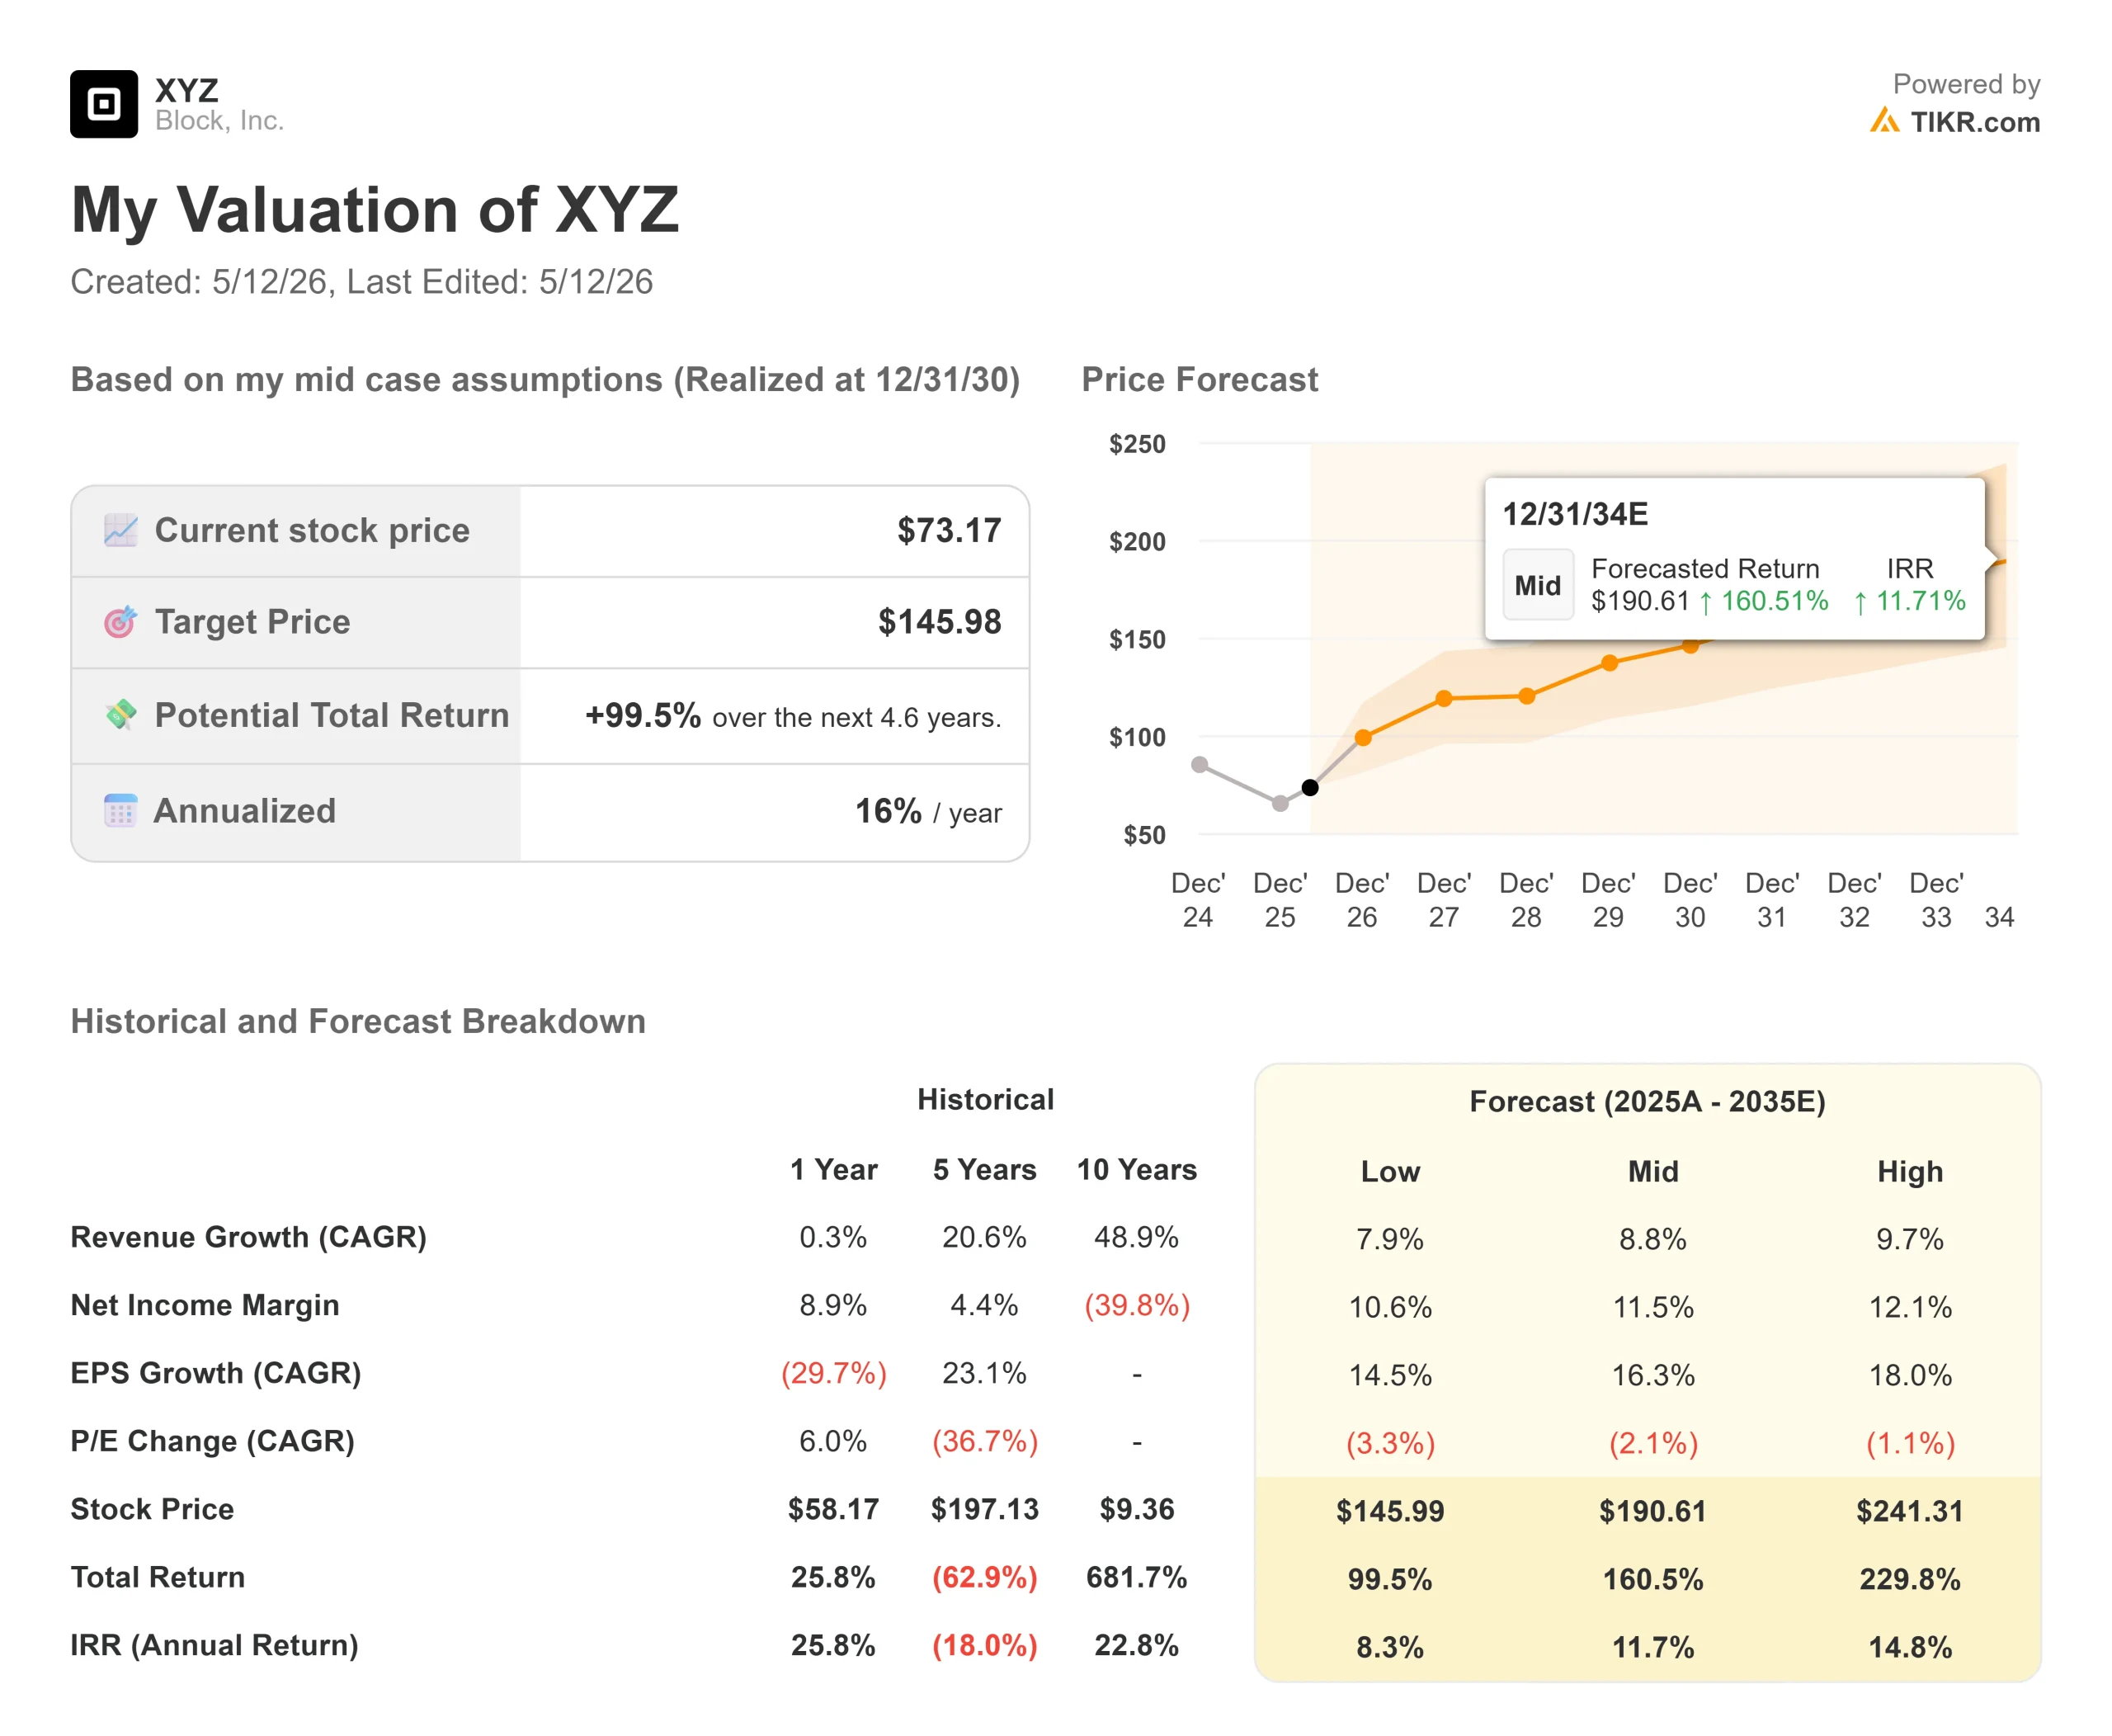
See analysts’ growth forecasts and price targets for Block stock (It’s free!) >>>
The TIKR mid-case builds on a revenue CAGR of around 9% through 2030, conservative relative to the 27% gross profit growth Block just posted. The two revenue drivers are Cash App’s lending and commerce ecosystem deepening across its roughly 59 million monthly transacting actives, and Square’s diversified go-to-market channels (field sales, ISO partnerships, Neighborhoods) sustaining GPV growth in the low-to-mid-teens range into 2027 and 2028, consistent with management’s Investor Day guidance. The margin driver is operating leverage: Block just converted 27% gross profit growth into 56% adjusted operating income growth, and the model assumes that conversion ratio moderates but continues.
The primary risk is credit. If macro conditions push newer Borrow cohort loss rates meaningfully above current levels, variable profit margins compress, and the free cash flow expansion the model assumes stalls. The high case, with revenue growing around 10% and margins of around 12%, implies approximately $241 by 2030. The mean Street target sits at around $90, implying around 24% upside less than a quarter of what the TIKR mid-case implies by 2030.
Conclusion
The metric to watch at Q2 2026, expected around August 2026, is Cash App monthly transacting actives. Management guided for low-single-digit growth through year-end and said Neighborhoods will begin moving that number meaningfully in the second half. If actives growth accelerates above 5% year-over-year by Q3, the Neighborhoods flywheel thesis gains real credibility. If it stalls, the bear case is that Block can grow profit faster than revenue, but cannot grow its network gains traction. Block just proved the first half of that equation. The second half is what the rest of 2026 is for.
See what stocks billionaire investors are buying so you can follow the smart money with TIKR.
Should You Invest in Block?
The only way to really know is to look at the numbers yourself. TIKR gives you free access to the same institutional-quality financial data that professional analysts use to answer exactly that question.
Pull up Block, and you’ll see years of historical financials, what Wall Street analysts expect for revenue and earnings in the quarters ahead, how valuation multiples have moved over time, and whether price targets are trending up or down.
You can build a free watchlist to track Block alongside every other stock on your radar. No credit card required. Just the data you need to decide for yourself.
Looking for New Opportunities?
- See what stocks billionaire investors are buying so you can follow the smart money.
- Analyze stocks in as little as 5 minutes with TIKR’s all-in-one, easy-to-use platform.
- The more rocks you overturn… the more opportunities you’ll uncover. Search 100K+ global stocks, global top investor holdings, and more with TIKR.
Disclaimer:
Please note that the articles on TIKR are not intended to serve as investment or financial advice from TIKR or our content team, nor are they recommendations to buy or sell any stocks. We create our content based on TIKR Terminal’s investment data and analysts’ estimates. Our analysis might not include recent company news or important updates. TIKR has no position in any stocks mentioned. Thank you for reading, and happy investing!