Key Stats for Dollar General Stock
- Current Price: $104.63
- 52-Week Range: $86.25 – $158.23
- Street Target (Mean): ~$146
- Target Price (Mid, TIKR Model): ~$176
- Potential Total Return (Mid): ~68%
- Annualized IRR (Mid): ~12% / year
- Earnings Reaction (Q4 FY2025, reported 3/12/26): -3.02%
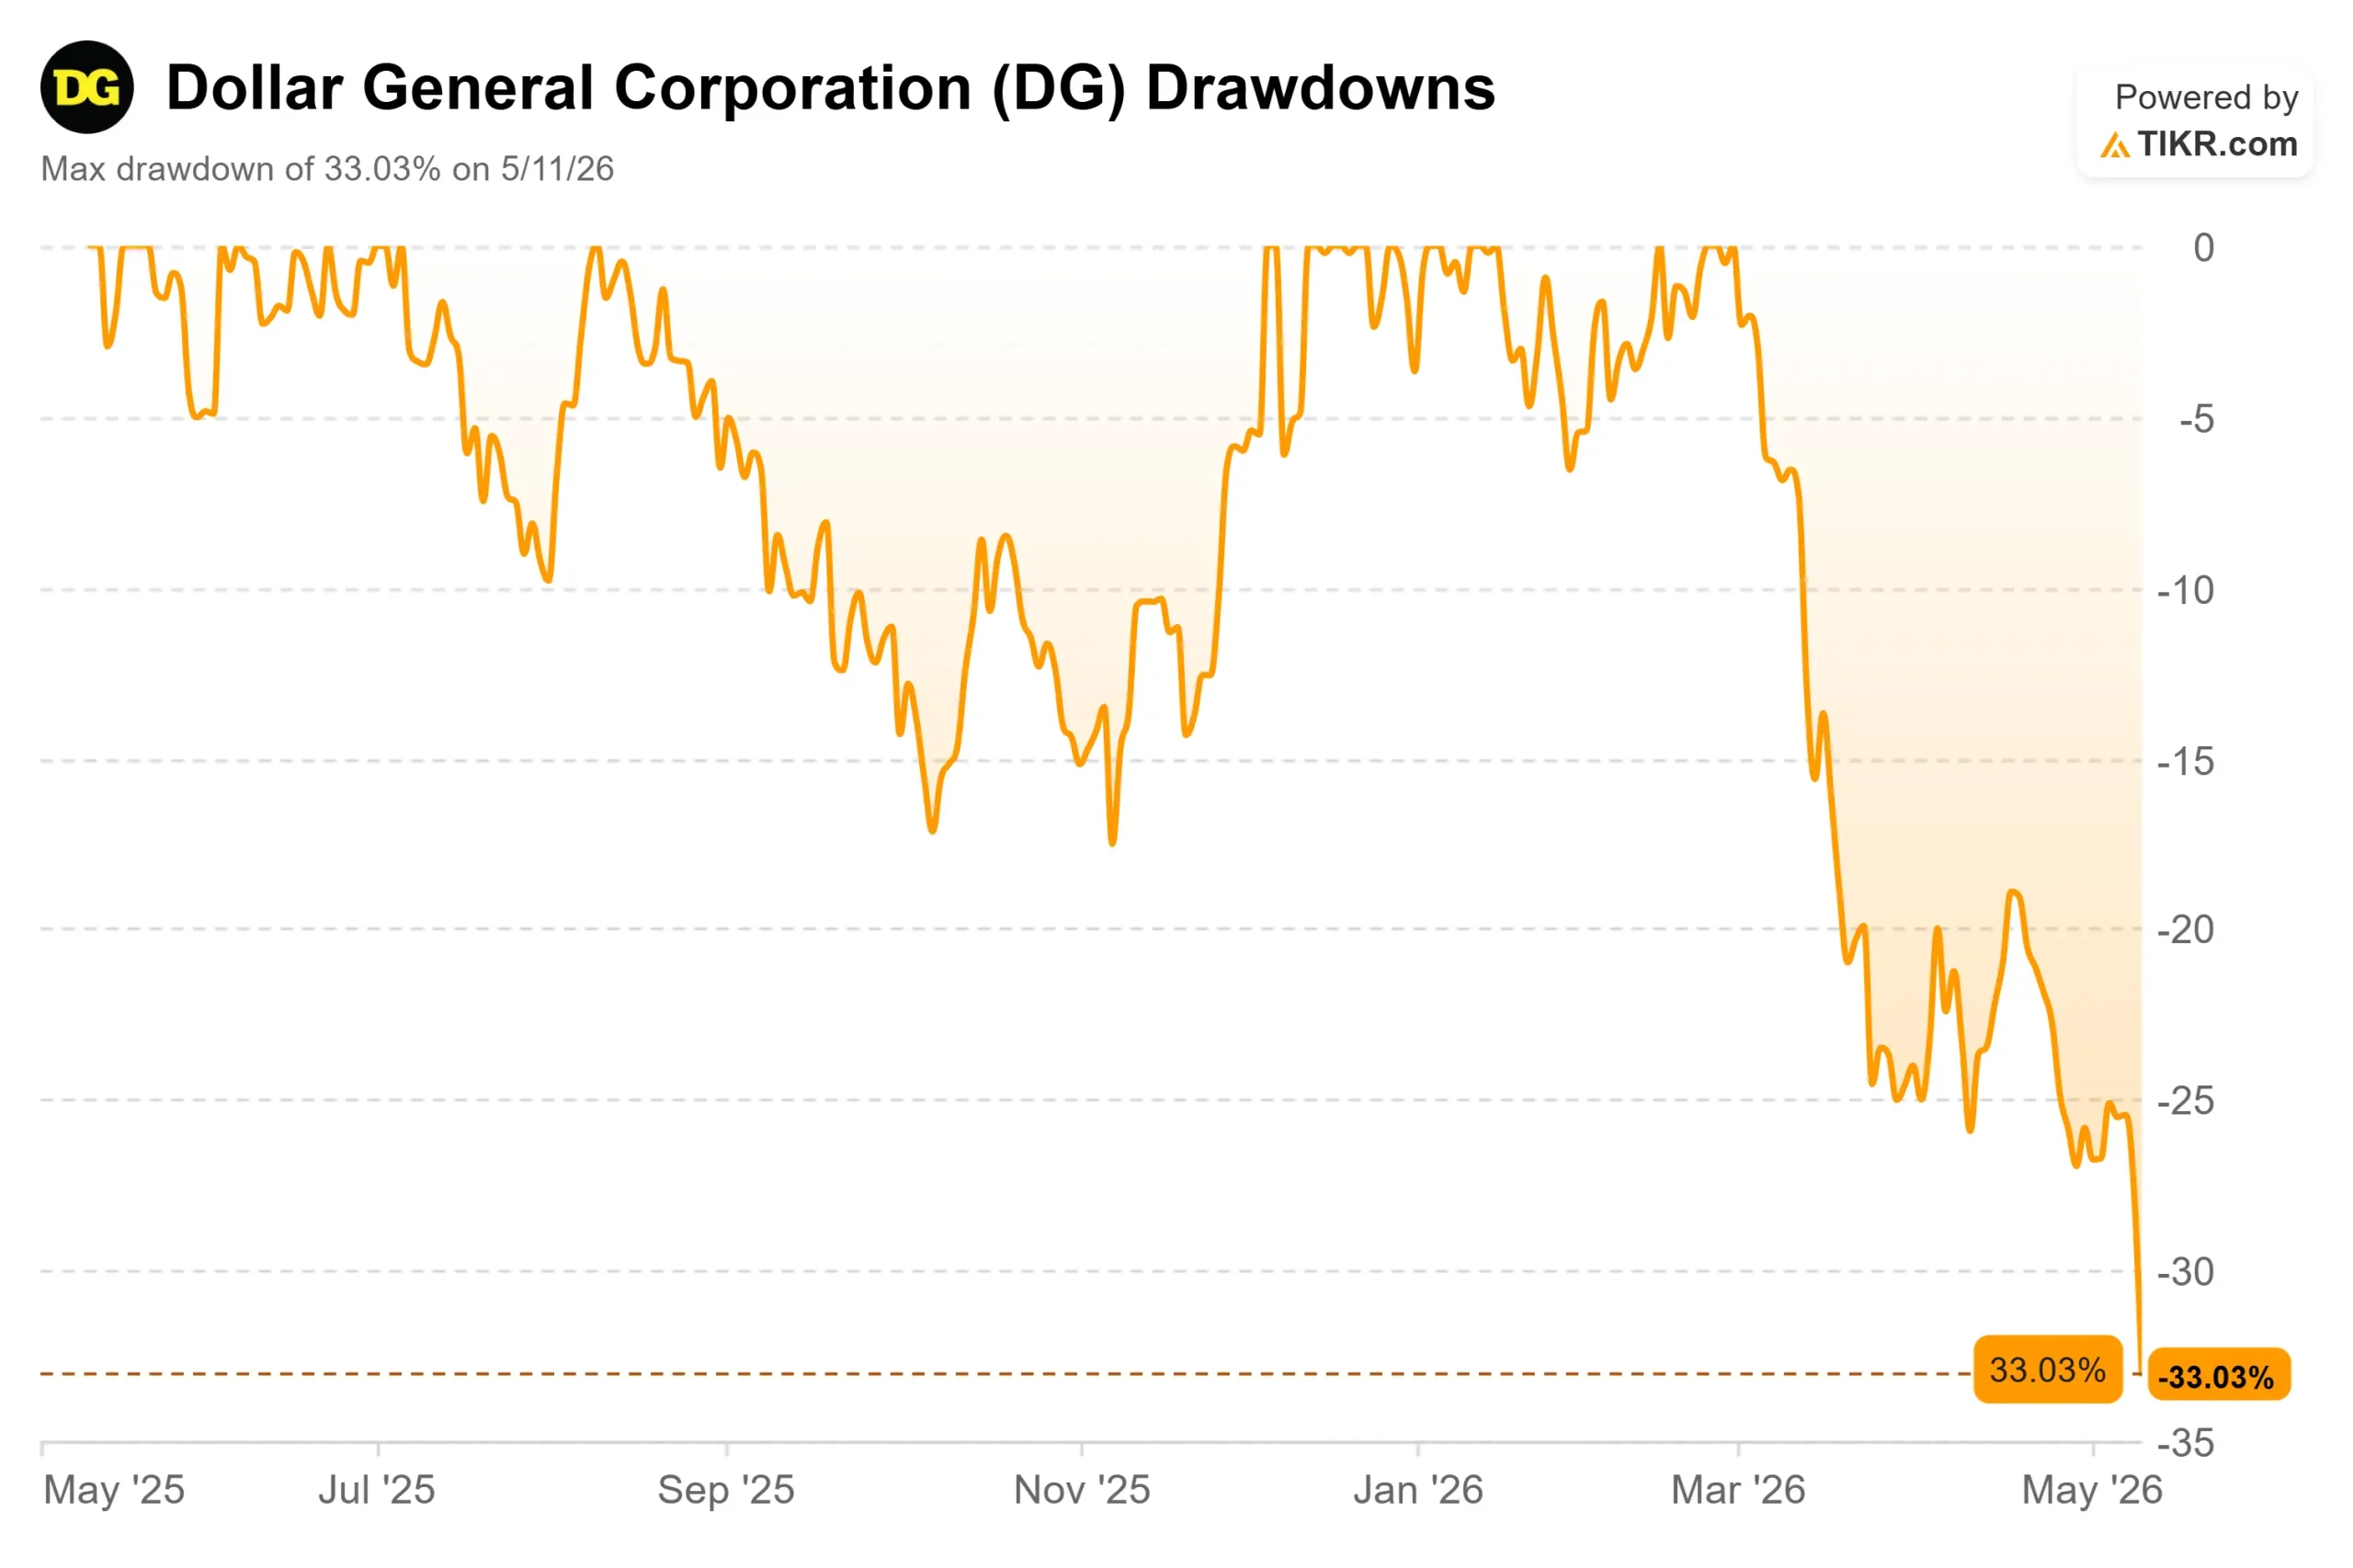
- Max Drawdown: -33.03% (as of 5/11/26)
Now Live: Discover how much upside your favorite stocks could have using TIKR’s new Valuation Model (It’s free) >>>
What Happened?
Dollar General (DG) stock fell 7.6% on May 11, 2026, pushing the stock below $105 and leaving it down more than 20% year-to-date. No company-specific news drove it. The preliminary May 2026 reading from the University of Michigan Surveys of Consumers came in at 48.2, a new all-time low in data going back to 1952, according to CNBC. Gas prices surged above $4 per gallon as the Iran conflict disrupted energy markets. Investors sold the entire retail sector on fears that a squeezed consumer means weaker spending everywhere.
Bulls argue that logic gets Dollar General exactly backward. When budgets tighten, the $1 price point wins. Bears counter that Dollar General’s core low-income shopper is already so stressed that even a dollar store trip gets cut. The unresolved question heading into Q1 FY2026 earnings on June 2, 2026, is which force is winning.
The Q4 FY2025 transcript and the TIKR data both make a stronger case for the bulls than the selloff implies.
See historical and forward estimates for Dollar General stock (It’s free!) >>>
What Q4 Showed and What the Market Missed
Dollar General’s Q4 FY2025 results, reported March 12, 2026, drew a 3.02% stock decline despite a clean beat. Net sales grew 5.9% to $10.9 billion. Same-store sales rose 4.3%, the strongest pace since fiscal 2023. EPS came in at $1.93, beating the average analyst estimate by 17.85%, per TIKR Beats & Misses data. Full-year operating cash flow hit $3.6 billion, up 21.3%, per the earnings call. Dollar General has beaten adjusted EPS estimates in five straight quarters.
The sell-off was about the guidance. Dollar General projected fiscal 2026 EPS of $7.10 to $7.35, with headwinds including a $0.13 drag from the expiration of the Work Opportunity Tax Credit (a federal incentive for hiring workers with barriers to employment, including veterans and SNAP recipients), modest SG&A deleverage, and same-store sales growth of just 2.2% to 2.7%.
What investors skimmed past was the margin momentum underneath those numbers.
Gross margin expanded 107 basis points for the full fiscal year, driven by an 80-basis-point reduction in shrinkage (inventory loss from theft and damage). CFO Donny Lau stated: “We now anticipate shrink and damages combined will contribute approximately 50 basis points of incremental gross margin expansion” over the next three to four years, and added that the company is “ahead of schedule in some of the initial goals contemplated in our long-term framework.”
CEO Todd Vasos flagged a second margin layer not yet embedded in the framework: “We are building an AI operating system for the enterprise, focused on reshaping our workflows to improve productivity and enablement.” Because this sits outside the formal financial targets, it is upside optionality, not borrowed credit.
The DG Media Network (Dollar General’s advertising business, where consumer brands pay to reach its customer base) generated approximately $170 million in fiscal 2025. Lau described the growth flywheel plainly: “Delivery is highly accretive from a sales and profit perspective. The media network is highly accretive from a profit perspective. And they are self-reinforcing.” That $170 million is a floor, not a ceiling.

The Macro Selloff Cuts Both Ways
The forces that sent DG down 7.6% on May 11 are the same forces that historically push more shoppers into dollar stores.
The preliminary May 2026 Consumer Sentiment reading of 48.2 from the University of Michigan is the lowest ever recorded in the survey’s history, per CNN Business. Year-ahead inflation expectations sit at 4.5%, with about one-third of consumers spontaneously citing gas prices and roughly 30% citing tariffs, according to survey director Joanne Hsu. That kind of pressure compresses household budgets, particularly at the low and middle end of the income spectrum.
Dollar General is already capturing the trade-down. The company grew market share in both dollars and units in consumable product sales during Q4, gained share in non-consumable categories for the fourth consecutive quarter, and expanded penetration across all household income brackets. CEO Todd Vasos noted on the call: “Customers across all income brackets continue to stress the importance of finding value as they shop, and we are meeting this need as we continue to grow penetration with households of all income levels.”
The clearest proof point is the Value Valley offering (more than 500 rotating items, all priced at $1), which posted a 17.6% comparable sales increase in Q4, more than four times the chain average of 4.3%. When gas is above $4, and sentiment is at a record low, that $1 item is a budget tool, not a novelty.
There is a real bear case. Vasos acknowledged on the call that macroeconomic pressures are intensifying for the company’s core customer and that tariffs and rising gas prices are headwinds to watch. A consumer under enough income stress stops shopping even at a dollar store. If that dynamic wins, the 2.2% to 2.7% same-store sales guidance starts to look optimistic. The June 2 earnings report is the first real test of which force has the upper hand.
See how Dollar General performs against its peers in TIKR (It’s free!) >>>
TIKR Advanced Model Analysis
- Current Price: $104.63
- Target Price (Mid): ~$176
- Potential Total Return: ~68%
- Annualized IRR: ~12% / year

See analysts’ growth forecasts and price targets for Dollar General stock (It’s free!) >>>
The TIKR mid-case applies a revenue compound annual growth rate of around 4%, consistent with Dollar General’s own fiscal 2026 sales guidance of 3.7% to 4.2%. The two primary growth drivers are new store openings (450 planned in fiscal 2026, roughly 80% in rural communities) and same-store sales momentum from delivery and the DG Media Network. The margin driver continues to shrink and damage reduction compounding toward management’s stated 6% to 7% operating margin target.
The high case, modeling around 4.5% revenue growth and net income margins of around 4.3%, points to a price of around $288 and around 175% total return. That requires Dollar General to push nonconsumable penetration toward its stated goal of as high as 20% of sales by 2029, scale the DG Media Network well past $170 million, and execute on the share repurchase program management expects to restart in fiscal 2027.
The downside: if income stress prevents trade-down and same-store sales disappoint materially, free cash flow compresses and the margin recovery path gets pushed out. At 10.82x NTM EV/EBITDA, DG already trades below its historical average multiple. Further multiple compression would cap returns even if earnings grow.
With 10 Buys and 3 Outperforms among 30 ratings on file and a Street mean target of around $146, DG trades at a 29% discount to analyst consensus. That gap is wide for a company that has beaten earnings in five straight quarters.
Conclusion
The one number to watch at Q1 FY2026 earnings on June 2, 2026, is same-store sales. Management guided the low 2% range for Q1, held back by two weeks of February storm closures. A comp of 2.5% or above signals the trade-down thesis is winning. Below 2%, the income stress bears have a point.
Dollar General is down 33% from its 52-week high, trading 29% below Wall Street’s mean target, and executing ahead of its own margin framework. The May 11 selloff was macro-driven, not company-specific, and the macro forces behind it have historically benefited discount retailers. At $104, the disconnect between the stock price and the business trajectory looks overdone.
See what stocks billionaire investors are buying so you can follow the smart money with TIKR.
Should You Invest in Dollar General?
The only way to really know is to look at the numbers yourself. TIKR gives you free access to the same institutional-quality financial data that professional analysts use to answer exactly that question.
Pull up Dollar General, and you’ll see years of historical financials, what Wall Street analysts expect for revenue and earnings in the quarters ahead, how valuation multiples have moved over time, and whether price targets are trending up or down.
You can build a free watchlist to track Dollar General alongside every other stock on your radar. No credit card required. Just the data you need to decide for yourself.
Analyze Dollar General on TIKR Free →
Looking for New Opportunities?
- See what stocks billionaire investors are buying so you can follow the smart money.
- Analyze stocks in as little as 5 minutes with TIKR’s all-in-one, easy-to-use platform.
- The more rocks you overturn… the more opportunities you’ll uncover. Search 100K+ global stocks, global top investor holdings, and more with TIKR.
Disclaimer:
Please note that the articles on TIKR are not intended to serve as investment or financial advice from TIKR or our content team, nor are they recommendations to buy or sell any stocks. We create our content based on TIKR Terminal’s investment data and analysts’ estimates. Our analysis might not include recent company news or important updates. TIKR has no position in any stocks mentioned. Thank you for reading, and happy investing!