
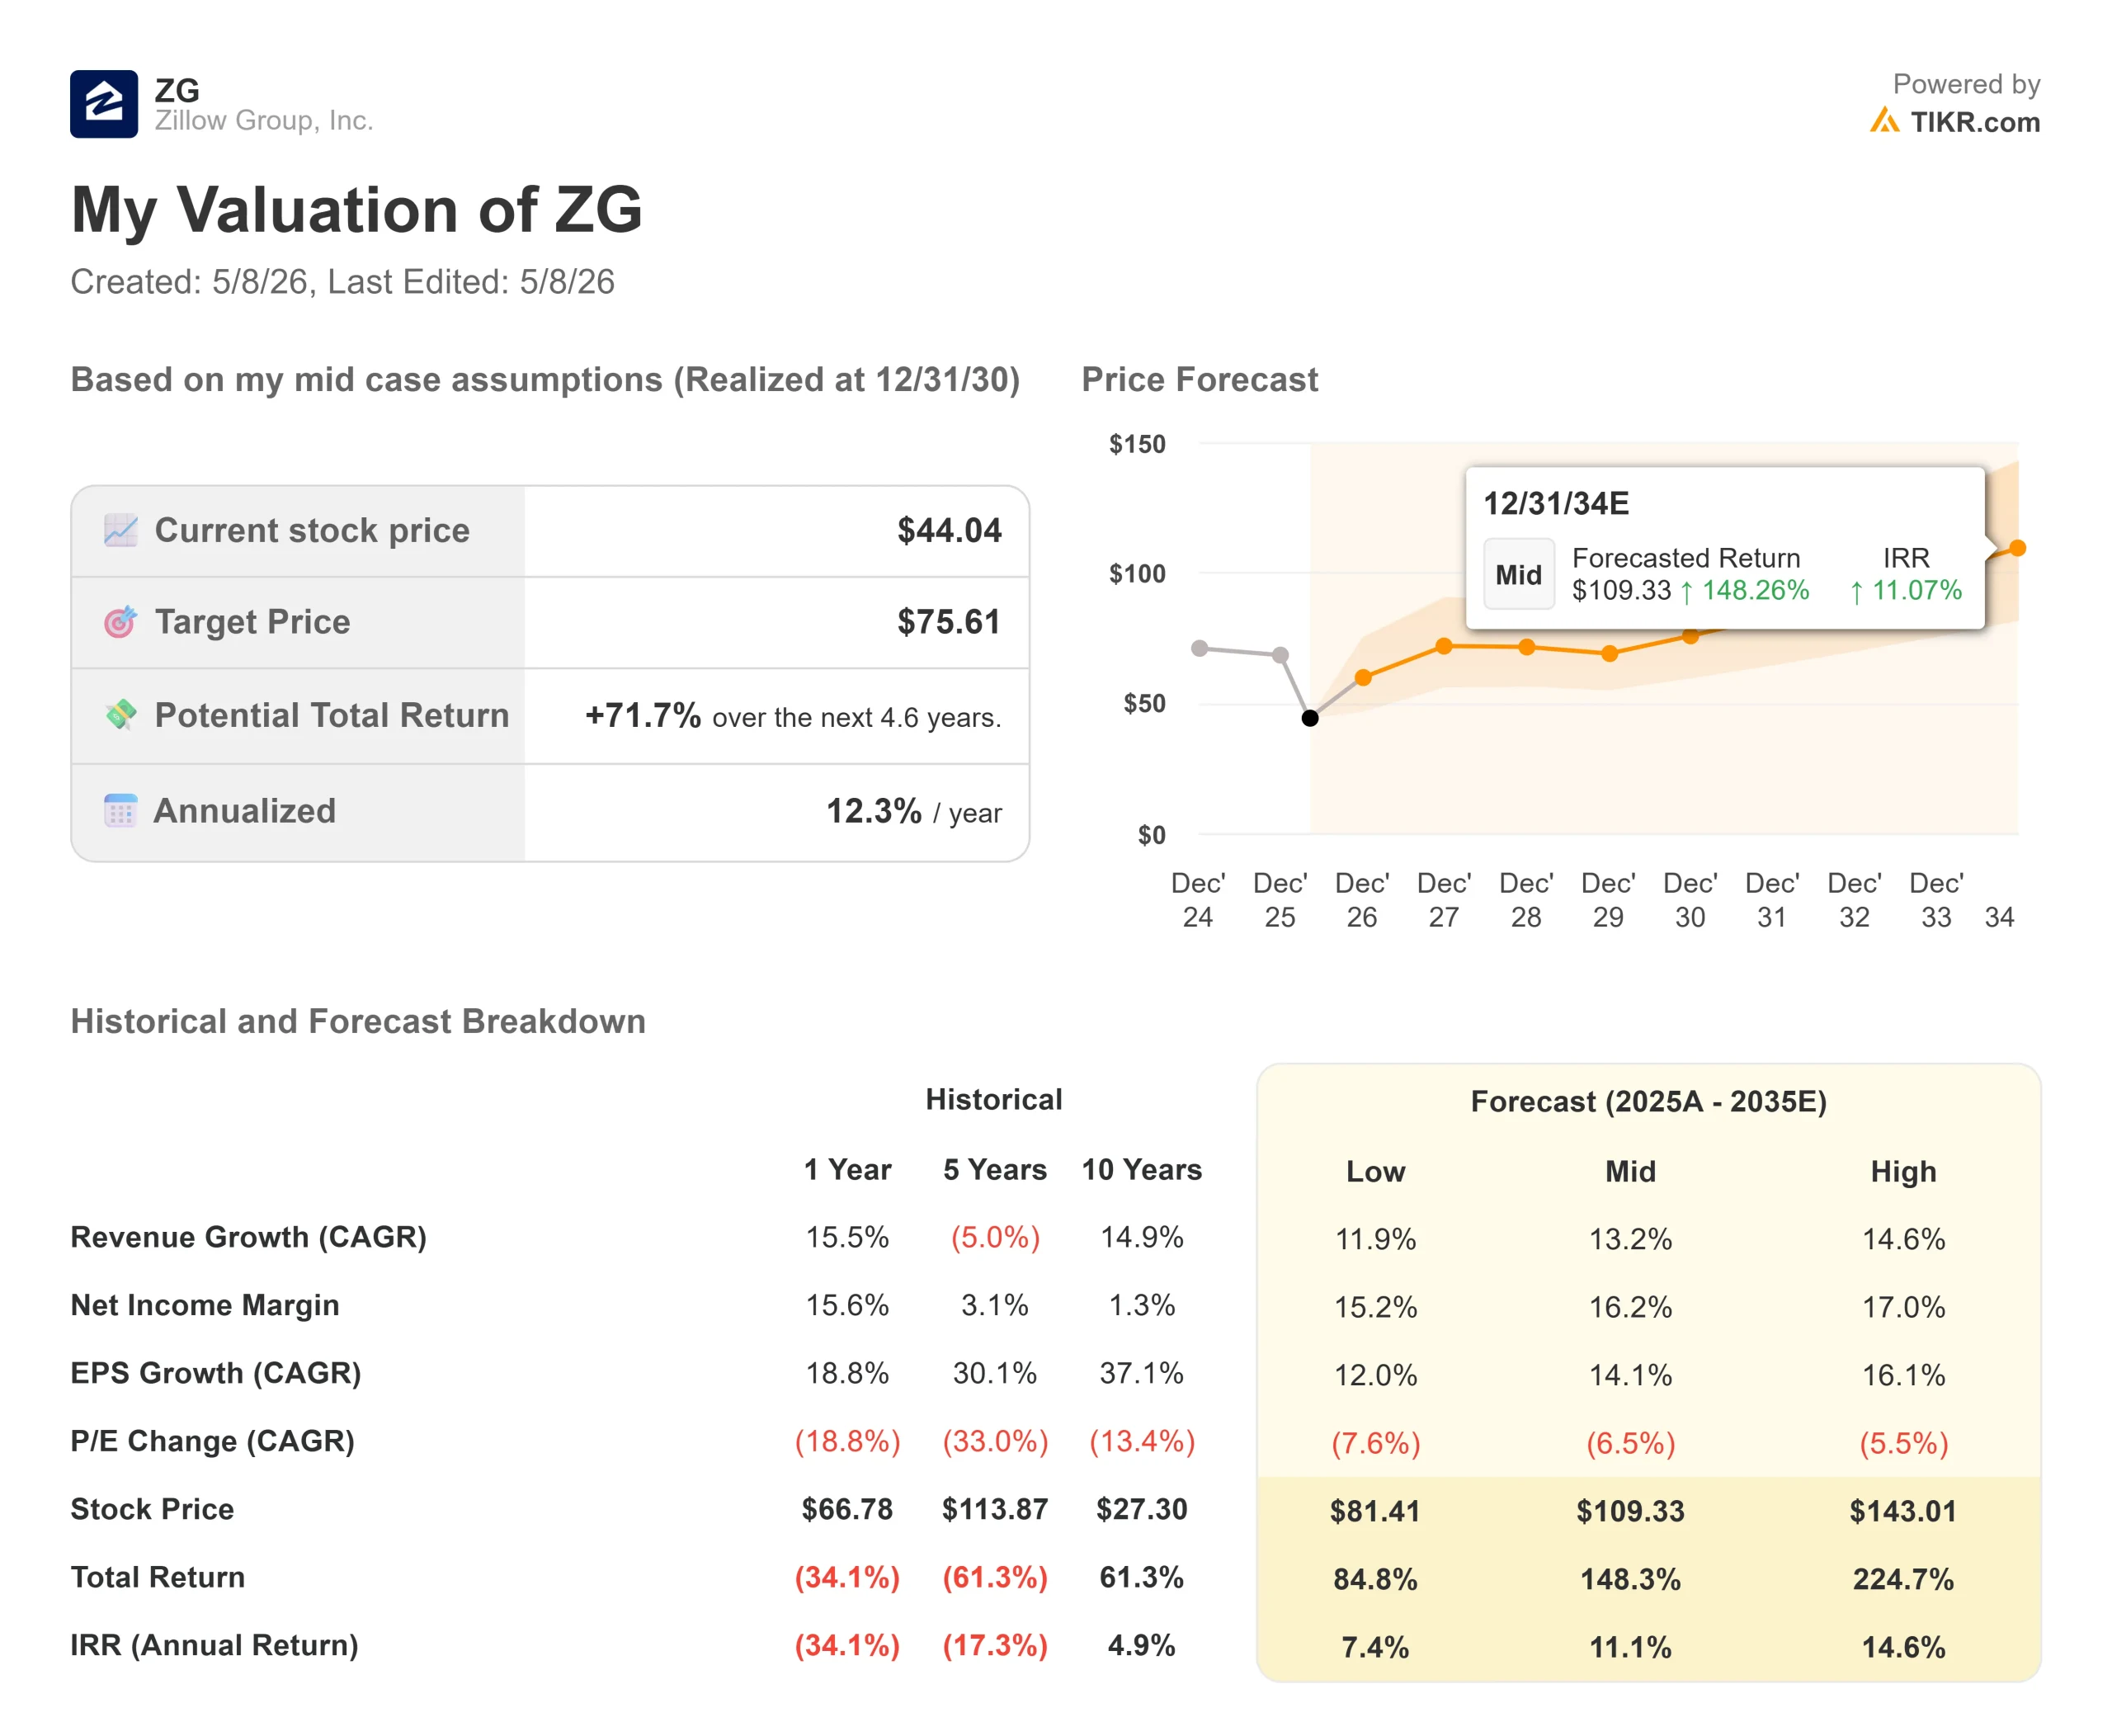
Key Stats for Zillow Stock
- Current Price: $44.04
- Street Target (Mean): ~$66
- Target Price (Mid): $75.61
- Potential Total Return: ~72%
- Annualized IRR: ~12% / year
- Earnings Reaction: -1.76% (May 7, 2026)
Now Live: Discover how much upside your favorite stocks could have using TIKR’s new Valuation Model (It’s free) >>>
What Happened?
Zillow Group (ZG) posted one of its strongest operational quarters on record, and the market still sold it. The stock closed down 1.76% on May 7, 2026, the day after reporting 18% revenue growth, a record mortgage quarter, and an adjusted EPS of $0.53 against a $0.46 Street estimate. Bulls point to three business engines accelerating at once. Bears point to a frozen housing market, an FTC trial on the calendar, and Q2 profit guidance that fell short of expectations. The key question: is Zillow’s platform growing fast enough to outrun its headwinds?
The Beat That Still Stung
Zillow’s investor relations materials for Q1 2026 showed total revenue of $708 million, up 18% year-over-year and near the high end of guidance. Adjusted EBITDA of $182 million beat the top of the outlook range. Net income came in at $46 million, with the net income margin expanding more than 500 basis points year-over-year. Free cash flow of $127 million was up 44% from Q1 2025.
The sell-off was not about Q1. It was about Q2. Management guided Q2 revenue of $750 million to $765 million, implying around 16% growth at the midpoint. That is solid, but Q2 EBITDA guidance of $150 million to $165 million disappointed analysts expecting more operating leverage. Two items account for most of the gap: approximately $20 million of incremental legal expenses tied to an FTC trial that CFO Jeremy Hofmann described as running on an “accelerated timeline,” and $16 million of incremental advertising spend front-loaded into Q2 for planned product launches. Strip those legal costs out, and the adjusted Q2 EBITDA guidance of $170 million to $185 million is roughly in line with year-ago margins.
The FTC context is worth understanding. In October 2025, the Federal Trade Commission sued Zillow and Redfin, alleging Zillow paid approximately $100 million to eliminate Redfin as a competitor in multifamily rental advertising. Five state attorneys general filed parallel antitrust suits. The legal overhang falls directly on Zillow’s rentals segment, its fastest-growing business. On the call, Hofmann was straightforward: “We are eager to get through that.” Management expects the legal cost headwind to ease in the second half of 2026 as the trial proceeds.

See historical and forward estimates for Zillow stock (It’s free!) >>>
Three Engines Running at Once
The February 2026 selloff, when ZG fell 17.13% after Q4 2025 results on soft EBITDA guidance and AI disruption fears, sent the stock to a max drawdown of 53.96% from its 52-week high of $90.22, bottoming at $39.14 in April. Q1 2026 shows the operational picture has only strengthened since.
1. Mortgages. Purchase loan origination volume grew 96% year-over-year to a record $1.5 billion in Q1. Mortgages revenue of $64 million grew 56%, beating Zillow’s own 40% growth outlook. Zillow Home Loans is now a top 25 purchase lender in the U.S. Enhanced markets, where the full integrated transaction experience is live, accounted for 49% of Zillow’s connections in Q1, up from 44% in Q4 2025. Management’s target is at least 75%. That 26-point gap is where the next leg of mortgage revenue lives.
2. Rentals. Q1 rentals revenue of $183 million grew 42% year-over-year, with multifamily up 57%. Zillow now has 76,000 multifamily properties on the platform, up 38% from a year ago, against a total addressable base of roughly 140,000 to 150,000 buildings. Hofmann laid out the trajectory on the call: rentals grew 27% in 2024, 39% in 2025, and are expected to grow approximately 30% in 2026, nearly doubling the business in three years. The $1 billion annual rental revenue target remains on track.
3. The Realtor.com collaboration. The week’s most strategically significant move was not the earnings report itself. On May 5, 2026, Zillow and Realtor.com announced that Zillow Preview listings (pre-market homes that appear on Zillow before hitting the MLS, or Multiple Listing Service) will also appear on Realtor.com starting this summer. Together, the two platforms reach roughly three-quarters of major portal visitors according to March Comscore data. Zillow Preview launched in March 2026 with five brokerage partners and had already scaled to more than 60 by earnings day. CEO Jeremy Wacksman stated the principle directly: “The real estate market works best when every buyer has access to the same information, nothing hidden, nothing reserved for a select few.”
Preview is Zillow’s counter to the private listing networks that Compass and other brokerages have been building. Compass syndicates its competing program through Redfin. Zillow now reaches both the most-visited real estate platforms at the same time, with no brokerage affiliation required. That distribution moat is difficult to replicate quickly.
One detail from the earnings call that did not make headlines: Zillow’s AI mode is live for roughly 5% of the platform’s audience and already changing user behavior. Wacksman shared that one recent user had 16 conversations over 10 days researching neighborhoods in Sonoma County and ended up under contract on a home found through that experience. Engineers are also shipping 40% more code per engineer at the same or higher quality as AI is embedded into internal workflows. Consumer-facing AI mode expansion is planned for the second half of 2026.

Where Zillow Stands Against Its Peers
Among real estate peers on TIKR’s Competitors page, Zillow trades at 3.15x NTM EV/Revenue and 12.09x NTM EV/EBITDA. Compass (COMP) trades at 0.70x NTM EV/Revenue and 10.74x NTM EV/EBITDA. Colliers International (CIGI) trades at 1.39x NTM EV/Revenue and 10.60x NTM EV/EBITDA.
Zillow’s premium reflects its higher-margin software and marketplace revenue mix, and an 18% growth rate in a housing market the National Association of Realtors (NAR) reports grew only 2% in Q1 2026. Whether that premium is justified depends almost entirely on whether the FTC matter resolves without forcing a structural change to the rentals business. That is the bear case in one sentence.
On the balance sheet, Zillow ended Q1 with $788 million in cash and investments, down from $1.3 billion at year-end 2025, after repurchasing $626 million of stock and retiring 13.5 million shares in a single quarter. Diluted shares outstanding fell from 256 million a year ago to 240 million. With $1.3 billion remaining under existing buyback authorizations and a $500 million undrawn credit facility, Zillow has ample capacity to keep shrinking the share count. LTM levered free cash flow stands at $285.50 million per TIKR, up sharply as profitability has improved.
See how Zillow performs against its peers in TIKR (It’s free!) >>>
TIKR Advanced Model Analysis
- Current Price: $44.04
- Target Price (Mid): $75.61
- Potential Total Return: ~72%
- Annualized IRR: ~12% / year
See analysts’ growth forecasts and price targets for Zillow stock (It’s free!) >>>
The TIKR mid-case model projects a revenue CAGR of around 13% from 2025 through 2035. The two primary drivers are rentals scaling toward and beyond $1 billion in annual revenue through property additions and wallet share gains from multifamily operators, and mortgage origination volume compounding as enhanced markets coverage grows from 49% toward the 75% target. The margin driver is operating leverage on a roughly $1.1 billion fixed cost base that management expects to grow only with inflation, with variable costs trending toward neutral by year-end 2026.
The net income margin in the mid case reaches approximately 16% by the end of the forecast period. The primary risk: if the FTC trial produces a structural remedy that forces Zillow to restructure its multifamily advertising model, the rentals growth thesis is materially impaired. The primary upside: any recovery in housing transaction volume pushes For Sale revenue above the mid-single-digit residential growth assumption in the base case.
The mean Street target of $65.87, based on 9 Buys, 5 Outperforms, 12 Holds, 0 Underperforms, and 0 Sells, implies around 50% upside from current levels, still well below the TIKR mid-case. Most Street models use a one- to two-year horizon that does not reflect the margin expansion embedded in the 2028 to 2030 period. Both figures point in the same direction: the current price does not fully price this platform.
Conclusion
Watch the enhanced market percentage at the Q2 2026 earnings call, expected in August. It stood at 49% of connections in Q1. If it reaches 55% or higher, it is the clearest signal that the back-half margin expansion management has guided toward is on track. Zillow is not cheap. But 18% revenue growth in a flat housing market, with mortgage origination up 96% and rentals closing in on $1 billion in annual revenue, is not a story the current price is fully reflecting.
See what stocks billionaire investors are buying so you can follow the smart money with TIKR.
Should You Invest in Zillow?
The only way to really know is to look at the numbers yourself. TIKR gives you free access to the same institutional-quality financial data that professional analysts use to answer exactly that question.
Pull up Zillow, and you’ll see years of historical financials, what Wall Street analysts expect for revenue and earnings in the quarters ahead, how valuation multiples have moved over time, and whether price targets are trending up or down.
You can build a free watchlist to track Zillow alongside every other stock on your radar. No credit card required. Just the data you need to decide for yourself.
Looking for New Opportunities?
- See what stocks billionaire investors are buying so you can follow the smart money.
- Analyze stocks in as little as 5 minutes with TIKR’s all-in-one, easy-to-use platform.
- The more rocks you overturn… the more opportunities you’ll uncover. Search 100K+ global stocks, global top investor holdings, and more with TIKR.
Disclaimer:
Please note that the articles on TIKR are not intended to serve as investment or financial advice from TIKR or our content team, nor are they recommendations to buy or sell any stocks. We create our content based on TIKR Terminal’s investment data and analysts’ estimates. Our analysis might not include recent company news or important updates. TIKR has no position in any stocks mentioned. Thank you for reading, and happy investing!