

Key Takeaways:
- Costco’s return on invested capital sits at around 26%, well above Walmart’s roughly 16%, which is a meaningful part of why the market assigns it a higher multiple year after year.
- Walmart is the larger business by a wide margin, with $713 billion in revenue and an operating margin edging toward 4.2%, but Costco’s membership fee structure makes its earnings more predictable and less dependent on merchandise price or volume.
- Both stocks trade at premium valuations. The question worth asking is not which is cheaper, but which premium is more justified by the underlying business quality.
Now Live: Discover how much upside your favorite stocks could have using TIKR’s new Valuation Model (It’s free)>>>
These are two of the best-run retailers in the world, and investors have known it for years. Costco (COST) trades at around 47x forward earnings. Walmart (WMT) sits at roughly 44x.
Neither is cheap, and in a macro environment where tariff uncertainty is creating real pressure on imported goods, both companies are being asked to prove their resilience.
The interesting thing is that this comparison is less about which company is winning in retail and more about what kind of business you are actually buying when you own either stock.
Estimate a company’s fair value instantly (Free with TIKR) >>>
Two Business Models Built Around Different Moats
At first glance, these two companies look like they are competing on the same turf, but the way each one actually makes money is almost nothing alike.
For its part, Costco is a membership warehouse club where the actual profit engine is the annual fee, not the merchandise. Members pay to access a tightly curated selection of products sold at deliberately thin margins, around 13% gross, with most of the savings passed directly to the customer. That membership line grew from $3.9 billion in fiscal 2021 to $5.3 billion in fiscal 2025, compounding steadily with renewal rates consistently above 90%.
Needing no introduction, Walmart is a different machine entirely, one that has built a massive traditional retail operation across groceries and general merchandise, and spent the last several years layering high-margin businesses on top of it, most notably Walmart Connect, its retail media network that sells advertising against first-party purchase data and grew 41% in fiscal 2026.
The distinction matters because Costco’s fee revenue is essentially pure profit. Walmart’s advertising and e-commerce businesses are high-margin too, but they are still a relatively small slice of a $713 billion revenue base, which means margin improvement will come gradually.
What the Financials Actually Show
The TIKR charts tell a clear story when you look at both companies side by side.

Walmart’s operating margin has held in a tight band between 4% and 4.5% for five years, reaching around 4.2% in fiscal 2026. Revenue has grown steadily from $559 billion to $713 billion over the same period. It is a consistent, compounding machine, but the margin profile has not changed dramatically despite all the investment in higher-margin businesses.
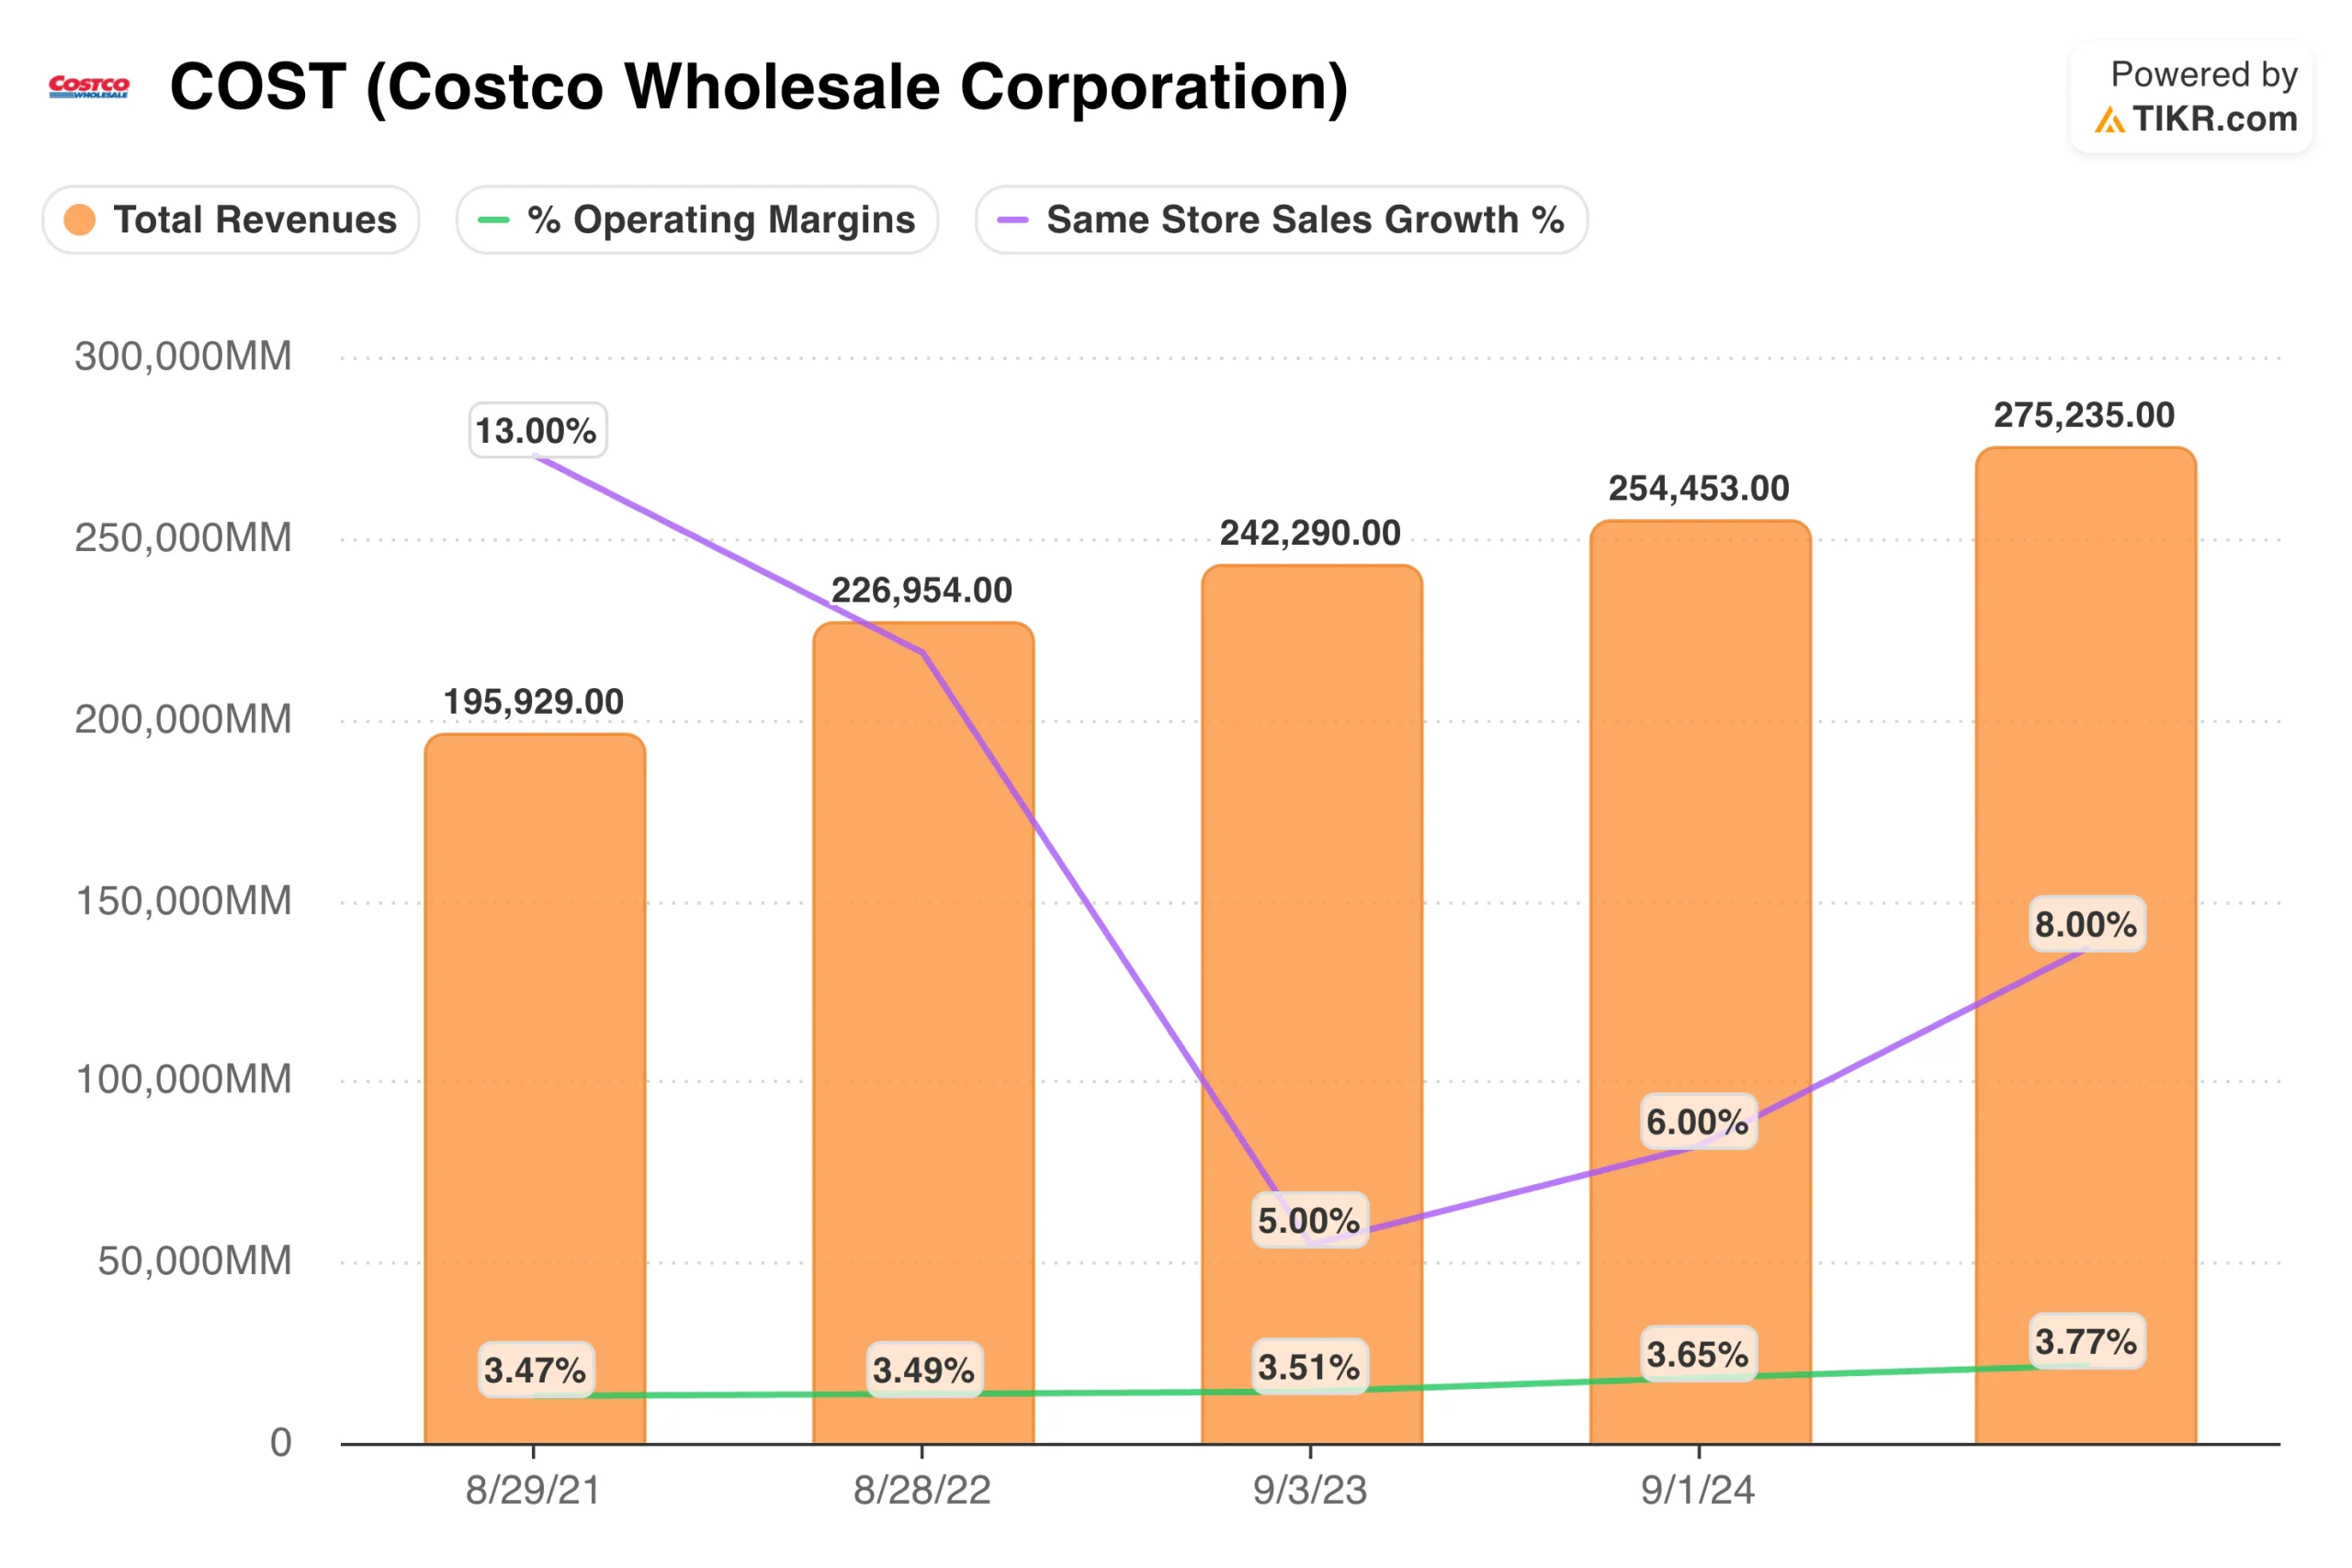
Costco’s operating margin looks thinner at around 3.8%, but that is intentional and somewhat misleading as a comparison point. When you fold in the membership fee as near-pure-profit income sitting on top of a low-margin merchandise business, the earnings quality is actually higher than the headline number suggests.
Same-store sales swung from 13% growth in fiscal 2022 to 5% in fiscal 2023, then recovered to 8% most recently, indicating some sensitivity to the consumer environment but also real underlying demand.
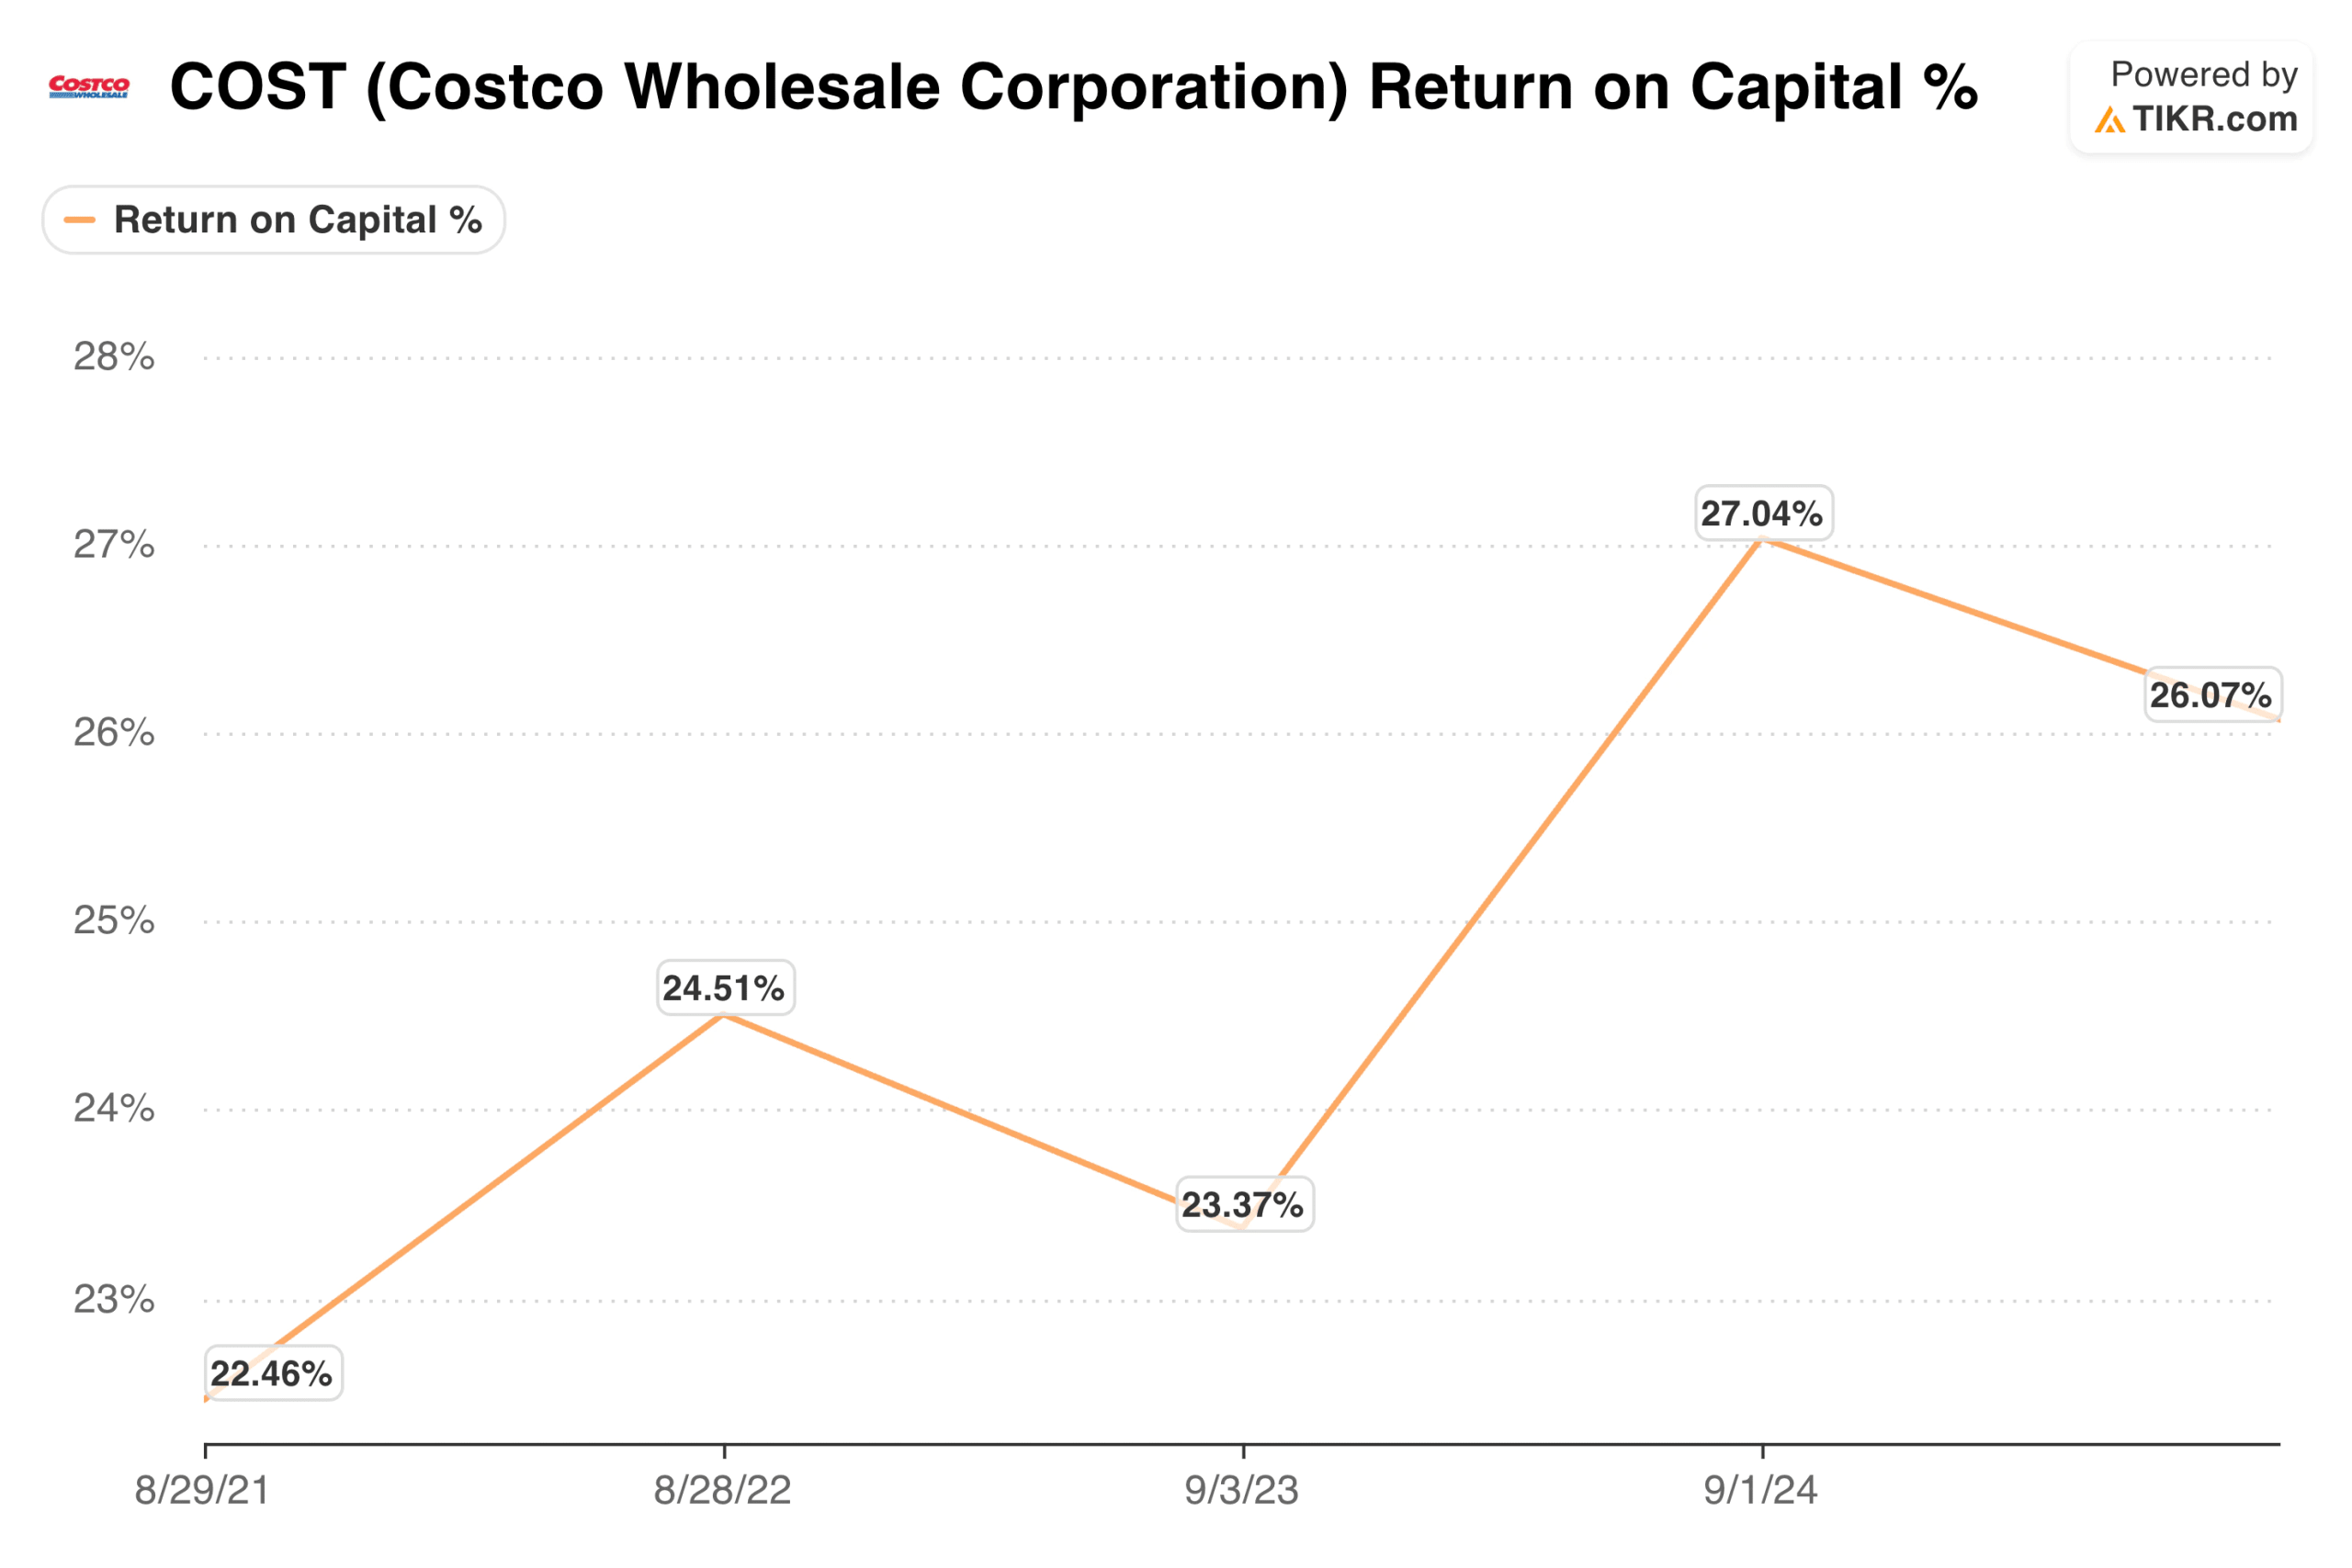
The more telling comparison is return on invested capital. Costco’s ROIC has expanded from around 22% in fiscal 2021 to roughly 26% today.

Walmart’s ROIC has improved meaningfully, too, from around 14% to a peak near 18% before settling back to around 16%. Both are healthy businesses, but Costco is deploying capital more efficiently, and that gap is a major reason investors have historically paid a higher multiple for it.
See what analysts think about WMT stock right now (Free with TIKR) >>>
What Consensus Estimates Are Pricing In
From the TIKR Estimates tab, analysts expect Costco to grow revenue at roughly 8% to 9% annually over the next several years, with EPS climbing from around $20 in fiscal 2026 toward $28 by fiscal 2030. The forward P/E compresses from around 47x today toward 35x on 2030 estimates, which is the classic “grow into the multiple” thesis that Costco has executed on reliably for decades.
Walmart’s estimates are more modest, with revenue growing around 5% annually and EPS expanding from roughly $2.90 in fiscal 2026 toward $4.10 by fiscal 2030. The forward P/E compresses similarly, from around 44x today toward 31x on 2030 numbers. The growth story is real but slower, and the multiple compressions rely on continued execution in advertising and e-commerce to add to profitability.
Valuation: Is the Premium Deserved?
The TIKR model targets around $1,413 for Costco, implying roughly 40% upside and an annualized return of about 8%. That is a reasonable return for a business with a 26% ROIC, 90%+ renewal rates, and a model that has reliably compounded earnings through multiple economic cycles.

The TIKR model for Walmart targets around $143, implying a total upside of around 10% and an annualized return of roughly 2%. The advertising and e-commerce story is compelling, but at 44x forward earnings on a business growing revenue at around 5%, the current price already reflects a fairly optimistic outcome.

Costco’s premium over Walmart is not as wide as it looks on P/E alone, only a few turns at current prices. But the ROIC differential, the earnings predictability of the membership model, and the cleaner margin structure make Costco the business that has historically earned its multiple rather than borrowed against future expectations.
See analysts’ full growth forecasts and estimates for COST stock (It’s free) >>>
The Bottom Line for Investors
At the end of the day, both companies are excellent, and neither is going to surprise you with a dramatic product pivot or a business model collapse.
What you are really deciding between is a slower, larger machine with a genuine transformation story still playing out, and a smaller, more efficient machine that has been printing returns for decades on the back of a simple idea: charge people for access, then sell them things cheaply enough that they keep coming back.
At current prices, Costco is the more compelling setup. The TIKR model implies better annualized returns, the ROIC data support the premium multiple, and the membership model provides the kind of earnings floor that makes the valuation feel less precarious than it might appear at first glance.
All this said, Walmart is still worth watching closely as advertising scales, but right now, you are paying full price for a story that still has some proving to do.
Build your own Valuation Model to value any stock (It’s free!) >>>
How Much Upside Does COST Stock Have From Here?
With TIKR’s new Valuation Model tool, you can estimate a stock’s potential share price in under a minute.
All it takes is three simple inputs:
- Revenue Growth
- Operating Margins
- Exit P/E Multiple
If you’re not sure what to enter, TIKR automatically fills in each input using analysts’ consensus estimates, giving you a quick, reliable starting point.
From there, TIKR calculates the potential share price and total returns under Bull, Base, and Bear scenarios so you can quickly see whether a stock looks undervalued or overvalued.
See a stock’s true value in under 60 seconds (Free with TIKR) >>>
Looking for New Opportunities?
- See what stocks billionaire investors are buying so you can follow the smart money.
- Analyze stocks in as little as 5 minutes with TIKR’s all-in-one, easy-to-use platform.
- The more rocks you overturn… the more opportunities you’ll uncover. Search 100K+ global stocks, global top investor holdings, and more with TIKR.
Disclaimer:
Please note that the articles on TIKR are not intended to serve as investment or financial advice from TIKR or our content team, nor are they recommendations to buy or sell any stocks. We create our content based on TIKR Terminal’s investment data and analysts’ estimates. Our analysis might not include recent company news or important updates. TIKR has no position in any stocks mentioned. Thank you for reading, and happy investing!


