

Key Stats for Real Income Stock
- 52-Week Range: $50.7 to $67.9
- Current Price: $62.2
- Street High Target: $75
What Happened?
Realty Income (O), the net lease real estate investment trust (REIT) that owns and leases commercial properties to tenants on long-term contracts, crossed $8.0 billion in 2026 investment guidance after delivering $4.28 in adjusted funds from operations (AFFO, the REIT equivalent of earnings per share) for 2025, with shares trading at $62.21 as Deutsche Bank raised its price target to $70 on April 1, citing the company’s AI-driven lease management platform as a direct catalyst for higher rental income and improved property valuations.
Deutsche Bank lifted its target to $70 from $69 and reiterated a buy rating on April 1, arguing that Realty Income’s use of AI-powered predictive analytics to identify at-risk leases early allows the company to exit them proactively, re-lease faster, and avoid the vacant-property losses that erode REIT earnings, while Mizuho had already raised its target to $68 from $60 on March 11 citing the company’s new private capital fund, which adds 75 to 100 basis points in management fees on top of acquisition spreads.
The operational proof sits in Realty Income’s $1.0 billion Apollo joint venture, announced March 19 and closed March 31, in which Apollo’s funds acquired a 49% stake in roughly 500 single-tenant retail properties (stores leased to one tenant under long-duration contracts) at a capped IRR of 6.9% for Apollo, a structure that lets Realty Income monetize its balance sheet while retaining property management fees and a buyback option between years 7 and 15, a model peers in the net lease sector have not yet replicated at this scale.
On the March 3 Citi Global Property CEO Conference,Sumit Roy, President and Chief Executive Officer, stated, “We are not opportunity constrained. We have always been capital constrained in terms of what we could do,” tying that directly to the $1.7 billion cornerstone close of the company’s inaugural U.S. Open-End Core Plus Fund, a perpetual-life private vehicle that lets institutional investors co-own net lease assets alongside Realty Income’s public shareholders.
Realty Income’s evolution from a single-source public equity model into a multi-capital platform, anchored by $8.0 billion in 2026 investment guidance, a $1.5 billion GIC industrial development joint venture, and a private fund already attracting 40-plus institutional investors, positions the company to close the gap between its current 3% AFFO growth rate and the 5% long-term target management has explicitly committed to restoring within three to five years.
Wall Street’s Take on O Stock
The Apollo joint venture’s closure on March 31, which unlocked $1.0 billion in third-party capital at a capped 6.9% IRR for Apollo while preserving Realty Income’s management fees and buyback option, directly widens the spread between investment returns and cost of capital that drives AFFO per share growth.

Normalized EPS is estimated at $1.64 for 2026, a 38.1% jump from $1.19 in 2025, supported by the $8.0 billion investment pipeline and the Apollo and GIC joint ventures replacing the equity capital that previously constrained deal volume.
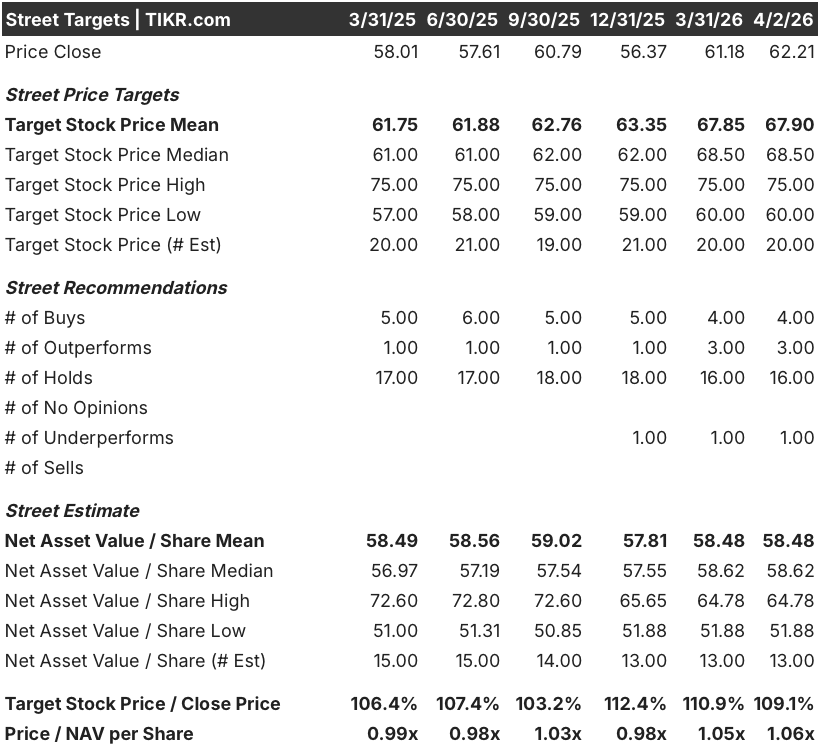
Wall Street sits at 4 buys, 3 outperforms, 16 holds, and 1 underperform across 20 analysts covering the stock, with a mean price target of $67.90 implying roughly 9.1% upside from the April 2 close of $62.21, a cautiously constructive posture that has not yet fully repriced for the private capital channel’s earnings contribution.
The target range spans $60.00 to $75.00, with the low anchored to credit loss risk and same-store rent growth coming in below the 1.0%–1.3% guidance band, and the high contingent on the private fund scaling past $1.7 billion and JV management fees beginning to show up materially in AFFO.
What Does the Valuation Model Say?

The TIKR mid-case model prices O at $85.53 by December 31, 2030, implying a 6.9% annualized IRR, driven by a 7.6% normalized EPS CAGR supported by the $8.0 billion annual investment pace, fee income from the Core Plus Fund, and the Apollo joint venture’s management fee stream compounding on top of balance sheet spreads.
At $62.21, Realty Income trades at roughly 37.9x 2026 normalized EPS of $1.64, a meaningful discount to the 40x–41x forward multiple O commanded as recently as February 2026, even as the earnings growth trajectory accelerates from 2% in 2025 to an estimated 38.1% in 2026, making O undervalued relative to its own recent multiple history at a moment of fundamental inflection.
The TIKR model’s $85.53 target is grounded in the $8.0 billion investment guidance, the Apollo and GIC joint ventures generating recurring management fees, and the Core Plus Fund’s $400 million in uncalled capital ready to deploy, all of which are now closed, confirmed structures rather than speculative pipeline.
Roy’s statement at the March 3 Citi conference that the company has “always been capital constrained,” not opportunity constrained, confirms that the new private capital architecture is the unlock, not a cyclical tailwind.
If same-store rent growth falls below the 1.0% guidance floor, the credit loss assumption of 40–50 basis points expands, compressing AFFO per share and breaking the model’s core earnings acceleration case.
The Q2 2026 earnings release will be the first clean read on whether the Apollo joint venture’s management fee income and the Core Plus Fund’s $10 million annual base fee are tracking to the TIKR model’s 38.1% normalized EPS growth assumption for the full year.
Should You Invest in Realty Income Corporation?
The only way to really know is to look at the numbers yourself. TIKR gives you free access to the same institutional-quality financial data that professional analysts use to answer exactly that question.
Pull up O stock and you’ll see years of historical financials, what Wall Street analysts expect for revenue and earnings in the quarters ahead, how valuation multiples have moved over time, and whether price targets are trending up or down.
You can build a free watchlist to track Realty Income Corporation alongside every other stock on your radar. No credit card required. Just the data you need to decide for yourself.
Access Professional Tools to Analyze O stock on TIKR for Free →


