Key Stats for EBAY Stock
- Past-Week Performance: 1%
- 52-Week Range: $59 to $101
- Valuation Model Target Price: $
- Implied Upside: % over years
What Happened?
eBay Inc. (EBAY) rose about 1% during the week, trading within a relatively narrow range after prior gains placed shares near the upper end of their 52-week range.
Reuters noted eBay’s inclusion in WeShop electronics offerings and coverage of its inaugural climate transition plan last week.
Management detailed a net-zero 2045 climate plan, citing a 92% reduction in Scope 1 and 2 emissions since 2019.
Markets emphasized the long-term, non-operational nature of disclosures, limiting short-term repricing despite incremental positive headlines.
EBay announced no changes to earnings outlook, strategy, or demand conditions during the period.
Is EBAY Stock Fairly Valued Right Now?
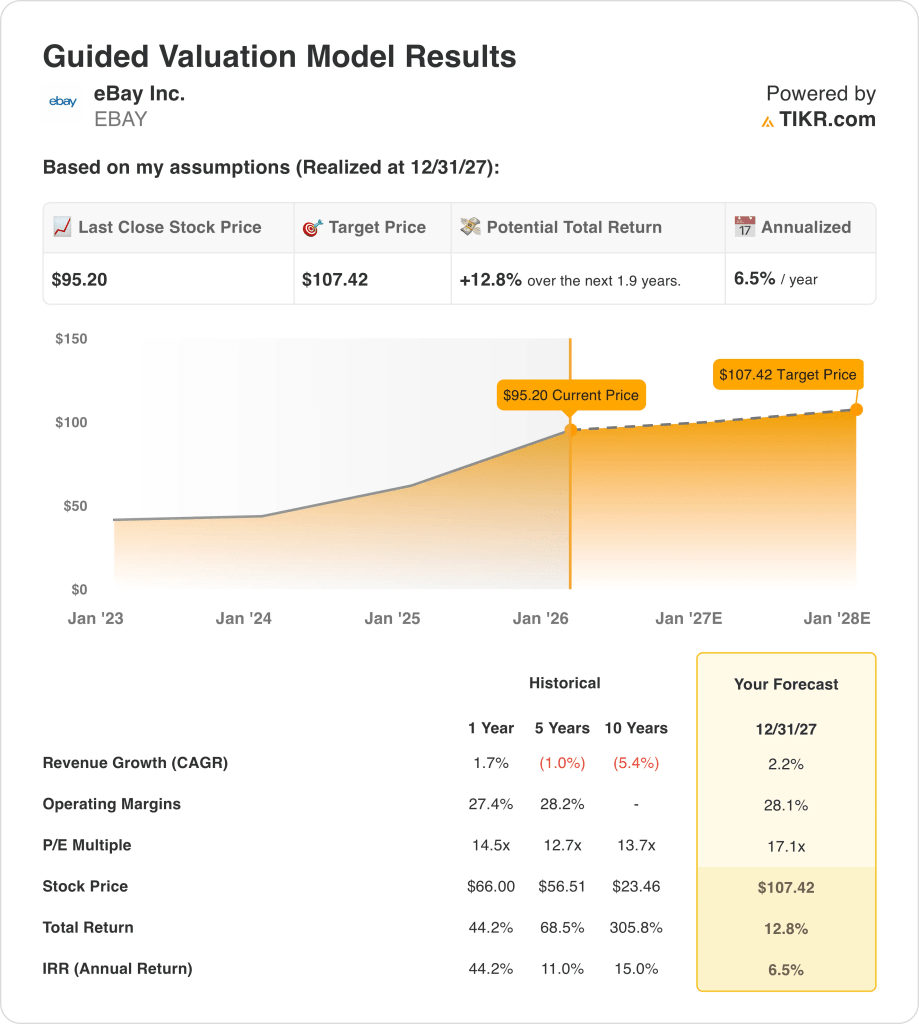
Under the valuation model shown, the stock is modeled using:
- Revenue Growth: 2.2%
- Operating Margins: 28.1%
- Exit P/E Multiple: 17.1x
Under the valuation model realized through 2027, eBay stock is assessed conditionally, with outcomes dependent on modeled growth, margins, and valuation assumptions holding.
Specifically, the model assumes 2.2% revenue growth, 28.1% operating margins, and a 17.1x exit earnings multiple.
Based on these inputs, the model estimates a $107 target price, implying 12.8% total upside and 6.5% annualized returns.
Operationally, execution depends on stable marketplace scale, pricing discipline, seller engagement, and margin durability across core commerce and advertising services.
As a result, eBay stock’s valuation reflects execution risk tied to modest growth assumptions, leaving returns sensitive to operational consistency rather than multiple expansion.
Value Any Stock in Under 60 Seconds (It’s Free)
With TIKR’s new Valuation Model tool, you can estimate a stock’s potential share price in under a minute.
All it takes is three simple inputs:
- Revenue Growth
- Operating Margins
- Exit P/E Multiple
From there, TIKR calculates the potential share price and total returns under Bull, Base, and Bear scenarios so you can quickly see whether a stock looks undervalued or overvalued.
If you’re not sure what to enter, TIKR automatically fills in each input using analysts’ consensus estimates, giving you a quick, reliable starting point.
See a stock’s true value in under 60 seconds (Free with TIKR) >>>