Key Stats for CME Group Stock
- Past-Week Performance: 3%
- 52-week Range: $233 to $291
- Valuation Model Target Price: $319
- Implied Upside: 11.6% over 1.9 years
Value your favorite stocks like CME Group with 5 years of analysts’ forecasts using TIKR’s new Valuation Model (It’s free) >>>
What Happened?
CME Group Inc. stock rose about 3% over the past week, trading higher across most sessions and finishing near $286, close to recent highs. Shares held near the upper end of their recent range as buying pressure remained steady.
The move was driven by continued strength in futures and options trading, particularly across interest rate, energy, and metals contracts.
Elevated market uncertainty kept trading volumes active, which directly benefits CME because higher contract activity translates into higher transaction revenue and stronger near-term earnings visibility.
Ongoing macro uncertainty supported hedging and trading demand, reinforcing confidence that CME’s volume-driven business can remain resilient even as broader markets stay volatile.
Analyst updates during the period were mixed but stable. Jefferies Financial Group trimmed its price target to $302 from $304 and maintained a Buy rating. JPMorgan Chase raised its target to $262 from $256 while keeping an Underweight rating.
UBS reaffirmed a Neutral rating, Morgan Stanley lowered its target to $319 from $320 with an Overweight rating, and Deutsche Bank previously raised its target to $318 from $310 with a Buy rating. These adjustments kept the Street’s average target near $292, according to MarketBeat.
Overall, the weekly gain reflects confidence in CME’s trading activity and earnings durability rather than a shift in analyst sentiment.
See analysts’ growth forecasts and price targets for CME Group (It’s free) >>>
Is CME Group Undervalued?
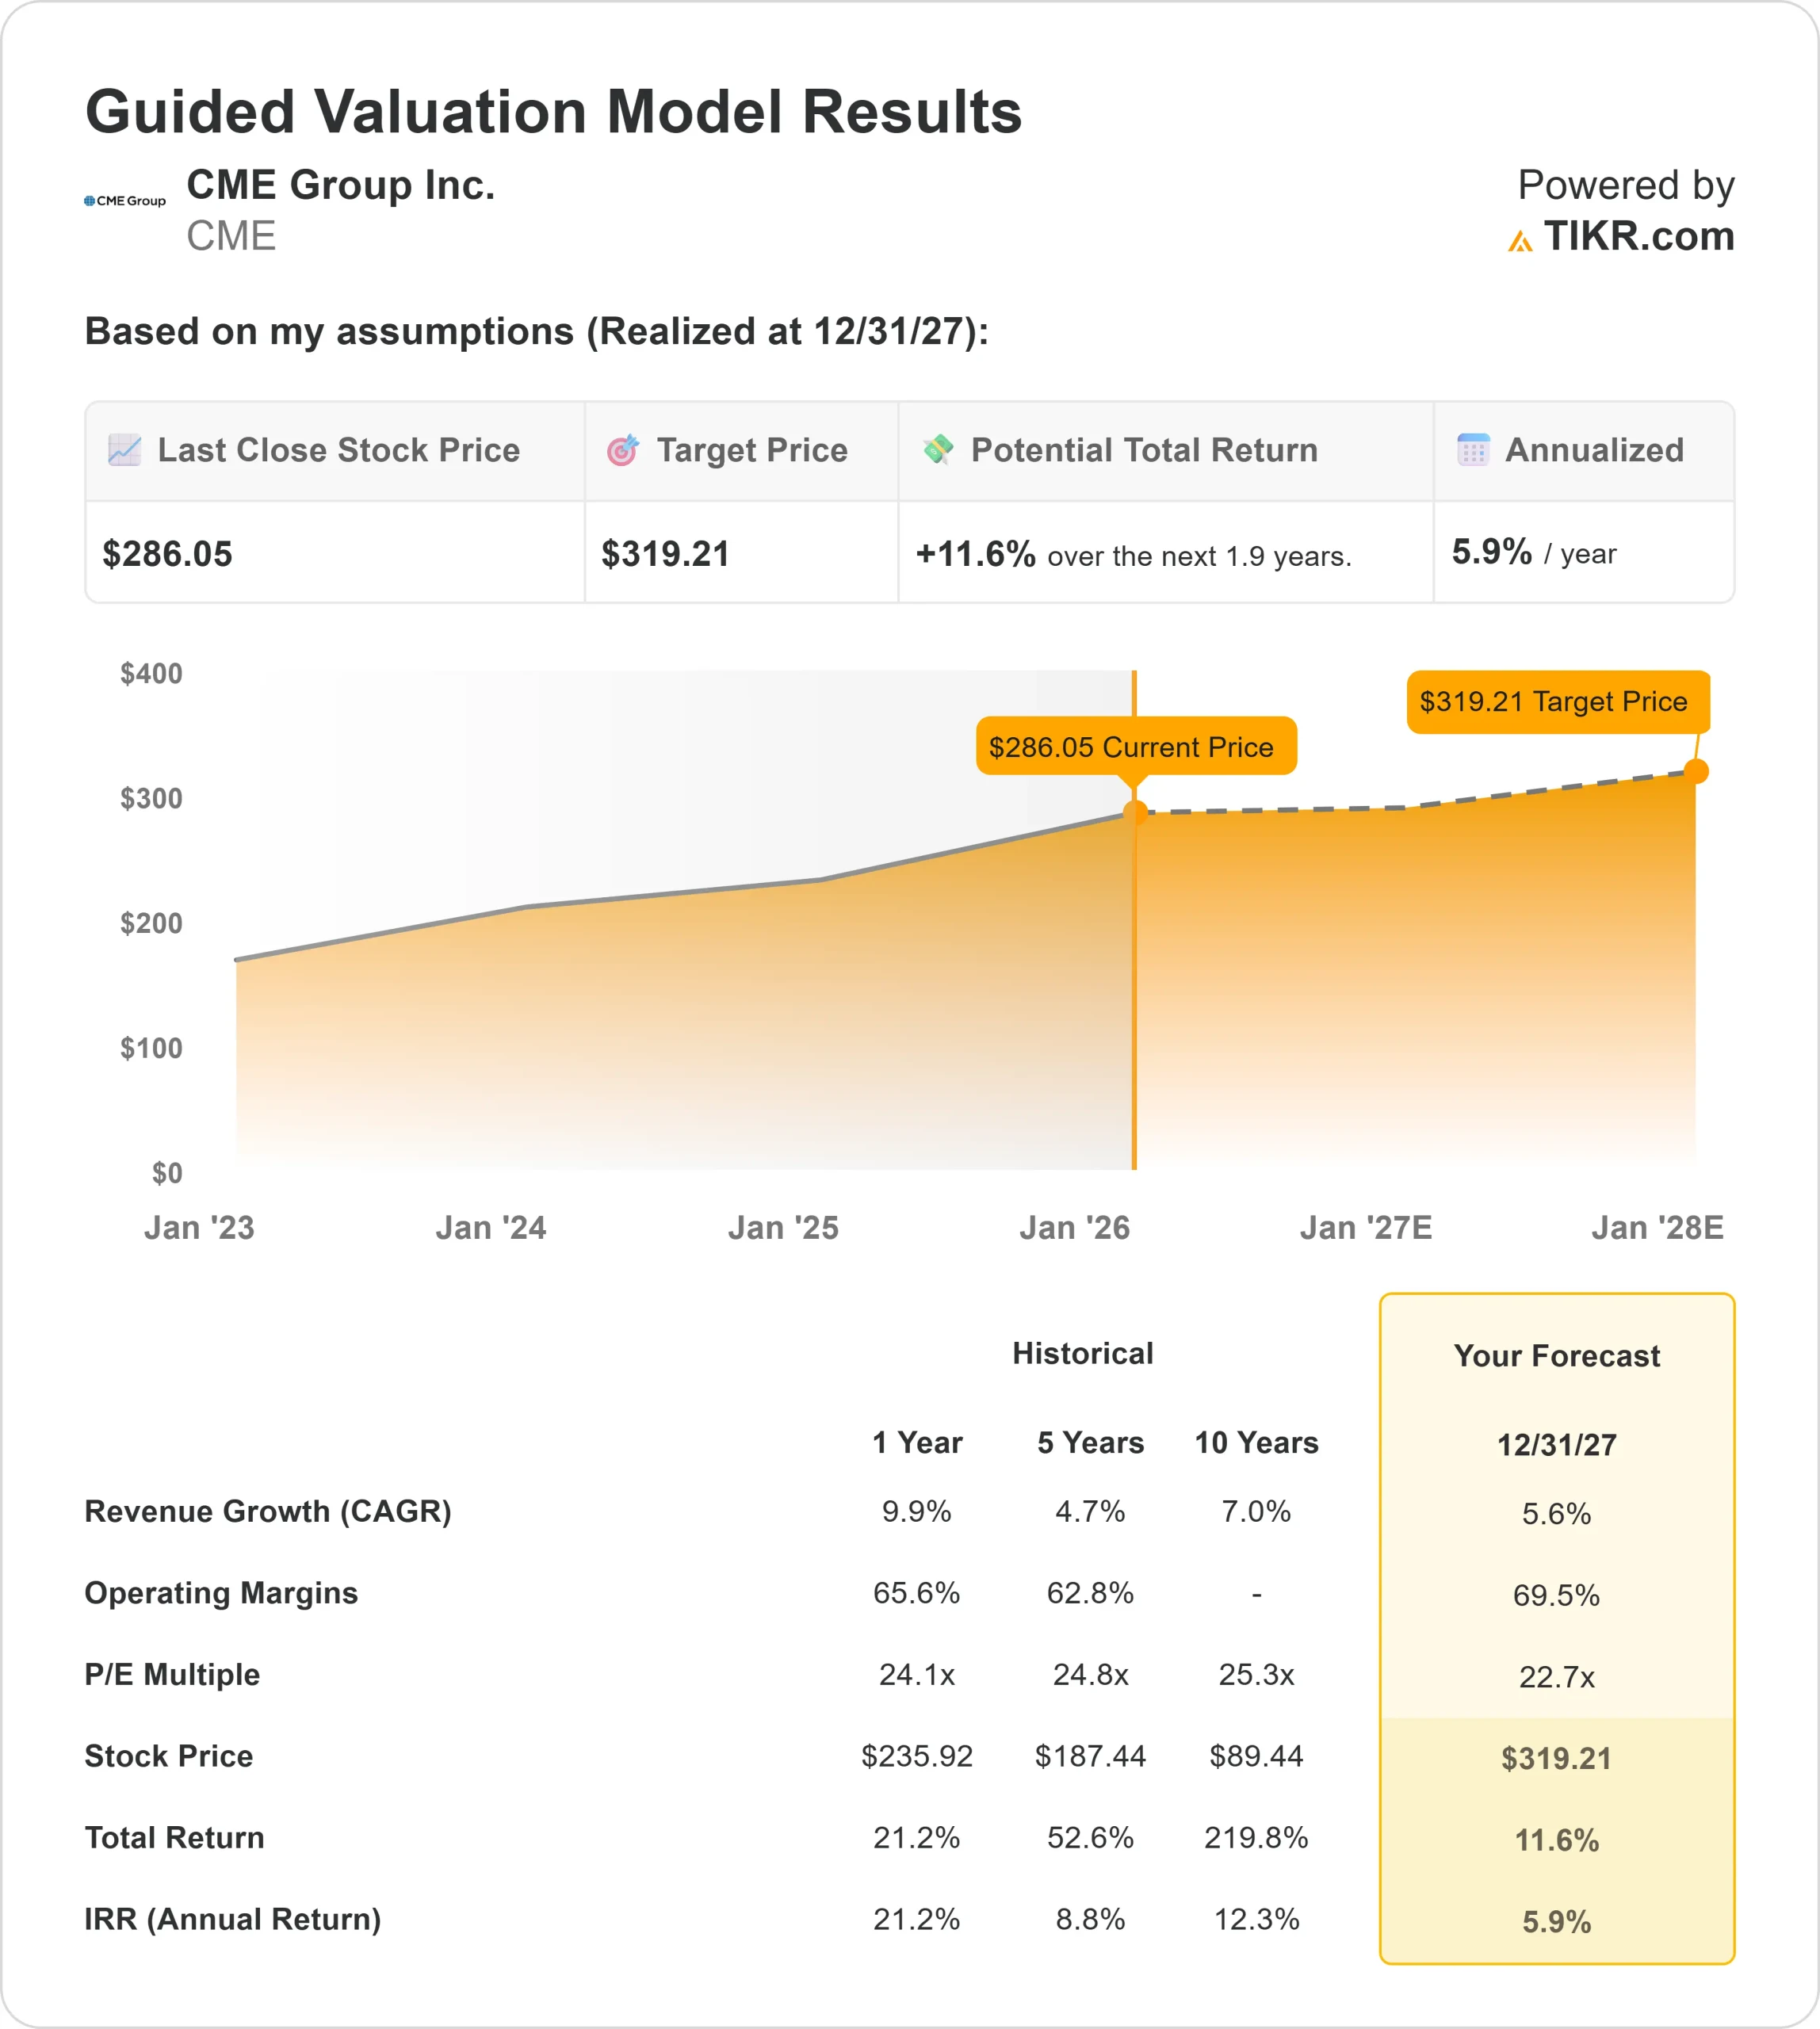
Under valuation model assumptions, the stock is modeled using:
- Revenue Growth (CAGR): 5.6%
- Operating Margins: 69.5%
- Exit P/E Multiple: 22.7x
Based on these inputs, the model estimates a target price of $319, implying about 11.6% total upside from recent levels over the next 1.9 years, suggesting the stock is modestly undervalued.
Over the next 12 months, results are likely driven by whether elevated trading volumes across interest rate and commodity products remain sustained as macro uncertainty persists, supporting transaction-based revenue growth.
Product mix remains an important contributor, with options and international contracts carrying higher average revenue per contract and improving operating leverage within CME’s largely fixed-cost model.
At current levels, CME Group appears undervalued, with future performance tied to volume durability and product mix rather than a broad valuation re-rating.
Estimate a company’s fair value instantly (Free with TIKR) >>>
Value Any Stock in Under 60 Seconds (It’s Free)
With TIKR’s new Valuation Model tool, you can estimate a stock’s potential share price in under a minute.
All it takes is three simple inputs:
- Revenue Growth
- Operating Margins
- Exit P/E Multiple
From there, TIKR calculates the potential share price and total returns under Bull, Base, and Bear scenarios so you can quickly see whether a stock looks undervalued or overvalued.
If you’re not sure what to enter, TIKR automatically fills in each input using analysts’ consensus estimates, giving you a quick, reliable starting point.
See a stock’s true value in under 60 seconds (Free with TIKR) >>>