
We’ve all seen companies report “record earnings” only for the share price to go nowhere. Often, the culprit is hiding in plain sight: Share Dilution. When a company issues a massive amount of stock-based compensation (SBC), it is effectively printing new currency. If the share count grows faster than the business, your slice of the pizza gets smaller every year, even as the pizza itself gets bigger.
For a long time, tracking this “hidden expense” was a nightmare. You had to dig through the Statement of Cash Flows to find the SBC add-back and then cross-reference it with the “Weighted Average Shares” row on the Income Statement. For the retail investor, it was easy to miss the slow creep of dilution that quietly erodes long-term returns.
The good news is that 2026 has brought a suite of tools that make this forensic work effortless. You can now visualize share-count trends and audit the real cost of management’s pay packages with a single click. The following platforms are the best free resources for ensuring that a company’s growth is actually trickling down to the people who own the stock, not just the people who work there.
1. TIKR
TIKR is the most robust platform for investors who want to treat dilution like the real economic expense it is. While most tools only show the current share count, TIKR provides historical data for over 100,000 global stocks across multiple years. This allows you to see exactly how the share count has evolved through acquisitions, stock splits, and aggressive employee grant programs.
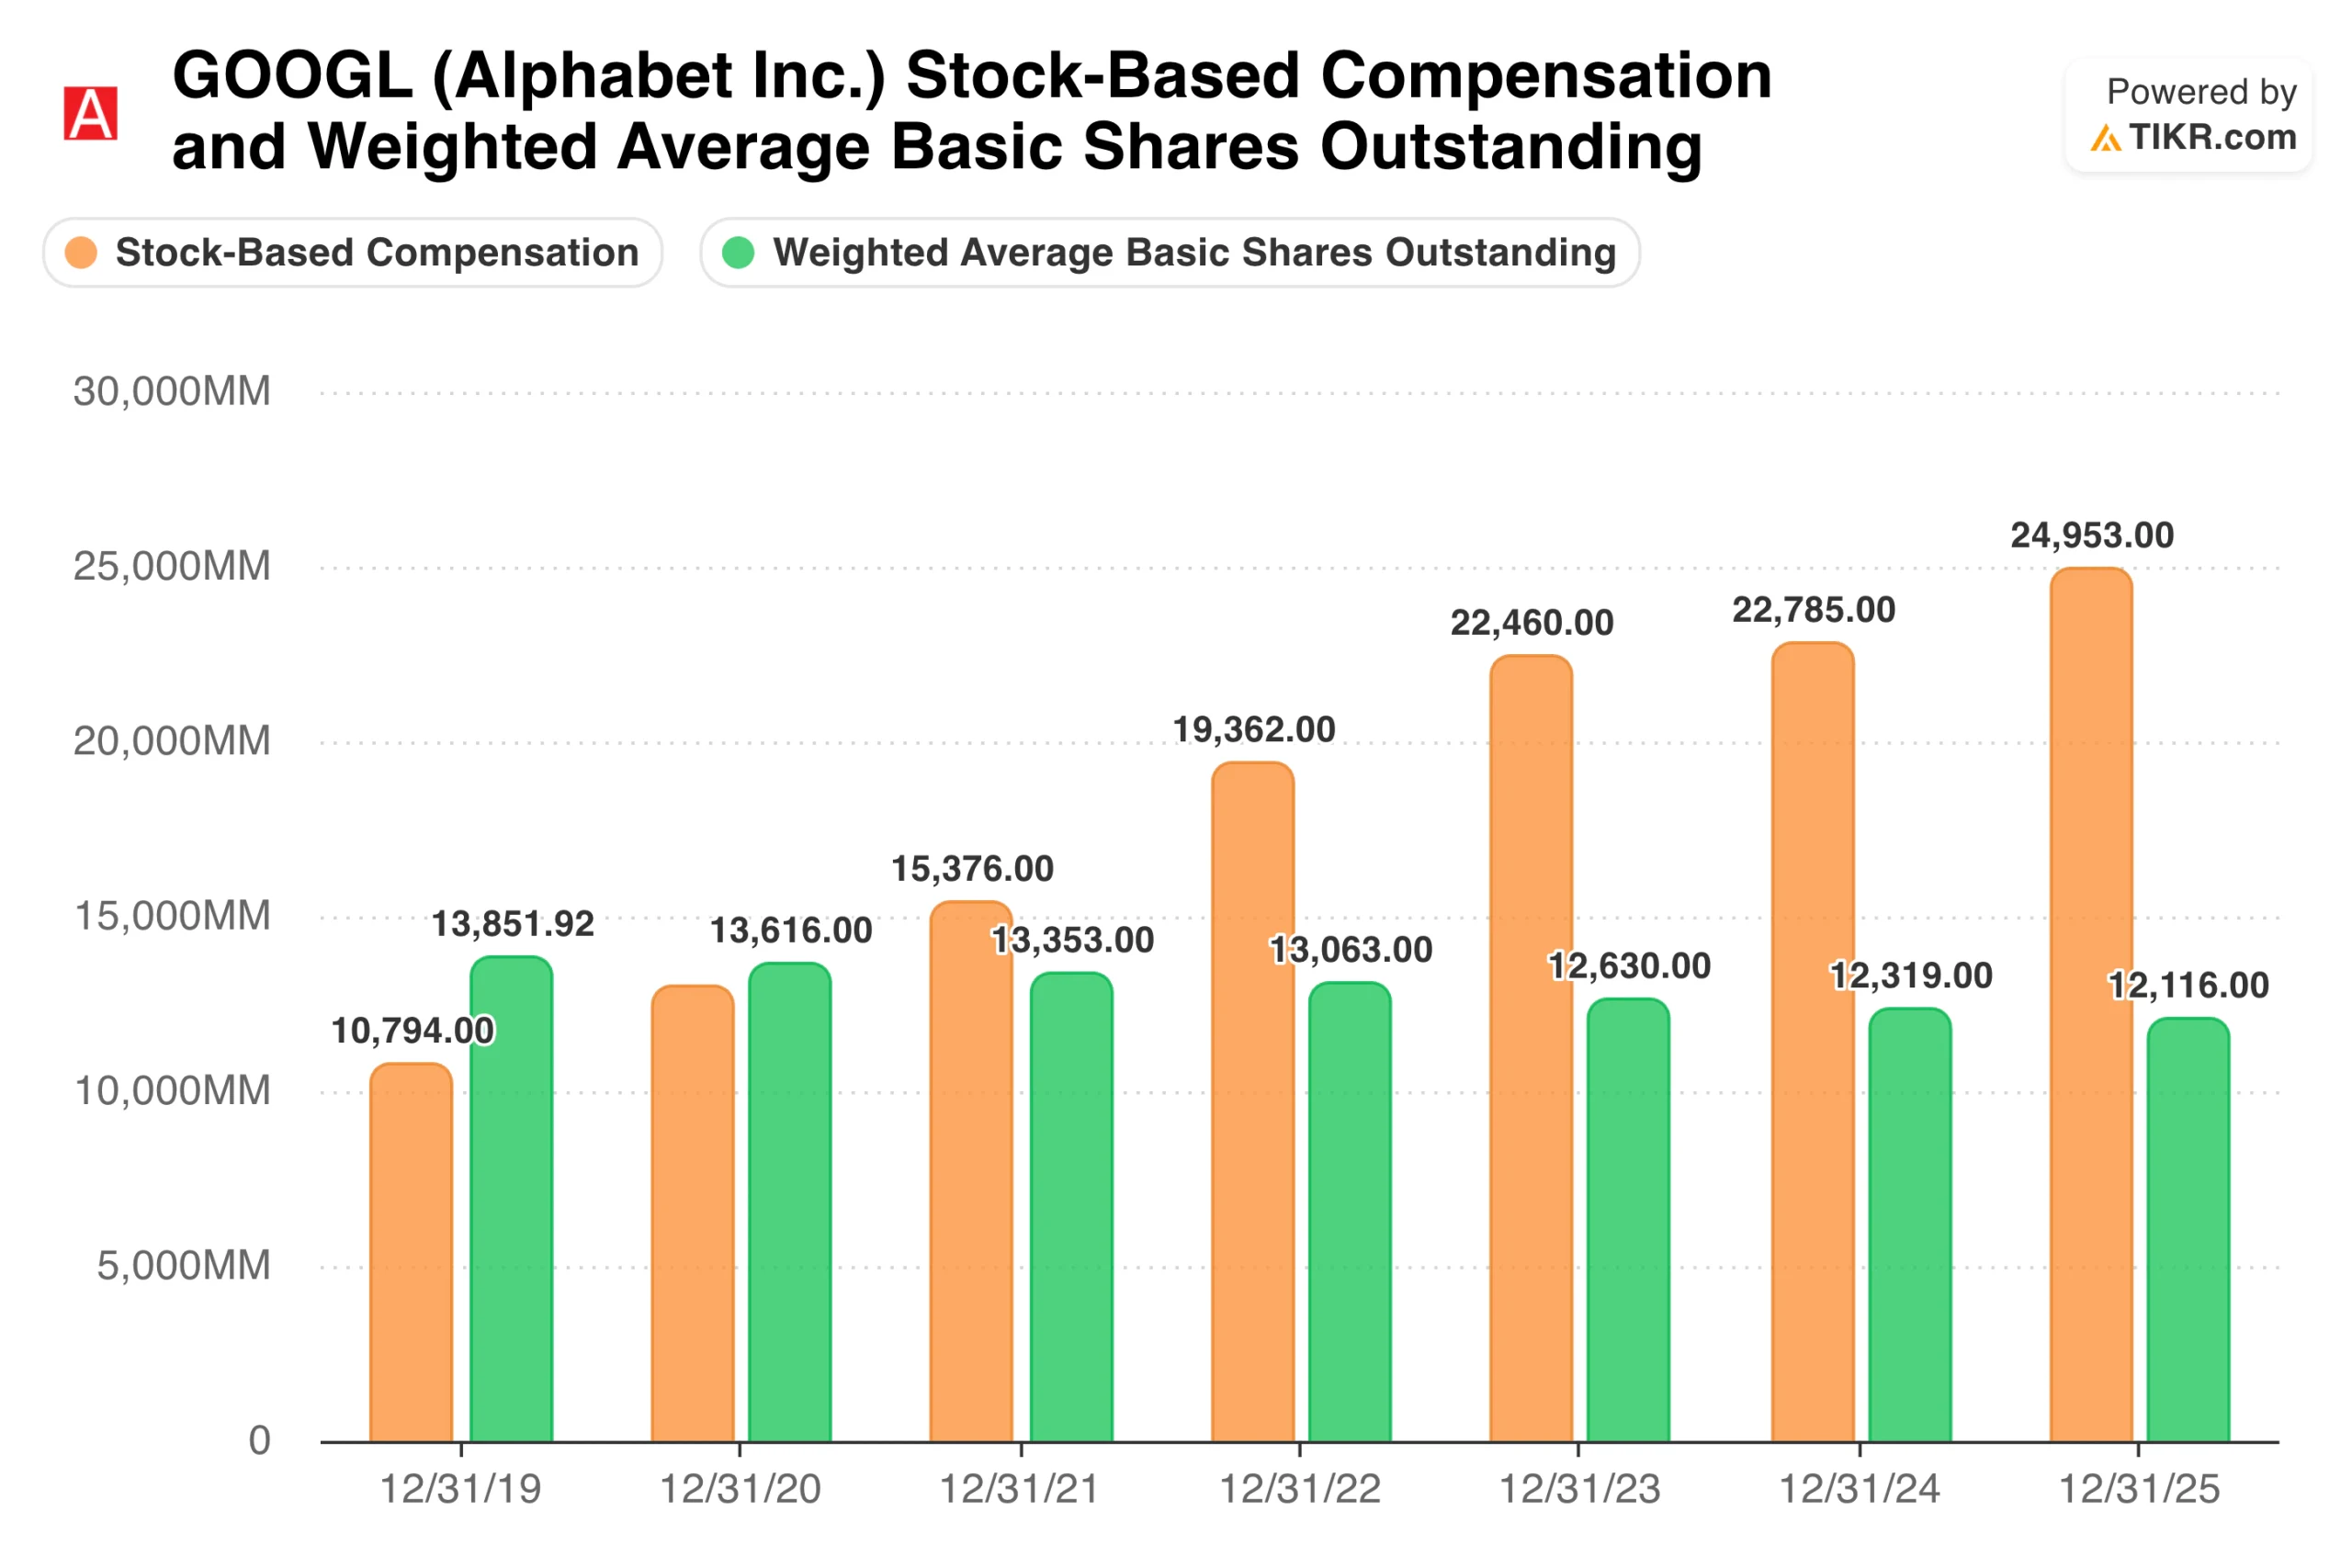
The platform makes it easy to spot when a company is using buybacks merely to “offset” the dilution from stock-based compensation. By overlaying the SBC expense from the cash flow statement against the total share count, you can quickly determine if management is returning capital to you or just cleaning up their own equity issuances.
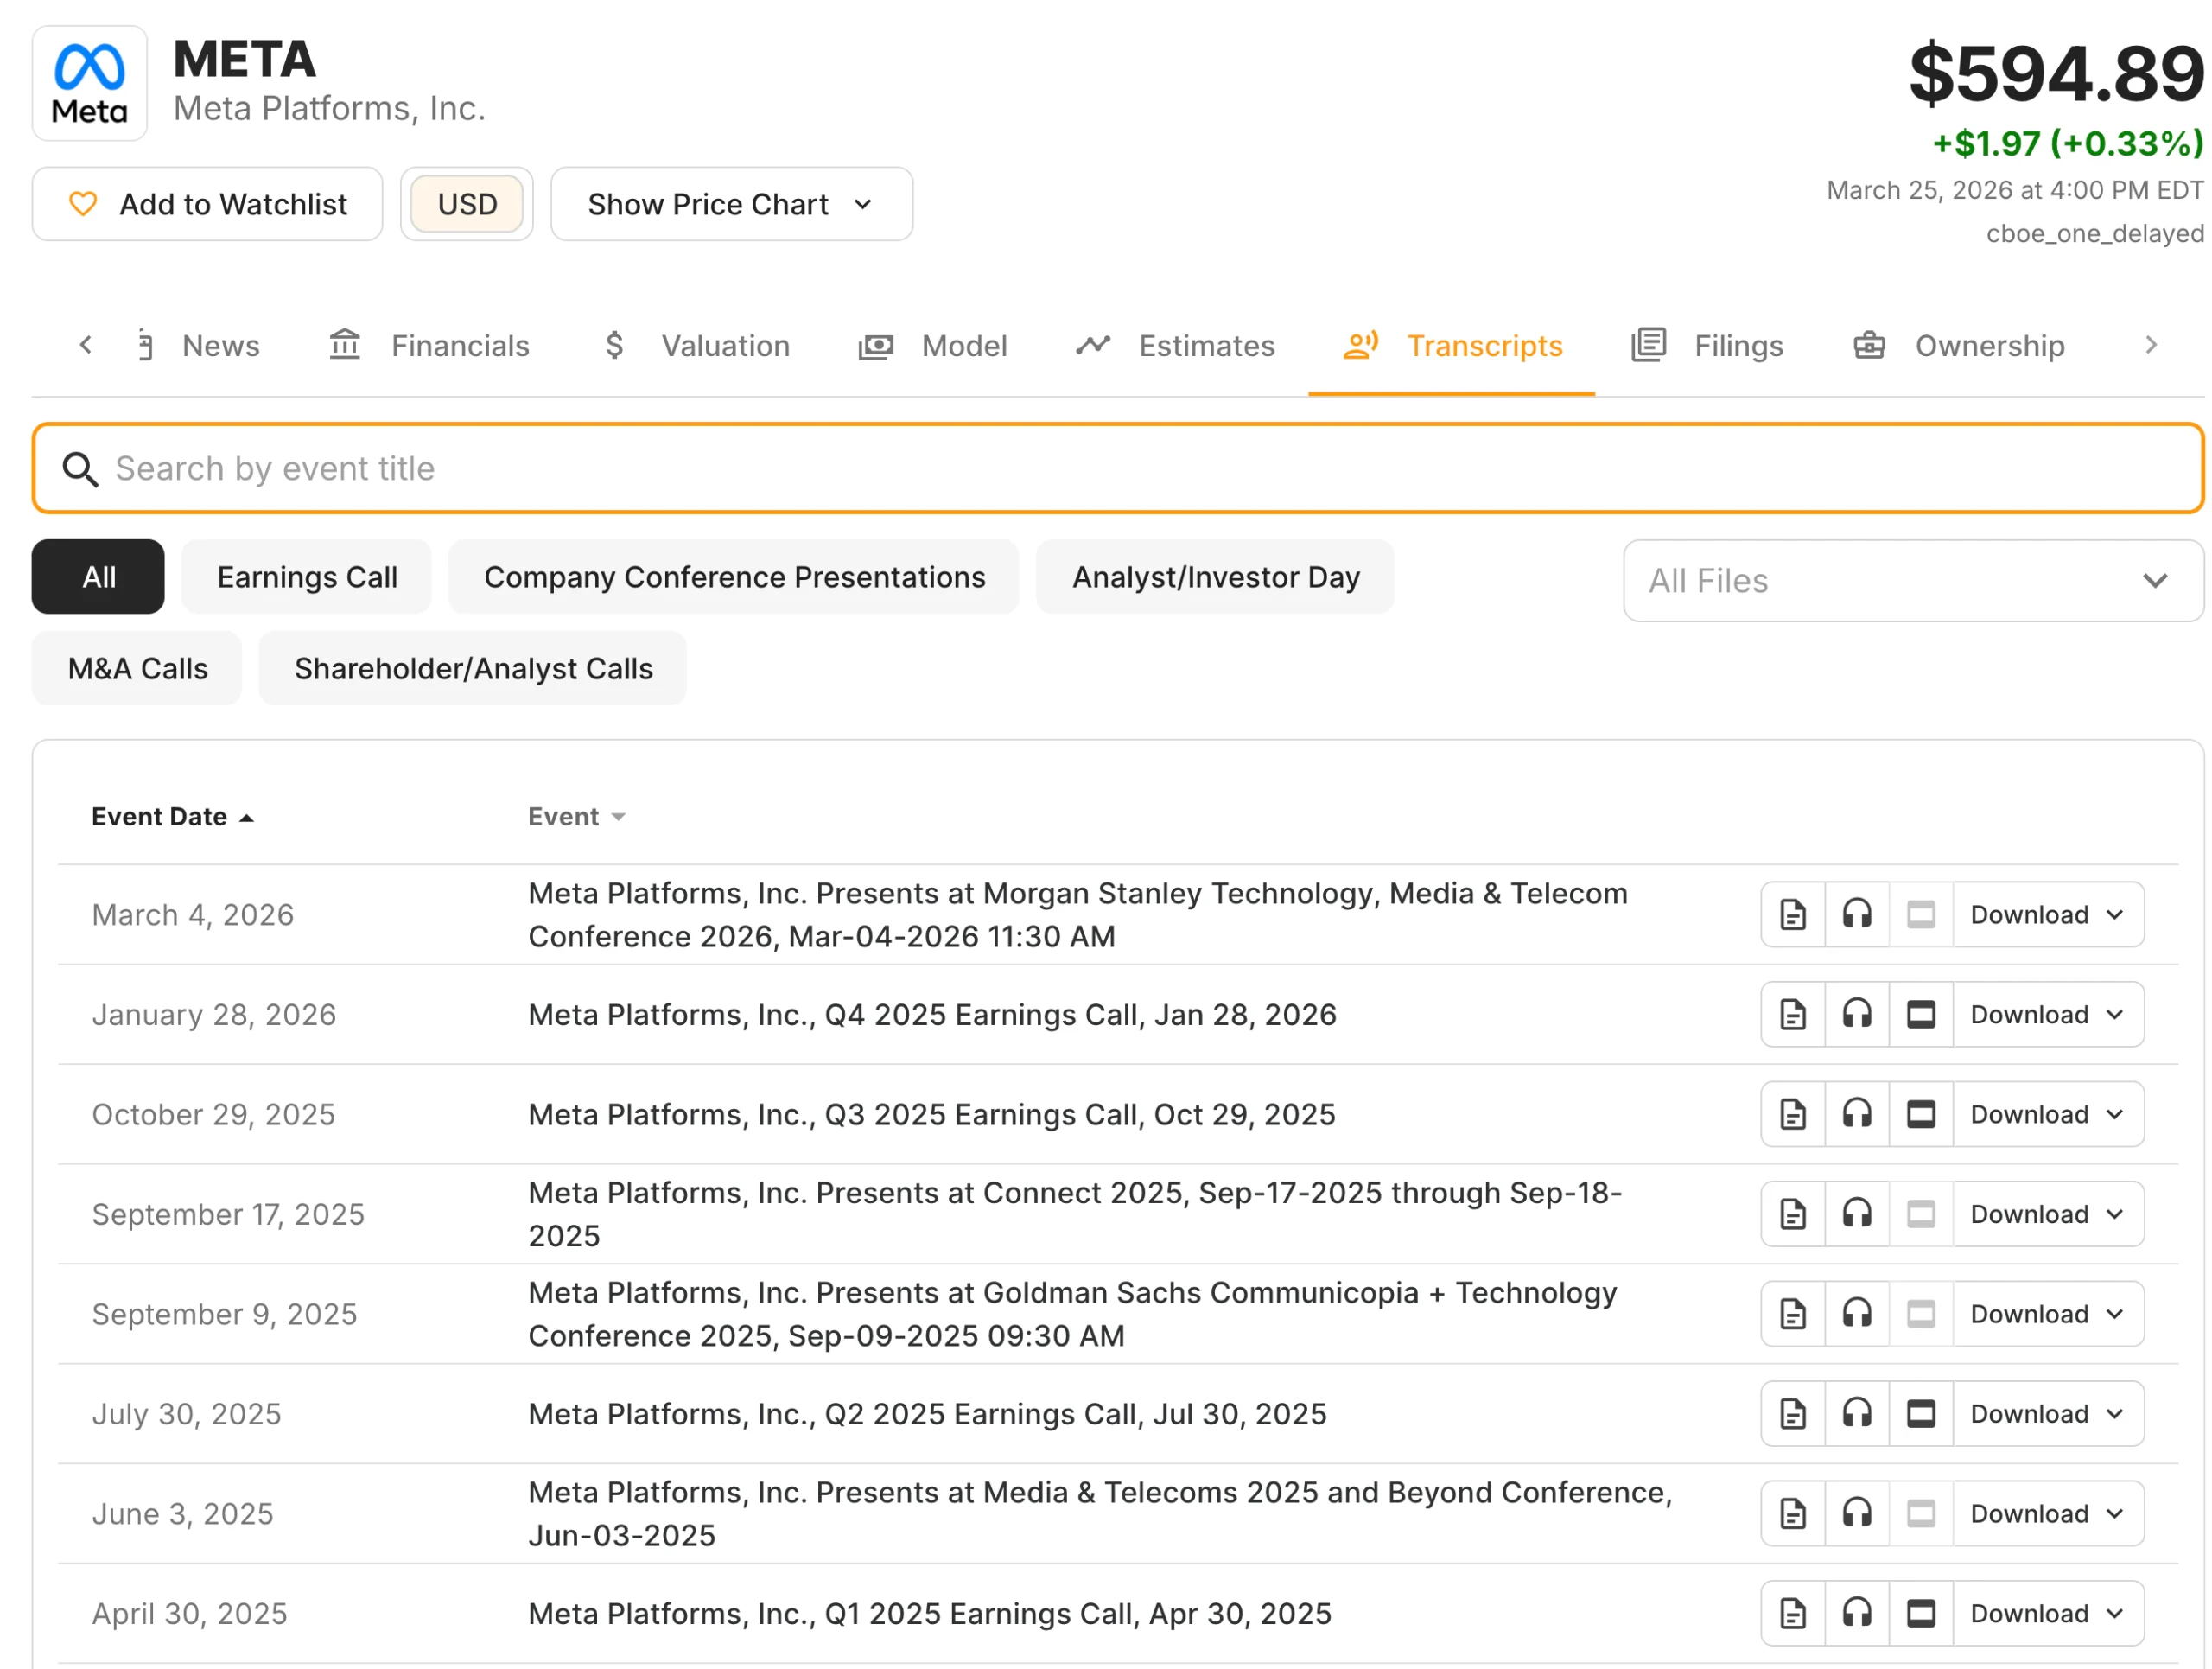
Beyond the raw numbers, TIKR’s Transcript Search allows you to go behind the curtain and hold management accountable. You can search years of earnings calls and investor presentations for keywords like “SBC” or “dilution” to hear exactly how executives justify their equity grants. This context helps you decide whether a management team is acting like a true partner or just a pirate raiding the cap table to pay for their own bonuses.
Best Features:
- 15+ Years of Share Count History: Track long-term dilution trends to ensure management isn’t quietly eroding your ownership stake over time. This historical view is vital for separating companies with “clean” growth from those addicted to equity-based funding.
- Global SBC Standardization: Access detailed stock-based compensation data for 100,000+ stocks across international markets, removing the complexity of differing global accounting standards. This allows you to hunt for shareholder-friendly companies in markets that basic tools often ignore.
- Earnings Quality Visualization: Instantly chart SBC expense against Net Income to see if a company’s “adjusted” profits are being propped up by non-cash charges. By visualizing this relationship, you can identify if a business is truly profitable or merely shifting labor costs into dilution.
- Detailed Insider Transactions: Monitor exactly when executives are selling the shares they’ve been granted to gauge their true confidence in the business. This forensic detail helps you determine if the people running the company are long-term builders or just short-term sellers.
Evaluate a company’s stock-based compensation, net income, and total revenues (Free with TIKR) >>>
2. GuruFocus
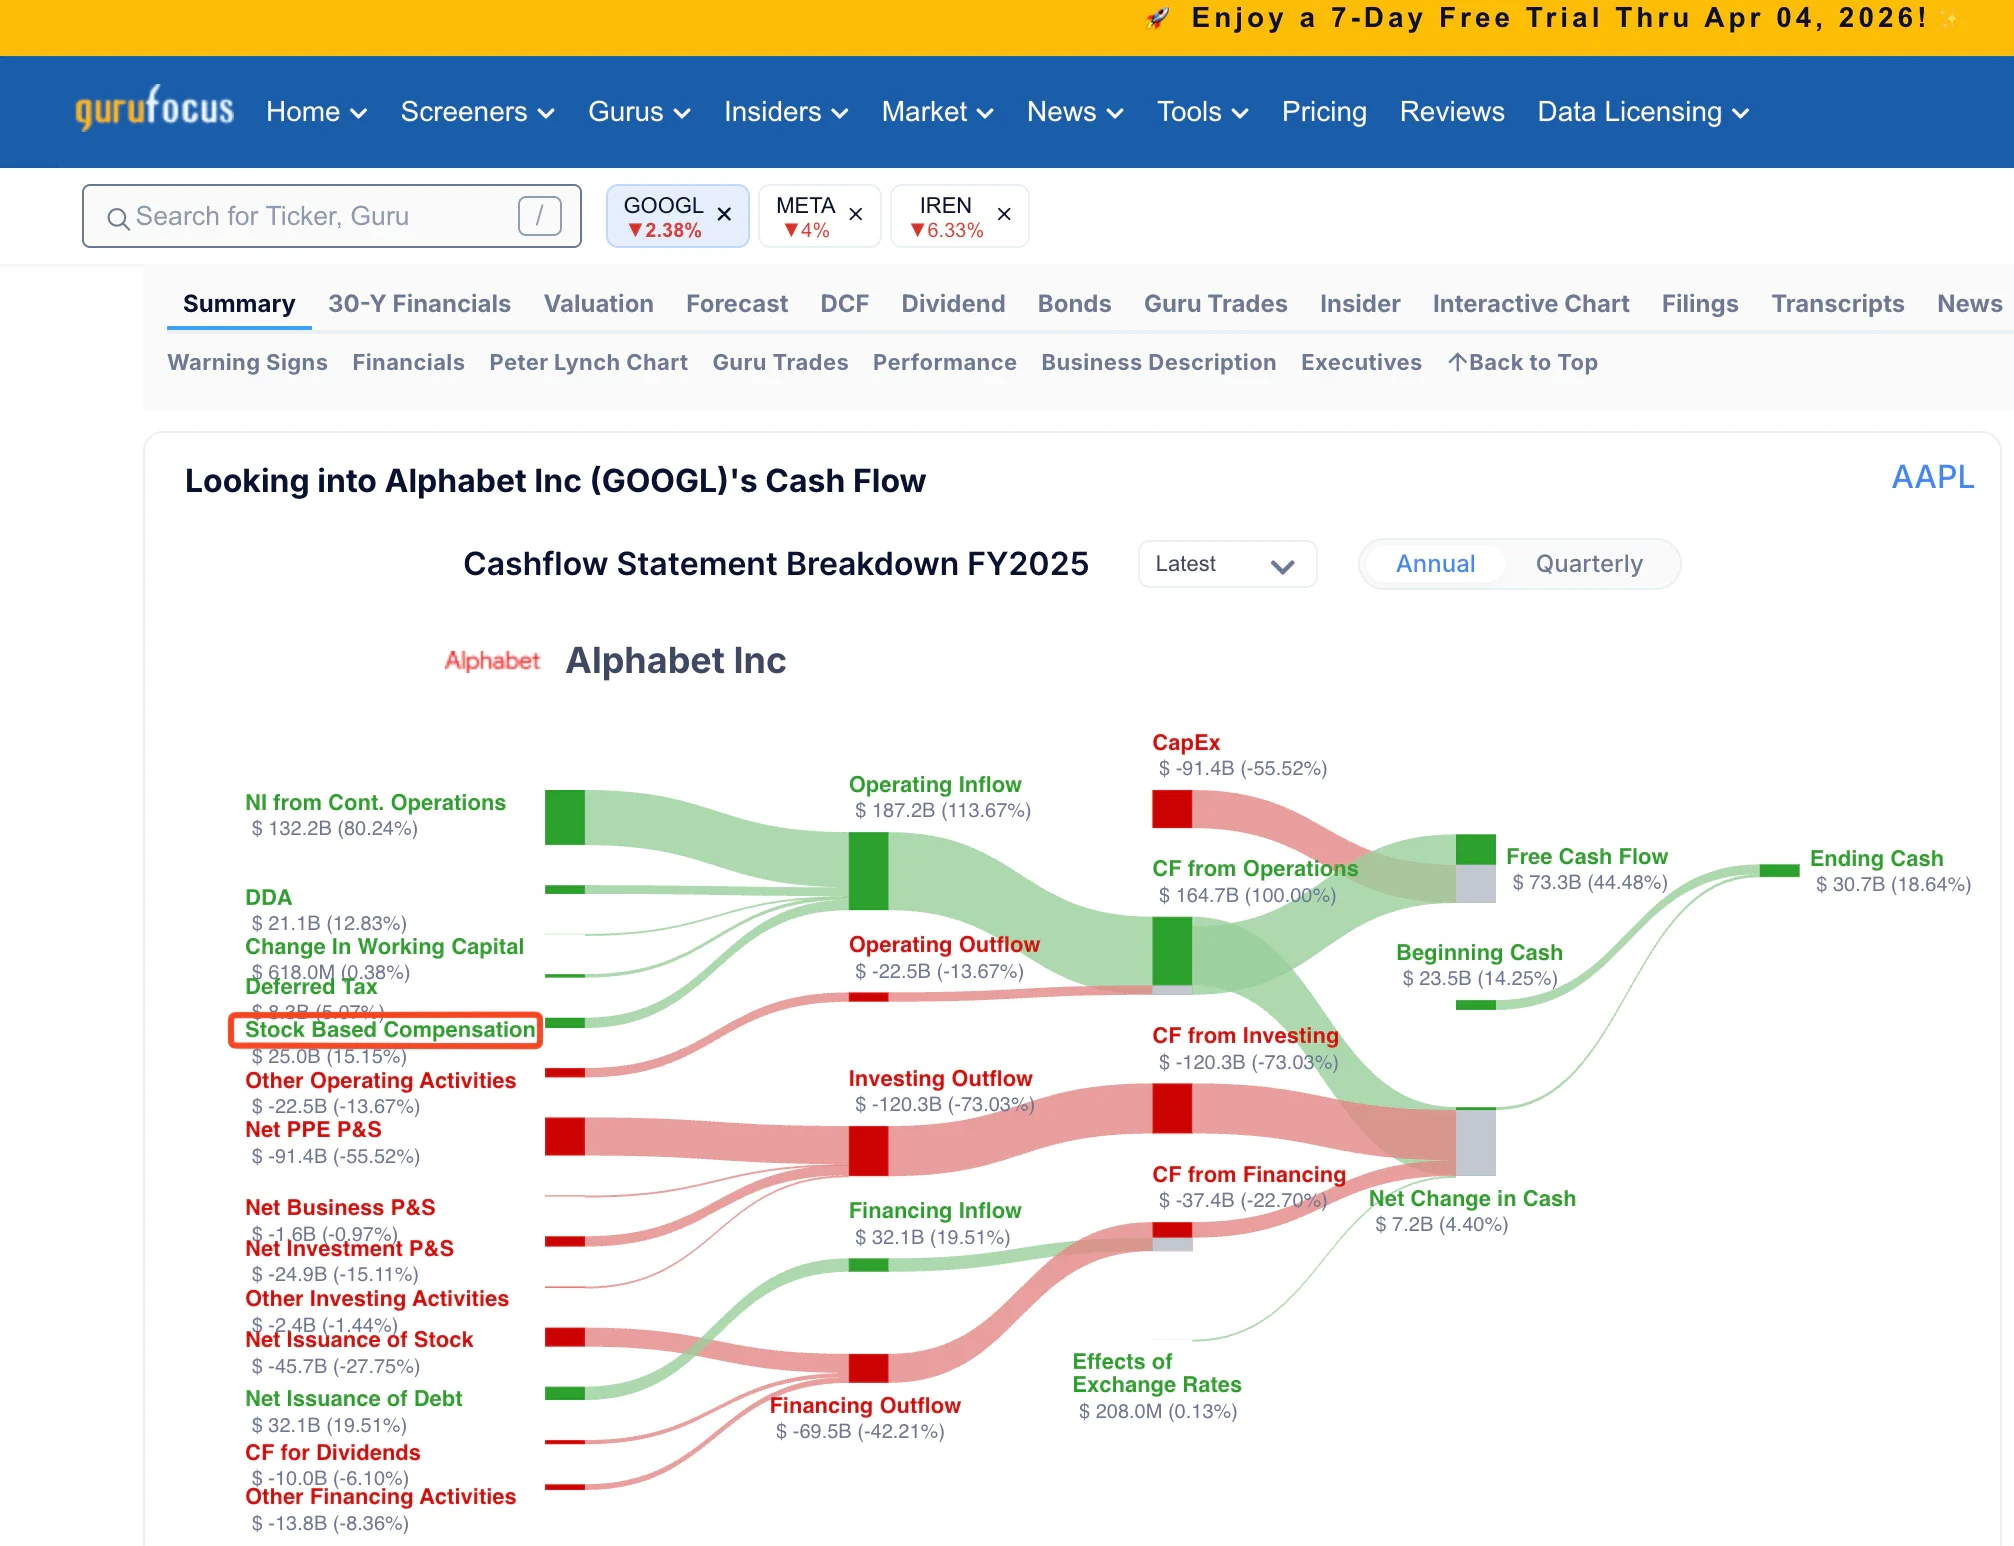
GuruFocus is a comprehensive research site that provides free access to up to 30 years of financial data, making it a treasure trove for long-term investors. It includes specific line items for stock-based compensation expense and dilution metrics that are often buried in other platforms. Its built-in scores help you assess the dilutive impact of SBC by comparing it directly against Free Cash Flow.
The platform is ideal for those who want to see the “long tail” of a company’s capital allocation. By tracking share counts over three decades, GuruFocus helps you identify companies with a generational commitment to avoiding dilution and rewarding their shareholders.
Best Features:
- GuruFocus does this best by offering 30-year historical trends that show exactly how much value has been created, or destroyed, by share count changes over the life of the business.
Review basic shares outstanding for any stock in less than 60 seconds with TIKR (It’s free) >>>
3. Stock Analysis
Stock Analysis is a clean, completely free website that excels at making the Income Statement easy to digest. It offers high-quality views of shares outstanding and SBC line items, without the visual clutter found on older financial sites. This makes it particularly strong for investors who want to perform a quick trend analysis to see if a company is managing its equity responsibly.
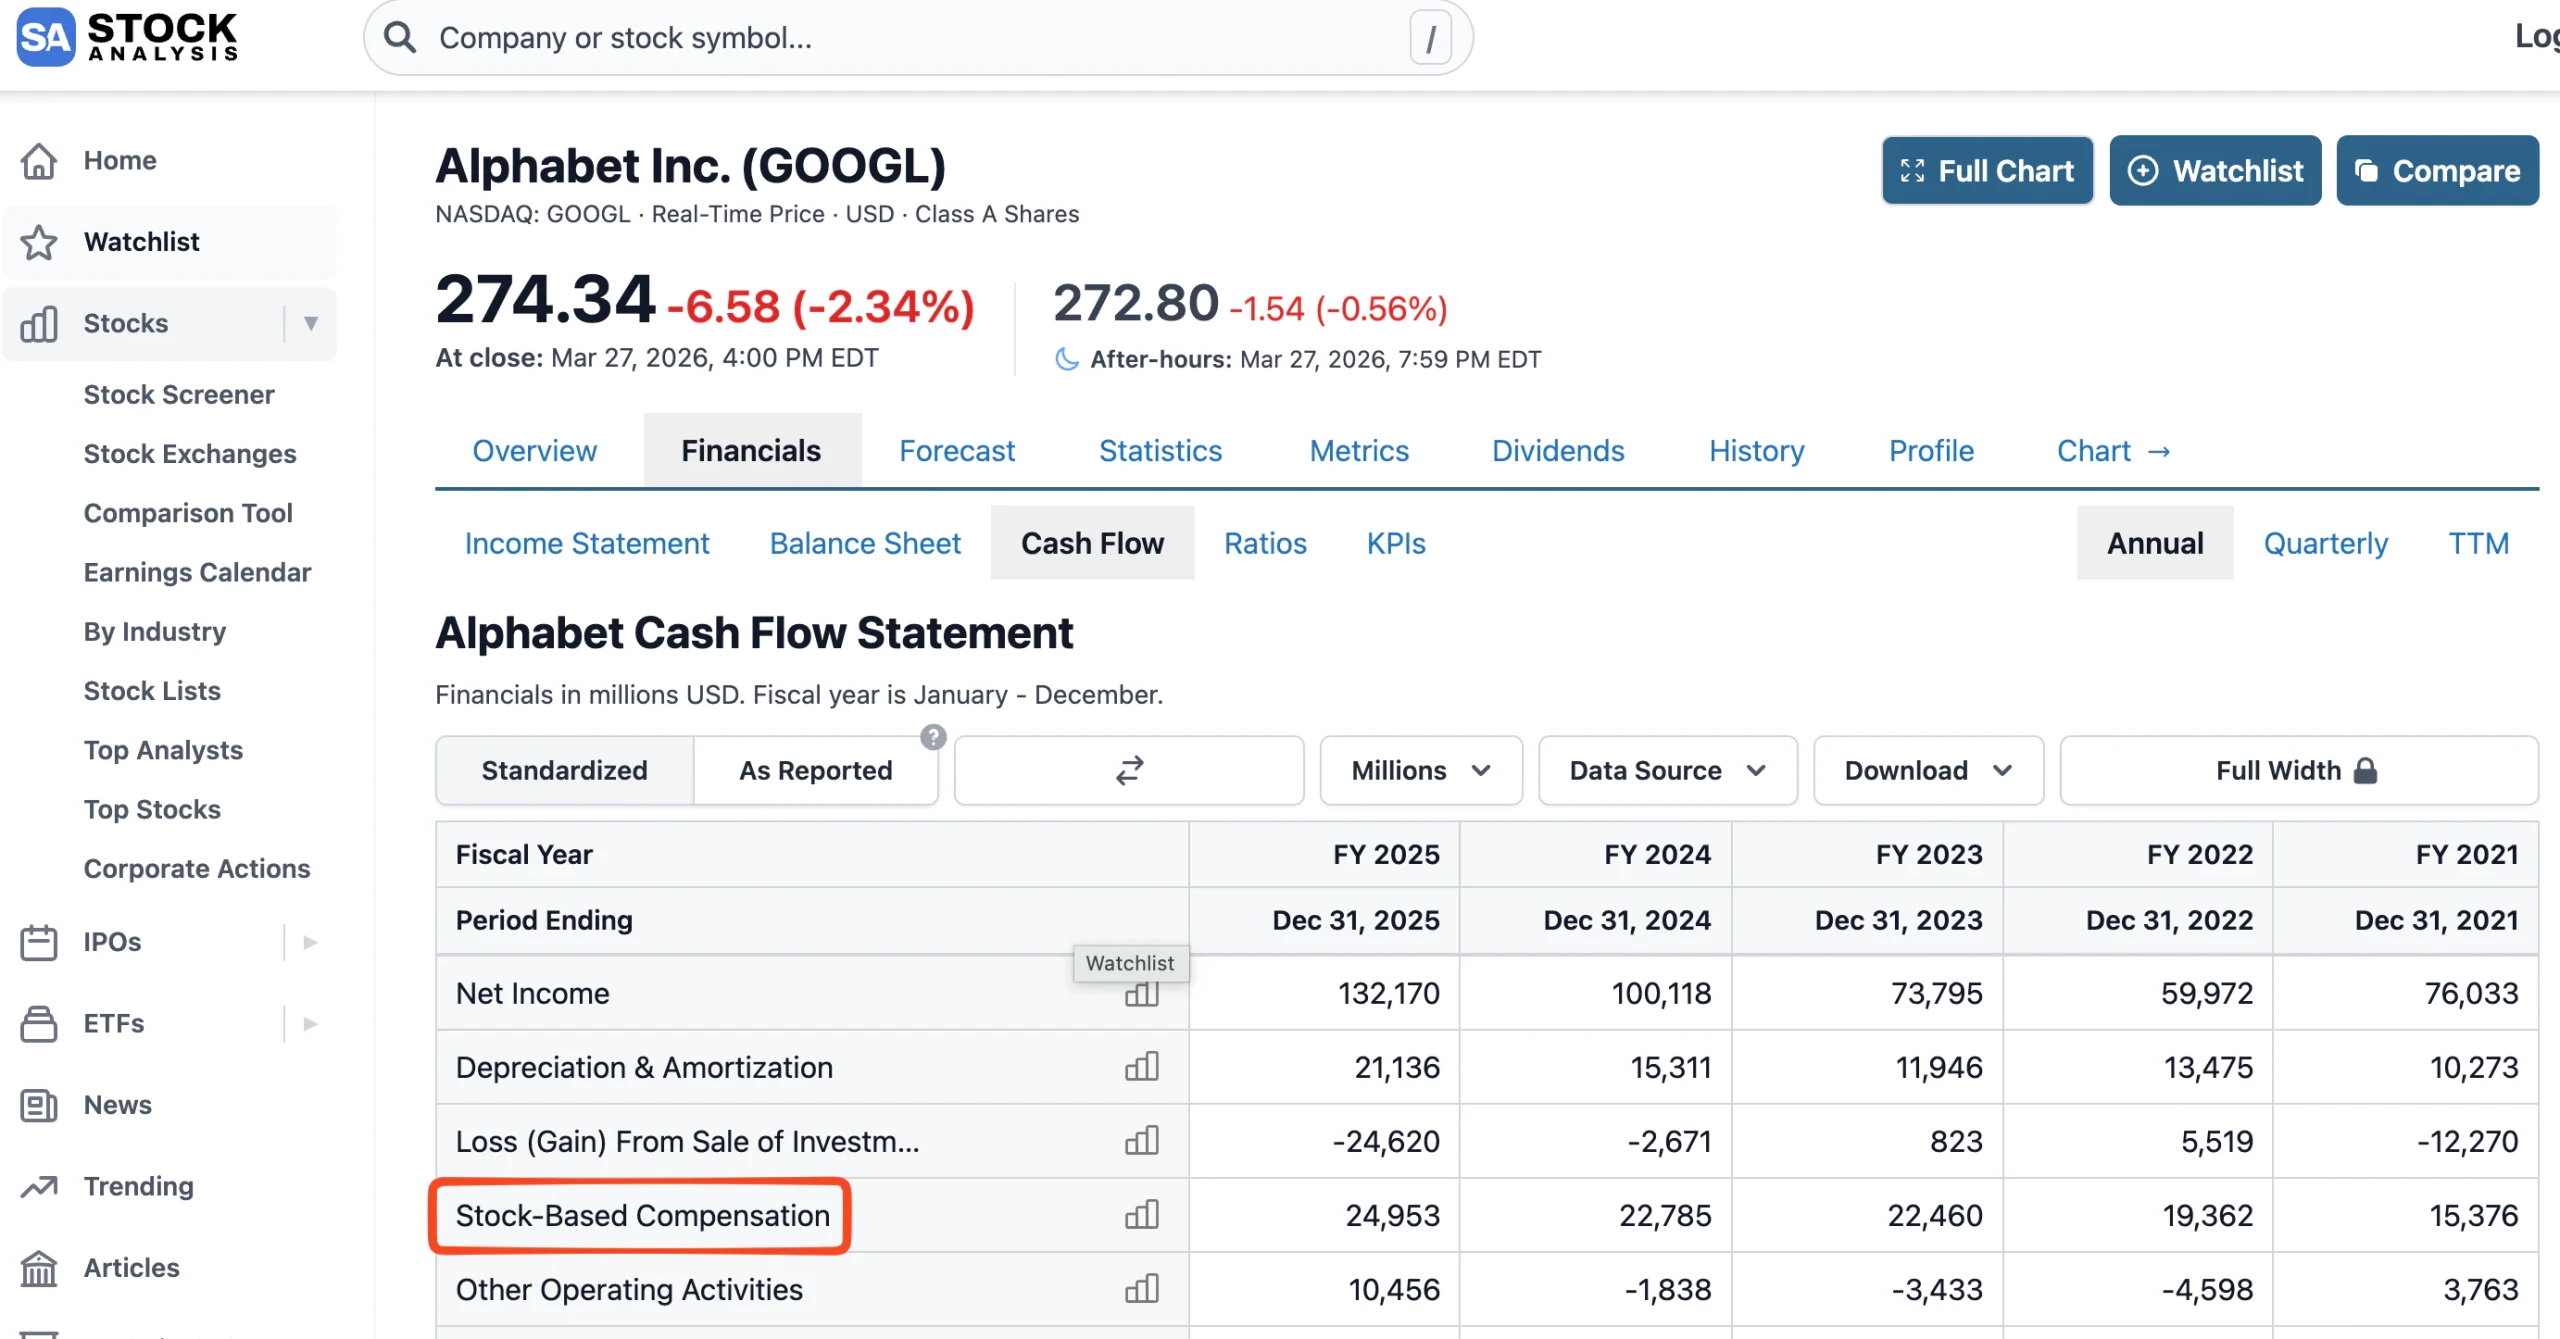
The platform’s strength lies in its simplicity. Once you look up a stock, the financial tabs are laid out so clearly that you can spot a spike in shares outstanding or an aggressive SBC grant program in a matter of seconds.
Best Features:
- Stock Analysis does this best by providing a Polished User Interface that highlights the relationship between share issuance and earnings-per-share growth.
4. Macrotrends
Macrotrends is the go-to resource for long-term historical charts on shares outstanding. While other tools focus on tables of numbers, Macrotrends specializes in visual storytelling. It provides multi-year charts of diluted shares and related equity metrics, allowing you to spot dilution patterns at a glance.
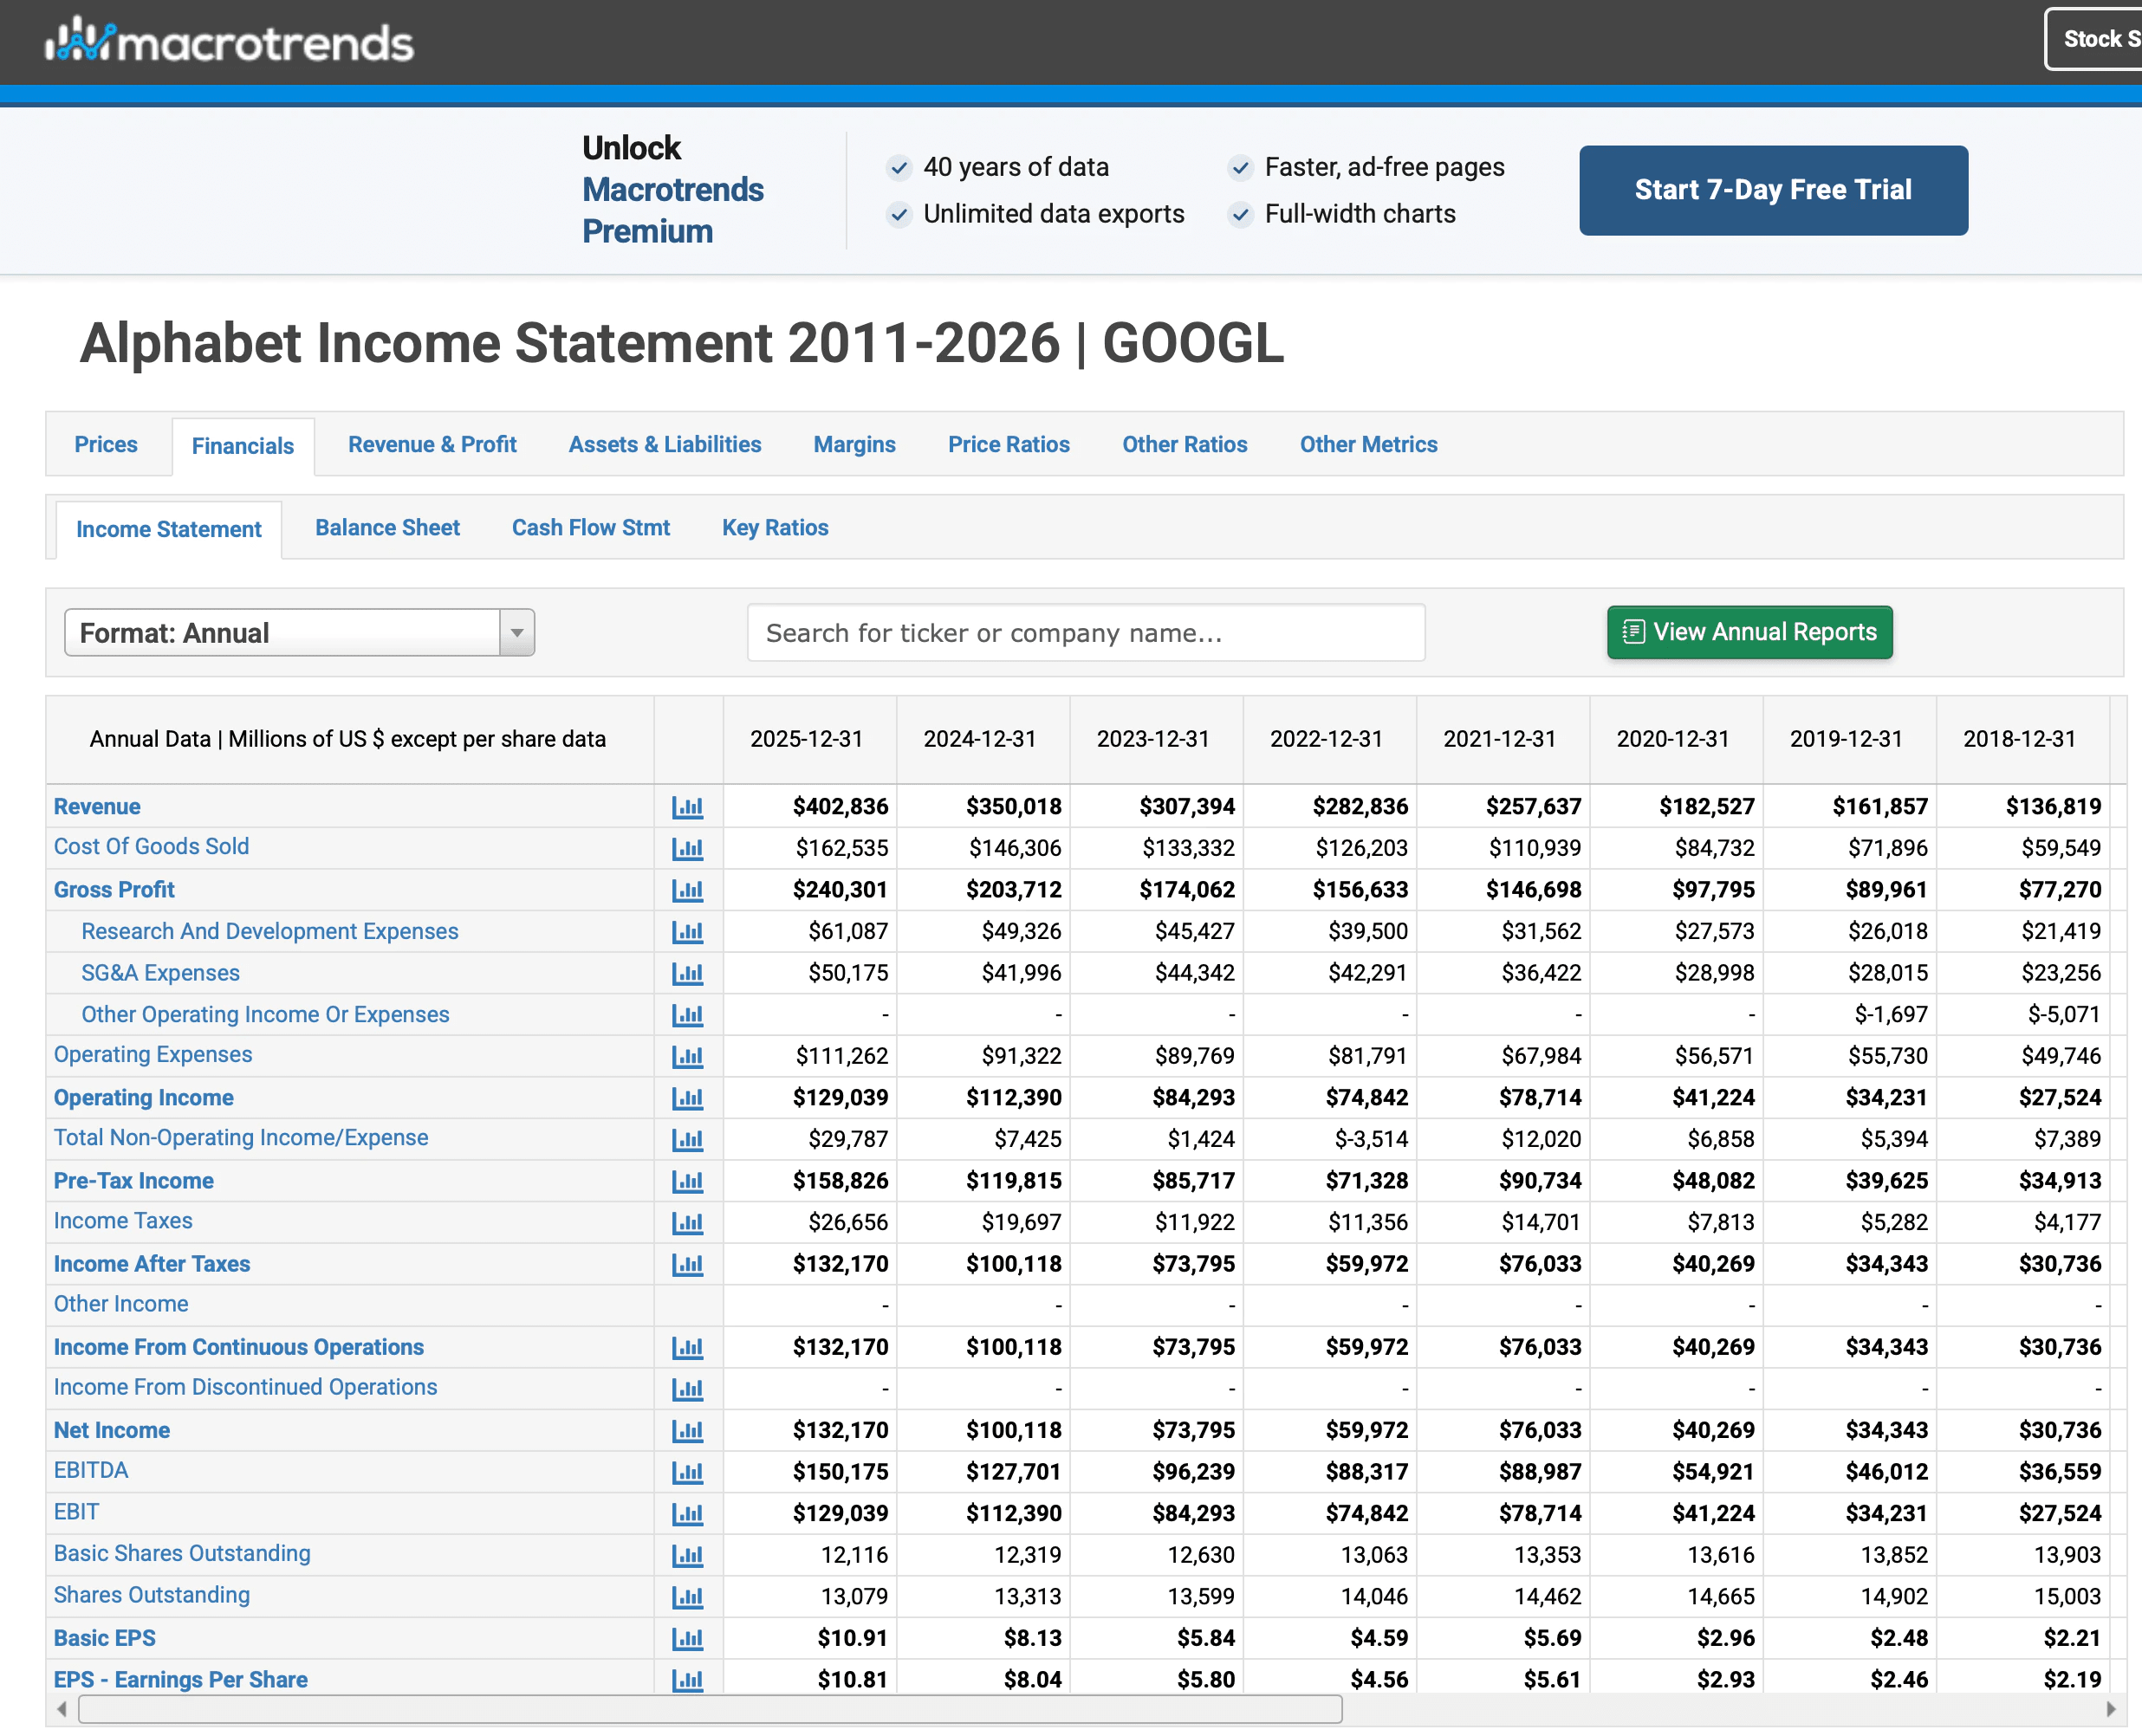
The platform is essential for contextualizing stock-based compensation within a company’s broader financial history. If a company claims to be “buyback-driven” but the Macrotrends chart shows a flat or rising share count, you know immediately that the buybacks are just a facade for high employee pay.
Best Features:
- Macrotrends does this best by offering Visual Share Count Charts that go back decades, making multi-year dilution patterns impossible to miss.
5. WallStreetZen
WallStreetZen is a user-friendly platform that incorporates earnings quality metrics into its broader analysis. It helps you evaluate the real-world effects of SBC on per-share value by assigning “Zen Ratings” based on 115 different factors, including shareholder alignment and capital allocation.
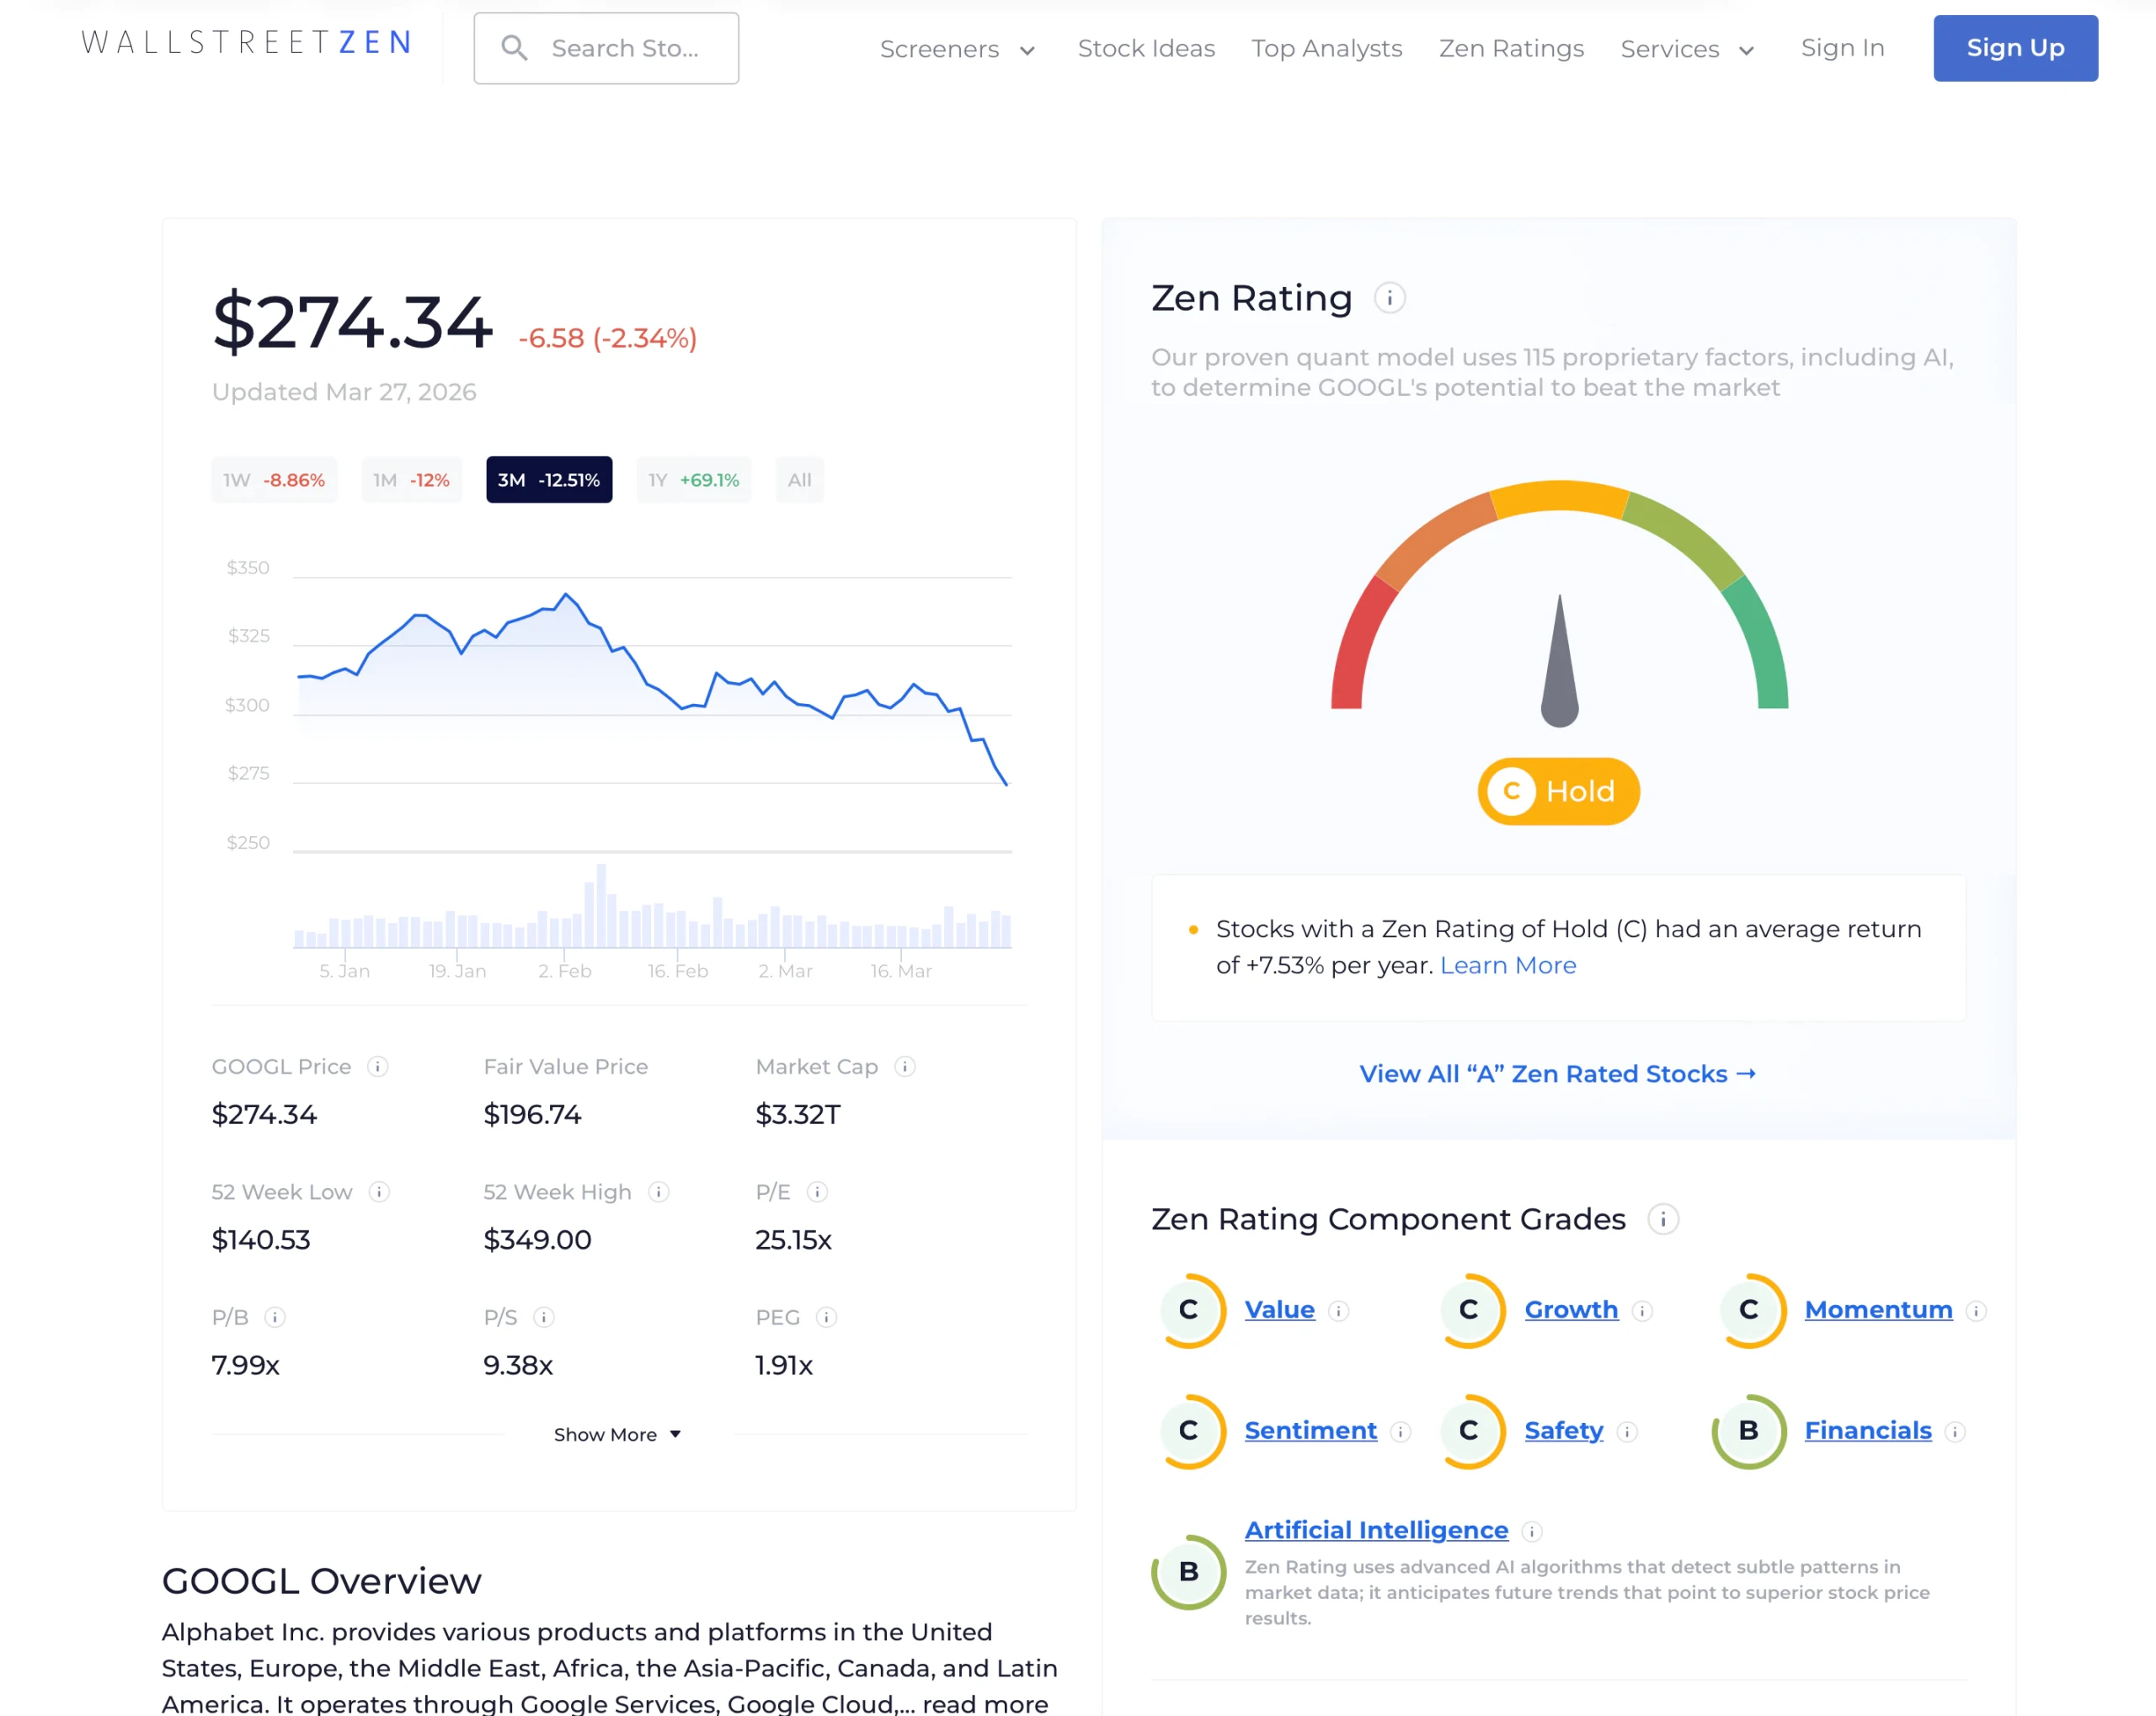
The tool is perfect for the serious part-time investor who wants a quantitative safety check. It quickly identifies if a company is “aggressively diluting” its owners, allowing you to avoid fundamentally weak stocks before they impact your portfolio.
Best Features:
- WallStreetZen does this best by providing Automated Quality Ratings that flag high-dilution companies as a risk to long-term shareholder returns.
Track earnings per share year-over-year changes to quickly review pricing power with TIKR (It’s free) >>>
TIKR Takeaway
A company can report “beat after beat” on earnings, but the share count never lies. TIKR is the only platform that provides the 15-year historical depth and global reach needed to prove a management team is actually growing your per-share value.
By allowing you to audit the divergence between buybacks and actual share reduction, TIKR gives you the tools to expose “hidden” labor expenses. It turns the search for shareholder-friendly companies into an evidence-based audit of a company’s capital allocation integrity.
Value Any Stock in Under 60 Seconds with TIKR
With TIKR’s new Valuation Model tool, you can estimate a stock’s potential share price in under a minute.
All it takes is three simple inputs:
- Revenue Growth
- Operating Margins
- Exit P/E Multiple
If you’re not sure what to enter, TIKR automatically fills in each input using analysts’ consensus estimates, giving you a quick, reliable starting point.
From there, TIKR calculates the potential share price and total returns under Bull, Base, and Bear scenarios so you can quickly see whether a stock looks undervalued or overvalued.
See a stock’s true value in under 60 seconds (Free with TIKR) >>>
Looking for New Opportunities?
- Discover which stocks billionaire investors are purchasing, so you can follow the smart money.
- Analyze stocks in as little as 5 minutes with TIKR’s all-in-one, easy-to-use platform.
- The more rocks you overturn… the more opportunities you’ll uncover. Search 100K+ global stocks, global top investor holdings, and more with TIKR.
Disclaimer:
Please note that the articles on TIKR are not intended to serve as investment or financial advice from TIKR or our content team, nor are they recommendations to buy or sell any stocks. We create our content based on TIKR Terminal’s investment data and analysts’ estimates. Our analysis might not include recent company news or important updates. TIKR has no position in any stocks mentioned. Thank you for reading, and happy investing!