
Key Stats for Asana Stock
- Past-Week Performance: -5.1%
- 52-Week Range: $6 to $19
- Current Price: $6.2
What Happened?
Asana (ASAN) posted its first non-GAAP operating profit in company history at a 9% margin in Q4, while its AI Studio product, which embeds artificial intelligence directly into workflow automation nodes, crossed $6M in annualized recurring revenue in under a year of general availability, with the stock sitting at $6.18 against a Street median price target of $15.50.
Reported March 2, Q4 revenue of $205.6M grew 9% year-over-year and beat the 13-analyst consensus of $205.13M, while non-GAAP EPS of $0.08 topped the $0.07 estimate, and the board simultaneously authorized an additional $160M in share repurchases, bringing total buyback capacity to approximately $200M.
AI Studio’s sequential ARR growth exceeded 50% in Q4, and 8 customers now spend over $100K annually on AI Studio alone beyond their core seat subscriptions, a monetization proof point that Asana’s peer collaborative work management platforms including Monday.com have not yet matched with a comparable standalone AI revenue disclosure.
Moreover, CEO Daniel Rogers stated on the Q4 FY2026 earnings call that “AI doesn’t reduce that coordination, it multiplies it,” tying the comment directly to Asana’s disclosure that two of the world’s five most valuable public companies expanded their Asana deployments in FY2026.
Asana’s FY2027 guidance of $850M to $858M in revenue and at least 9.5% non-GAAP operating margin, underpinned by AI products targeting 15% of net new ARR, AI Teammates reaching general availability for sales-led customers by end of Q1 FY2027, and $200M in active buyback capacity, positions the company to compound both revenue acceleration and margin expansion simultaneously over the next several years.
Wall Street’s Take on ASAN Stock
The profitability inflection already delivered in Q4 connects directly to the forward earnings trajectory: non-GAAP operating margin expanded 1,300 basis points in FY2026, and the TIKR model projects normalized EPS growing 35.5% to $0.37 in FY2027 and 25.3% to $0.46 in FY2028, driven by operating leverage on an 8% revenue base.
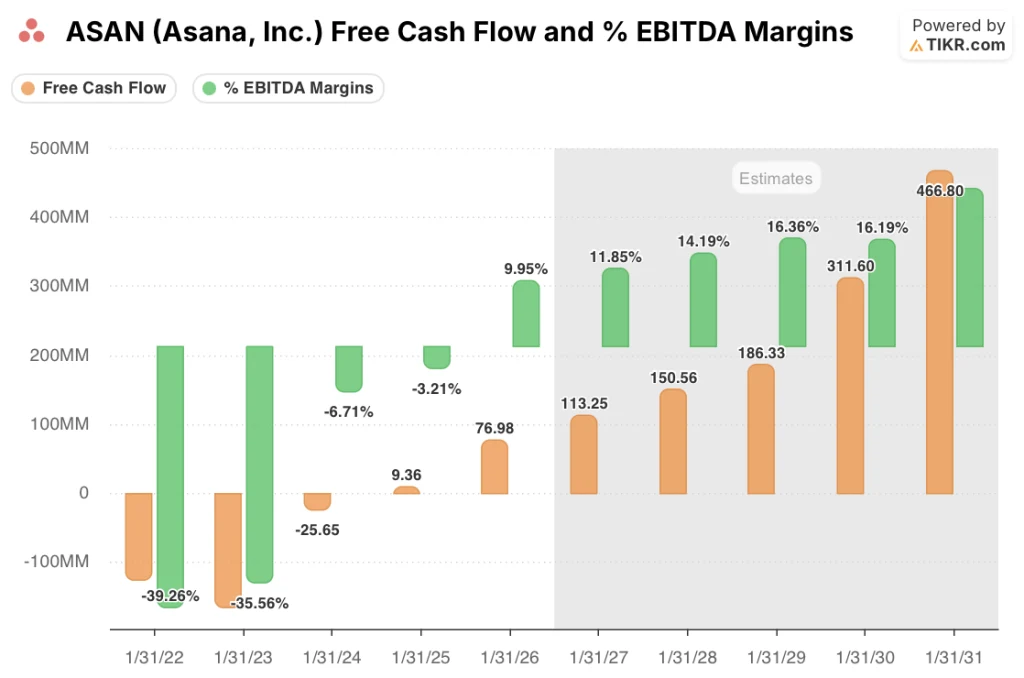
Asana’s EBITDA margin swung from -3.2% in FY2025 to 10.0% in FY2026, driven by R&D expenses falling 6 percentage points to 23% of revenue and G&A dropping 4 percentage points to 13%, and the TIKR model forecasts further expansion to 11.8% in FY2027 and 14.2% in FY2028 as the company shifts headcount to lower-cost regions and deploys AI internally across finance, security, and IT operations.
Free cash flow margin also reached 9.7% in FY2026 and is projected to widen to 13.3% in FY2027, giving Asana real capital to fund the $200M buyback authorization and its $10M incremental AI R&D commitment simultaneously.
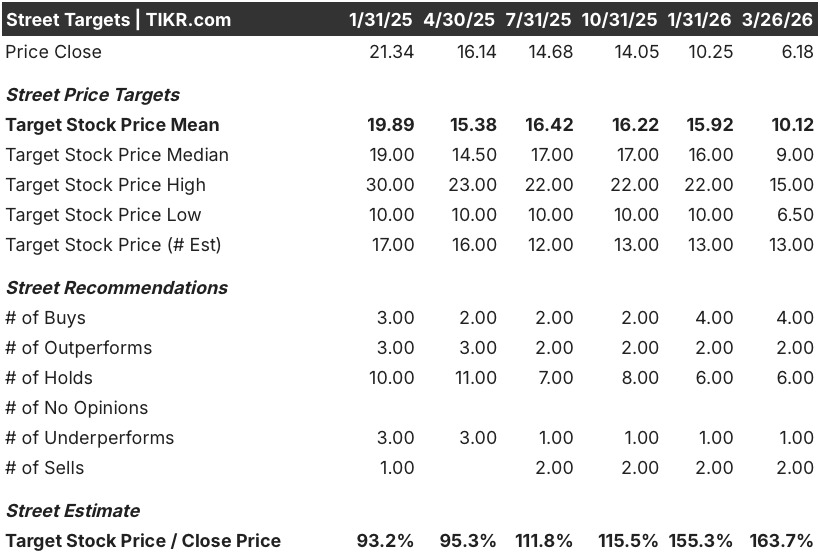
Regardless, the Street remains structurally skeptical: 4 buys, 2 outperforms, 6 holds, 1 underperform, and 2 sells from 13 analysts, with a mean price target of $10.12 implying 63.7% upside from $6.18, yet the consensus is anchored to a business that no longer looks like the one these ratings were written for.
The target range spans $6.50 on the low end to $15.00 on the high end, where the low reflects continued PLG deterioration and NRR stagnation, while the high requires AI Studio and AI Teammates to convert their early enterprise traction into durable ARR acceleration beyond the guided 15% of net new ARR.
What Does the Valuation Model Say?
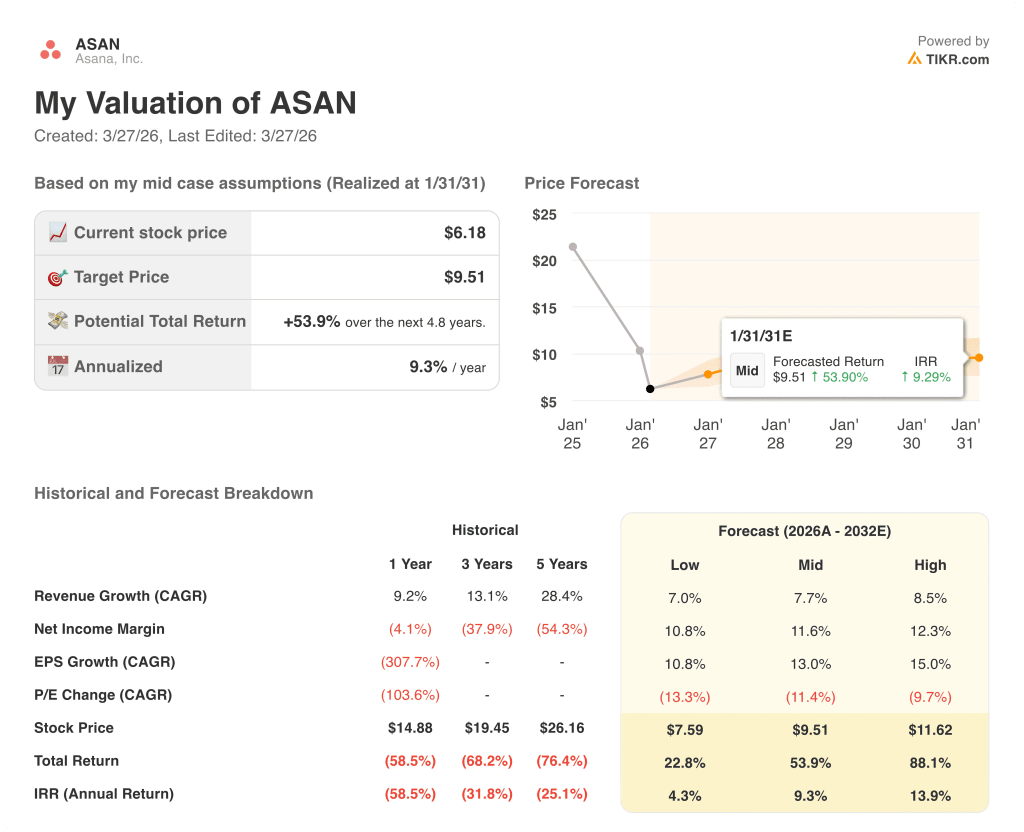
The TIKR mid-case targets $9.51, implying a 53.9% total return over 4.8 years at a 9.3% annualized IRR, anchored to a 7.7% revenue CAGR and net income margin expanding from 8.2% in FY2026 to 11.6% at the forecast horizon, assumptions grounded in the operating leverage Asana already demonstrated in FY2026.
The market is pricing ASAN at $6.18 as a stalled SaaS platform, ignoring that EBITDA flipped $100M positive in a single year.
AI Studio at $6M ARR with 8 customers already at $100K+ annually, well ahead of its first full year of general availability, directly justifies the model’s assumption that AI products reach 15% of net new ARR in FY2027.
Rogers confirmed on the Q4 call that top 10 enterprise renewals came in above 100% NRR for the third consecutive quarter of in-quarter improvement, signaling the retention floor is holding even before AI Teammates contributes at scale.
Additionally, PLG pressure, the self-serve top-of-funnel drag attributed to AI-driven search disruption, represents the model’s single breakage point: if it worsens beyond the guided 2-percentage-point ARR headwind, the 7.7% revenue CAGR assumption and $9.51 target both come down.
AI Teammates reaching general availability for sales-led customers by end of Q1 FY2027 is the near-term confirmation event; watch the Q1 FY2027 earnings report for AI product ARR as a percentage of net new ARR against the 15% full-year target.
Should You Invest in Asana, Inc.?
The only way to really know is to look at the numbers yourself. TIKR gives you free access to the same institutional-quality financial data that professional analysts use to answer exactly that question.
Pull up ASAN stock and you’ll see years of historical financials, what Wall Street analysts expect for revenue and earnings in the quarters ahead, how valuation multiples have moved over time, and whether price targets are trending up or down.
You can build a free watchlist to track Asana, Inc. alongside every other stock on your radar. No credit card required. Just the data you need to decide for yourself.
Access Professional Tools to Analyze ASAN stock on TIKR for Free →