
Key Stats for Zillow Stock
- Current Price: $29.35
- Target Price (Mid): ~$47
- Street Target: ~$47
- Potential Total Return: ~60%
- Annualized IRR: ~12% / year
Now Live: Discover how much upside your favorite stocks could have using TIKR’s new Valuation Model (It’s free) >>>
What Happened?
Zillow Group (ZG) closed at $29.35 on September 23, 2026, down 7.09% in a single session and back near the lowest levels it has traded at in more than a year, just above its 52-week low of $29.03. It capped a week of declines that began when a federal judge in Chicago denied Zillow’s bid to stop a listing service from cutting off its access to homes for sale in one of the country’s largest markets, with soft housing data and elevated mortgage rates adding to the pressure.
The share price tells one story and the income statement another. Revenue grew 18% last quarter. The stock has lost roughly 62% of its value over the past year. The gap between those facts is why ZG is worth a serious look at $29.
The Ruling That Cracked the Thesis
On September 15, U.S. District Judge John Tharp denied Zillow’s motion for a preliminary injunction against Midwest Real Estate Data (MRED) and Compass, and dissolved the order that had forced MRED to keep Zillow’s Chicago listings live. MRED can now legally shut off Zillow’s access to more than 30,000 Chicago-area listings, and the judge routed Zillow’s core claims into private arbitration. Keefe, Bruyette & Woods, in a note reported by TipRanks, called the outcome “incrementally negative.” Shares fell 3.6% the next day and kept sliding into the following week.
Tharp wrote that Zillow “has not made the strong showing necessary to establish antitrust injury,” but stressed it was a preliminary decision, not a verdict on the merits. Zillow framed it as one step in a longer process. The alleged collusion between MRED and Compass is still unproven and now heads to arbitration. So the market sold a procedural loss and the optics around private listings, not a finding that the business is broken.
This is one of several legal and competitive overhangs investors have priced this year, alongside the FTC’s rentals suit, shareholder lawsuits tied to the same antitrust allegations (also unproven), and Google’s national rollout of home-listing ads. Each chips at one worry: that Zillow’s grip on listings, which sends 80% of its traffic straight to its own apps, is more contestable than it looked two years ago.

See historical and forward estimates for Zillow stock (It’s free!) >>>
What the Selloff Is Ignoring
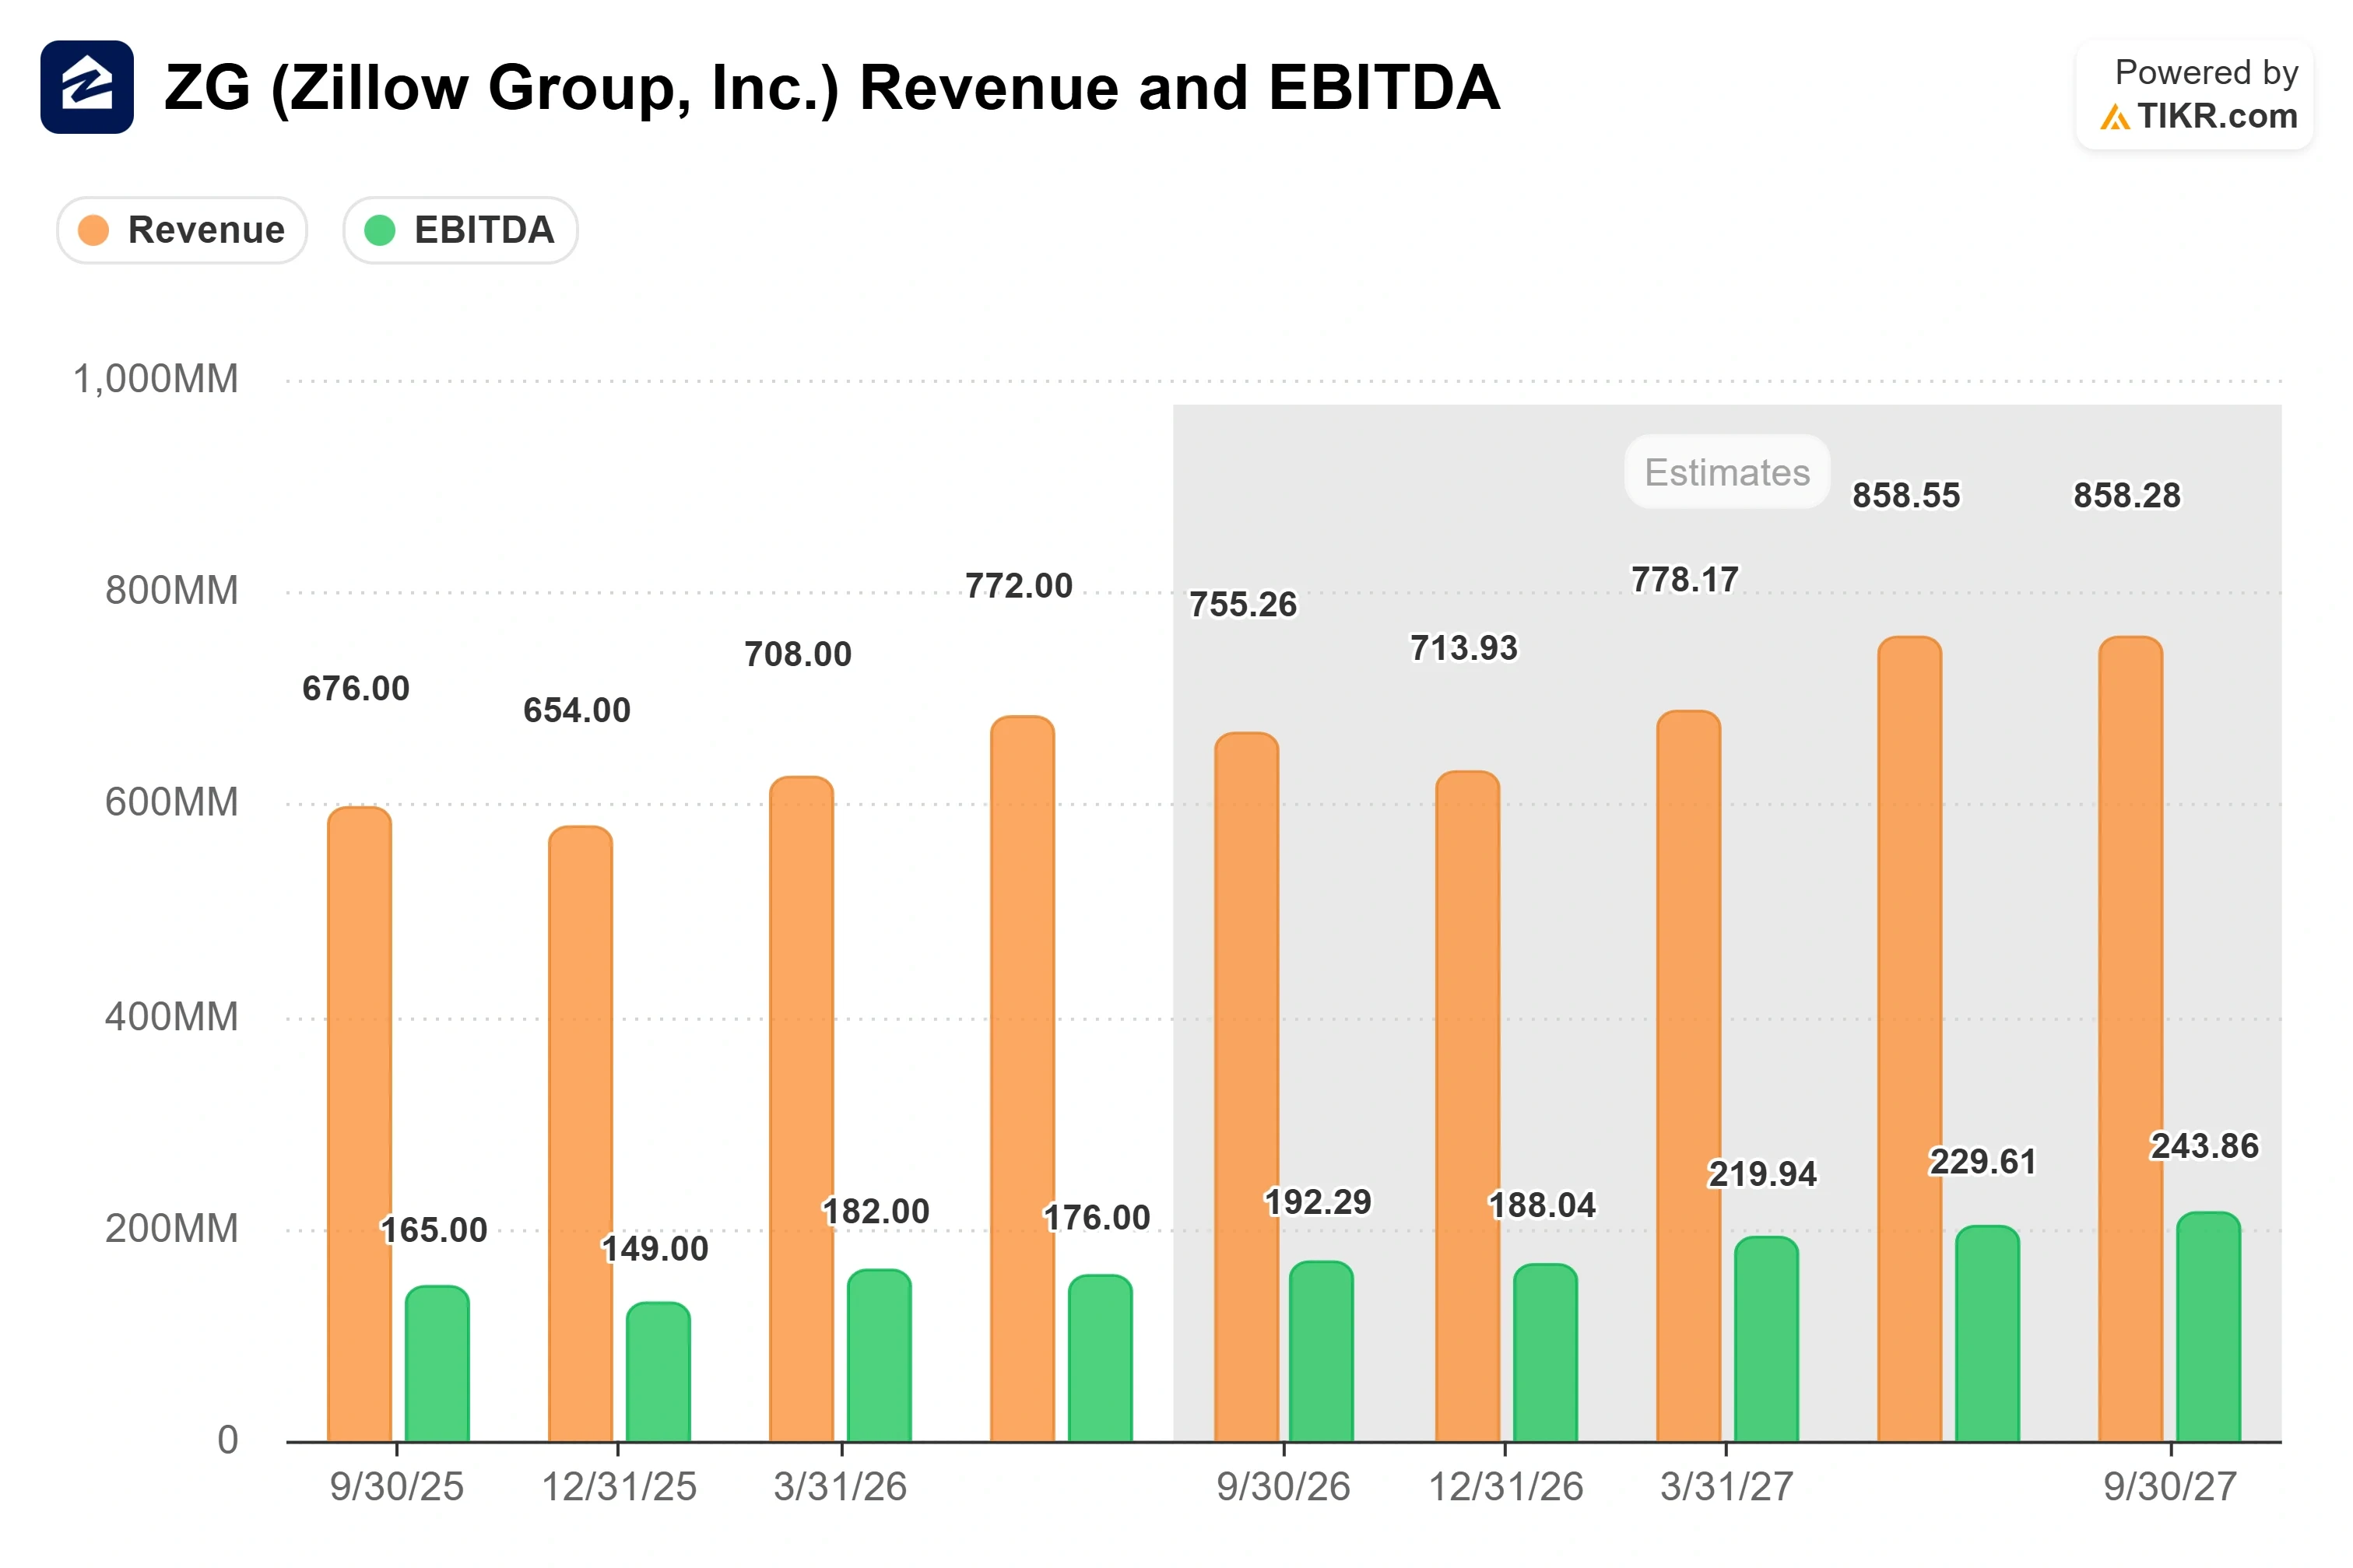
Zillow’s second-quarter results, reported August 5, were among its strongest ever: revenue of $772 million, up 18% year-over-year and ahead of the $758 million expected, with rentals up 31% and mortgage revenue up 75% as purchase originations nearly doubled. Adjusted EPS of $0.52 beat the $0.45 consensus, helped by the shift toward the Preferred agent model, which charges Zillow’s cut only when a transaction closes.
On the listings fight itself, Zillow’s own position undercuts the panic. At the Goldman Sachs conference on September 10, CFO and COO Jeremy Hofmann argued that private listings have never been more than a sliver of the market and never will be. “You’re going to sell the most important asset you own for most people, you want the most eyeballs on it,” he said, noting private listings have stayed stuck around 1% to 2% of inventory regardless of the noise.
The valuation swing shows how far sentiment has run. Zillow trades near 7.6x NTM EV/EBITDA. Compass, its courtroom adversary, sits near 10.1x, and Colliers sits near 10.1x as well. A profitable platform growing revenue in the high teens now carries a lower forward multiple than the brokerage that just beat it in court. That discount is the market pricing in permanent disruption, and whether it holds up is what the model has to answer.
See how Zillow performs against its peers in TIKR (It’s free!) >>>
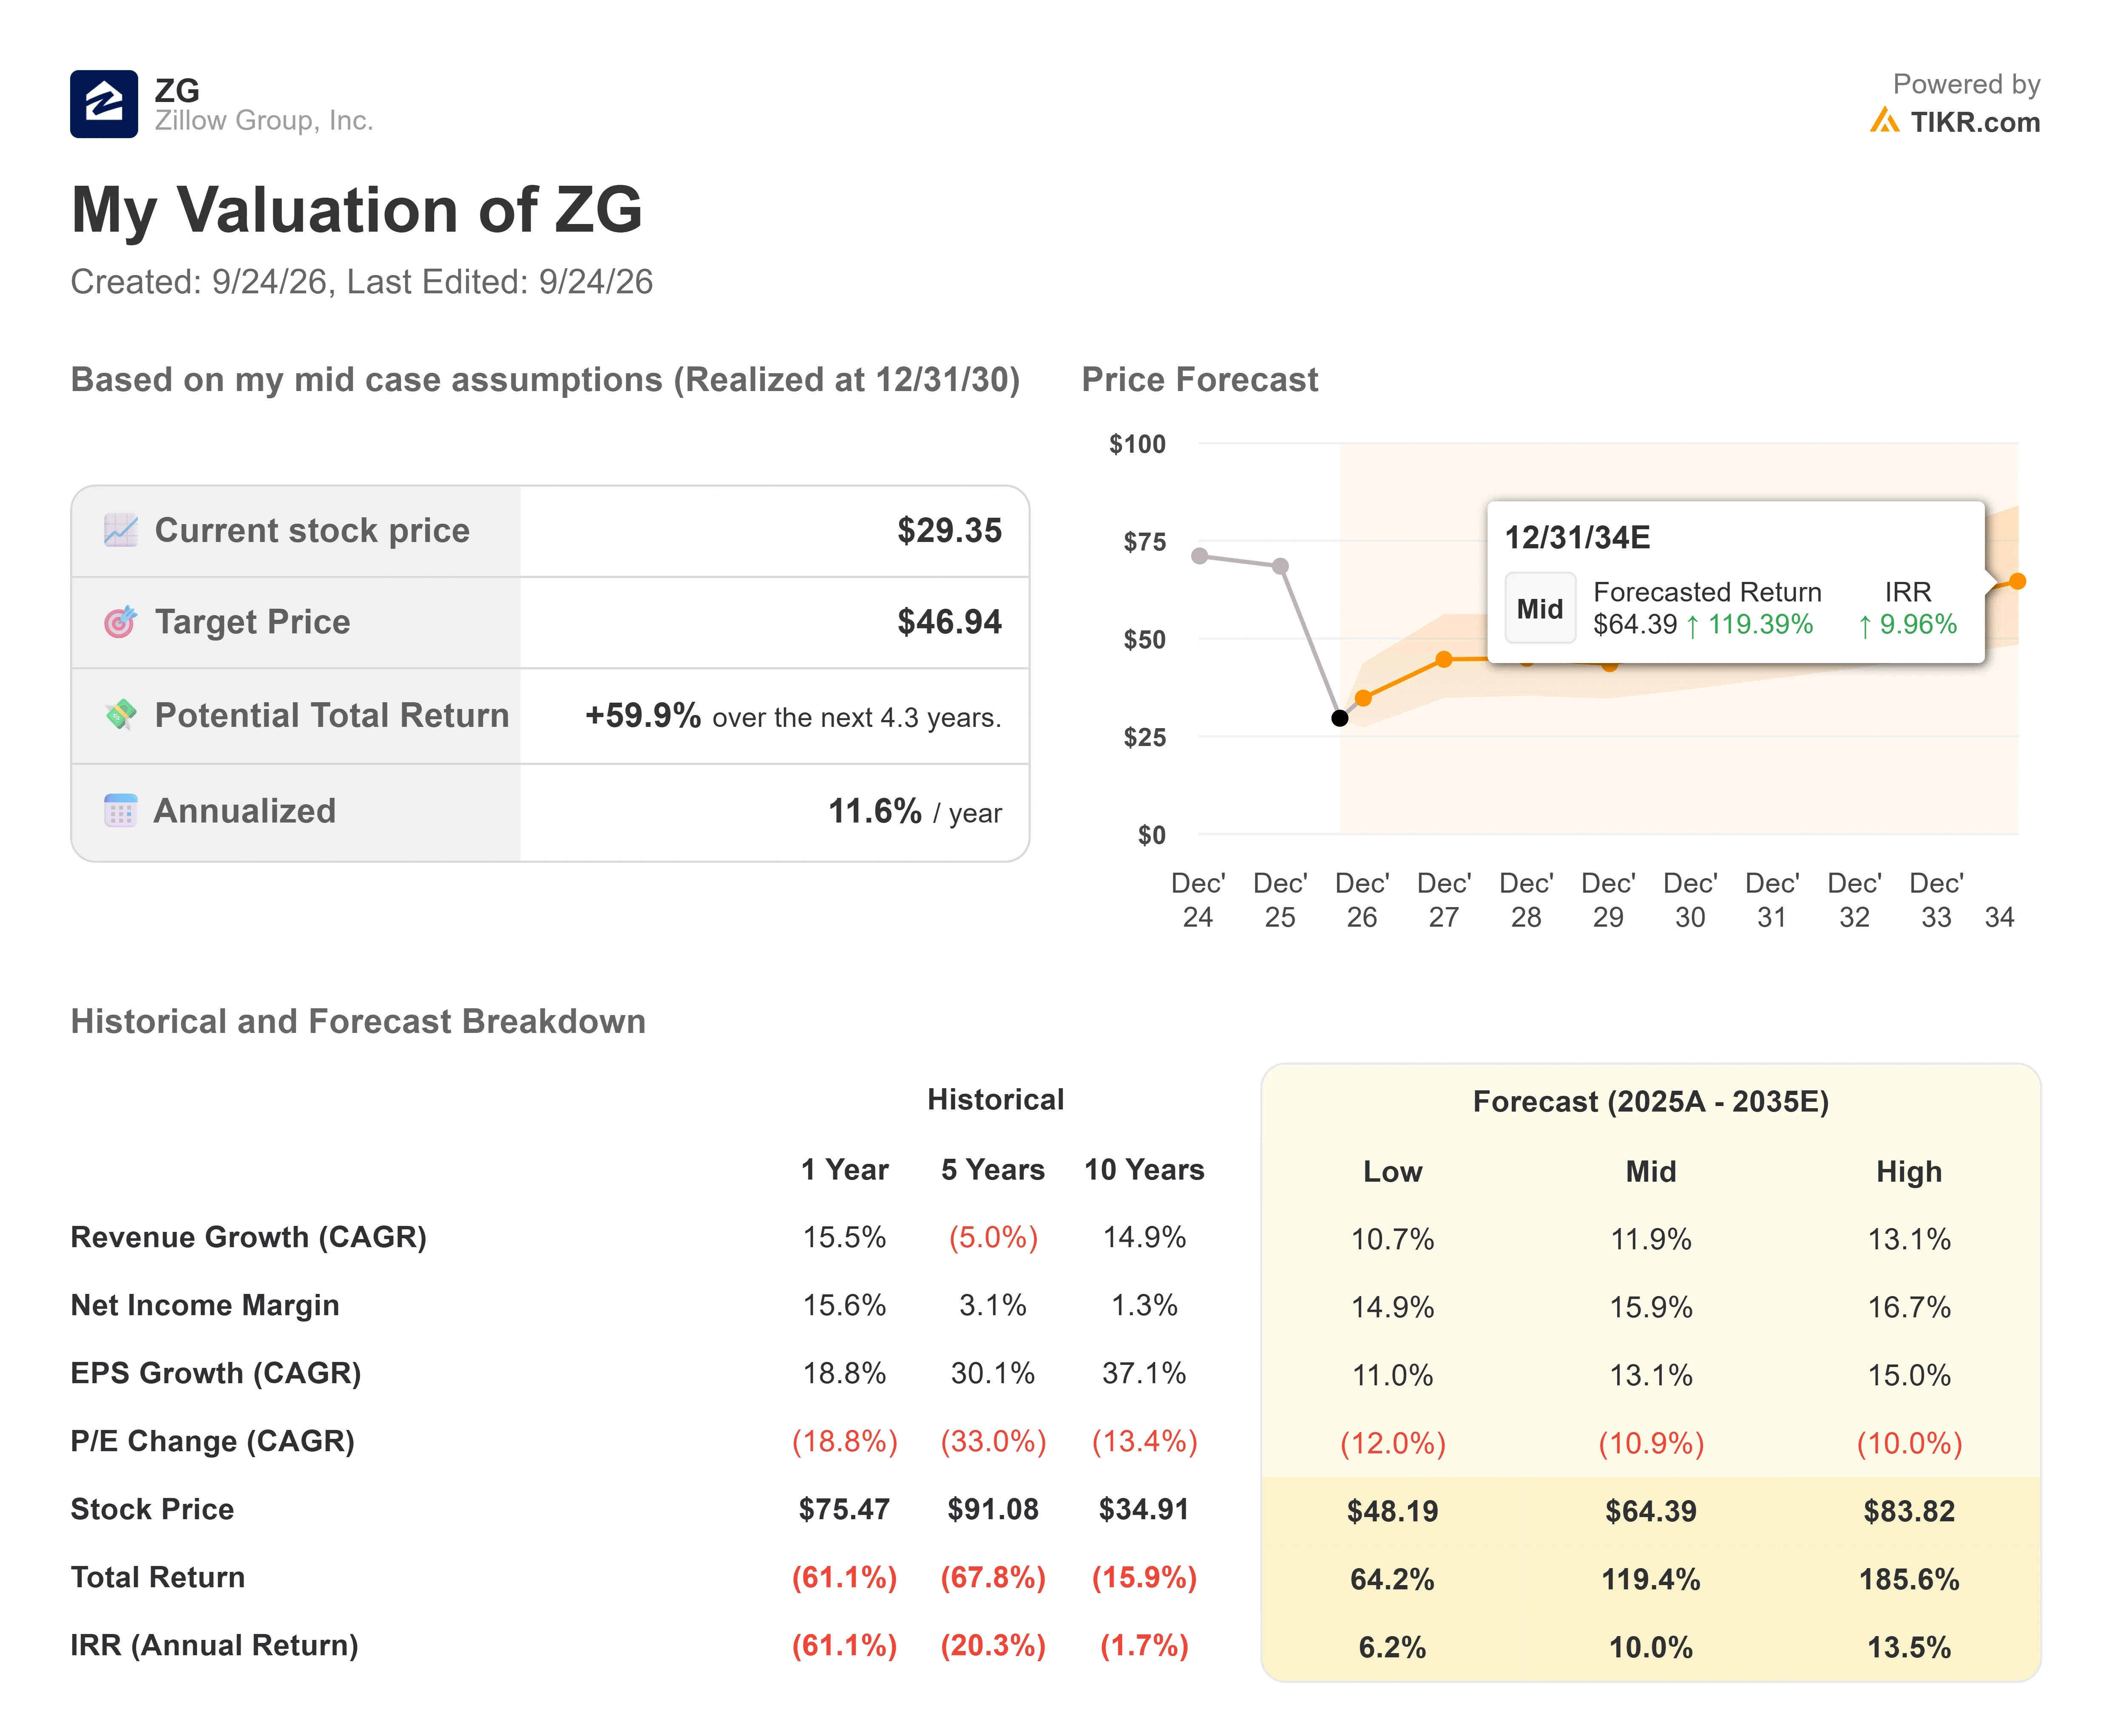
TIKR Advanced Model Analysis
- Current Price: $29.35
- Target Price (Mid): ~$47
- Potential Total Return: ~60%
- Annualized IRR: ~12% / year
See analysts’ growth forecasts and price targets for Zillow stock (It’s free!) >>>
TIKR’s mid-case model points to a target near $47, about 60% above today’s price, and an annualized return of around 12%. That target sits almost exactly on the Street’s mean of $47.23, so two independent methods land in the same spot.
Two drivers carry it: rentals compounding near 30% as Zillow captures multifamily inventory, and mortgage scaling off a small base toward management’s top-three-lender ambition. The margin driver is the higher revenue per transaction from the Preferred model as legal costs ease later in 2026. The primary risk is macro. Existing-home sales are stuck near 4 million units against a normalized 6 million, and Hofmann was candid that 2023 through 2026 will all print around that depressed level. The upside is a housing recovery layered on a business already growing without one. The downside is a frozen market plus spreading listings-access battles, keeping the multiple compressed longer than the model assumes.
Conclusion
The next real test is Zillow’s third-quarter report, expected in early November. Watch rentals growth and the mortgage origination trend: management guided full-year rentals near 30%, and holding that through a softening macro would prove the growth story runs independent of the housing cycle. A sharp deceleration, or signs that the MRED arbitration is spreading to other MLS markets, would validate the bears. At $29 and near its lows, the market is treating a growing, profitable platform as a broken one. November is where that assumption meets the numbers.
See what stocks billionaire investors are buying so you can follow the smart money with TIKR.
Should You Invest in Zillow?
The only way to really know is to look at the numbers yourself. TIKR gives you free access to the same institutional-quality financial data that professional analysts use to answer exactly that question.
Pull up Zillow, and you’ll see years of historical financials, what Wall Street analysts expect for revenue and earnings in the quarters ahead, how valuation multiples have moved over time, and whether price targets are trending up or down.
You can build a free watchlist to track Zillow alongside every other stock on your radar. No credit card required. Just the data you need to decide for yourself.
Looking for New Opportunities?
- See what stocks billionaire investors are buying so you can follow the smart money.
- Analyze stocks in as little as 5 minutes with TIKR’s all-in-one, easy-to-use platform.
- The more rocks you overturn… the more opportunities you’ll uncover. Search 100K+ global stocks, global top investor holdings, and more with TIKR.
Disclaimer:
Please note that the articles on TIKR are not intended to serve as investment or financial advice from TIKR or our content team, nor are they recommendations to buy or sell any stocks. We create our content based on TIKR Terminal’s investment data and analysts’ estimates. Our analysis might not include recent company news or important updates. TIKR has no position in any stocks mentioned. Thank you for reading, and happy investing!