
Key Takeaways:
- Record Testing Volume: GeneDx delivered over 30,000 exome and genome tests in Q2, up 32% year-over-year, and returned to profitability a quarter ahead of schedule.
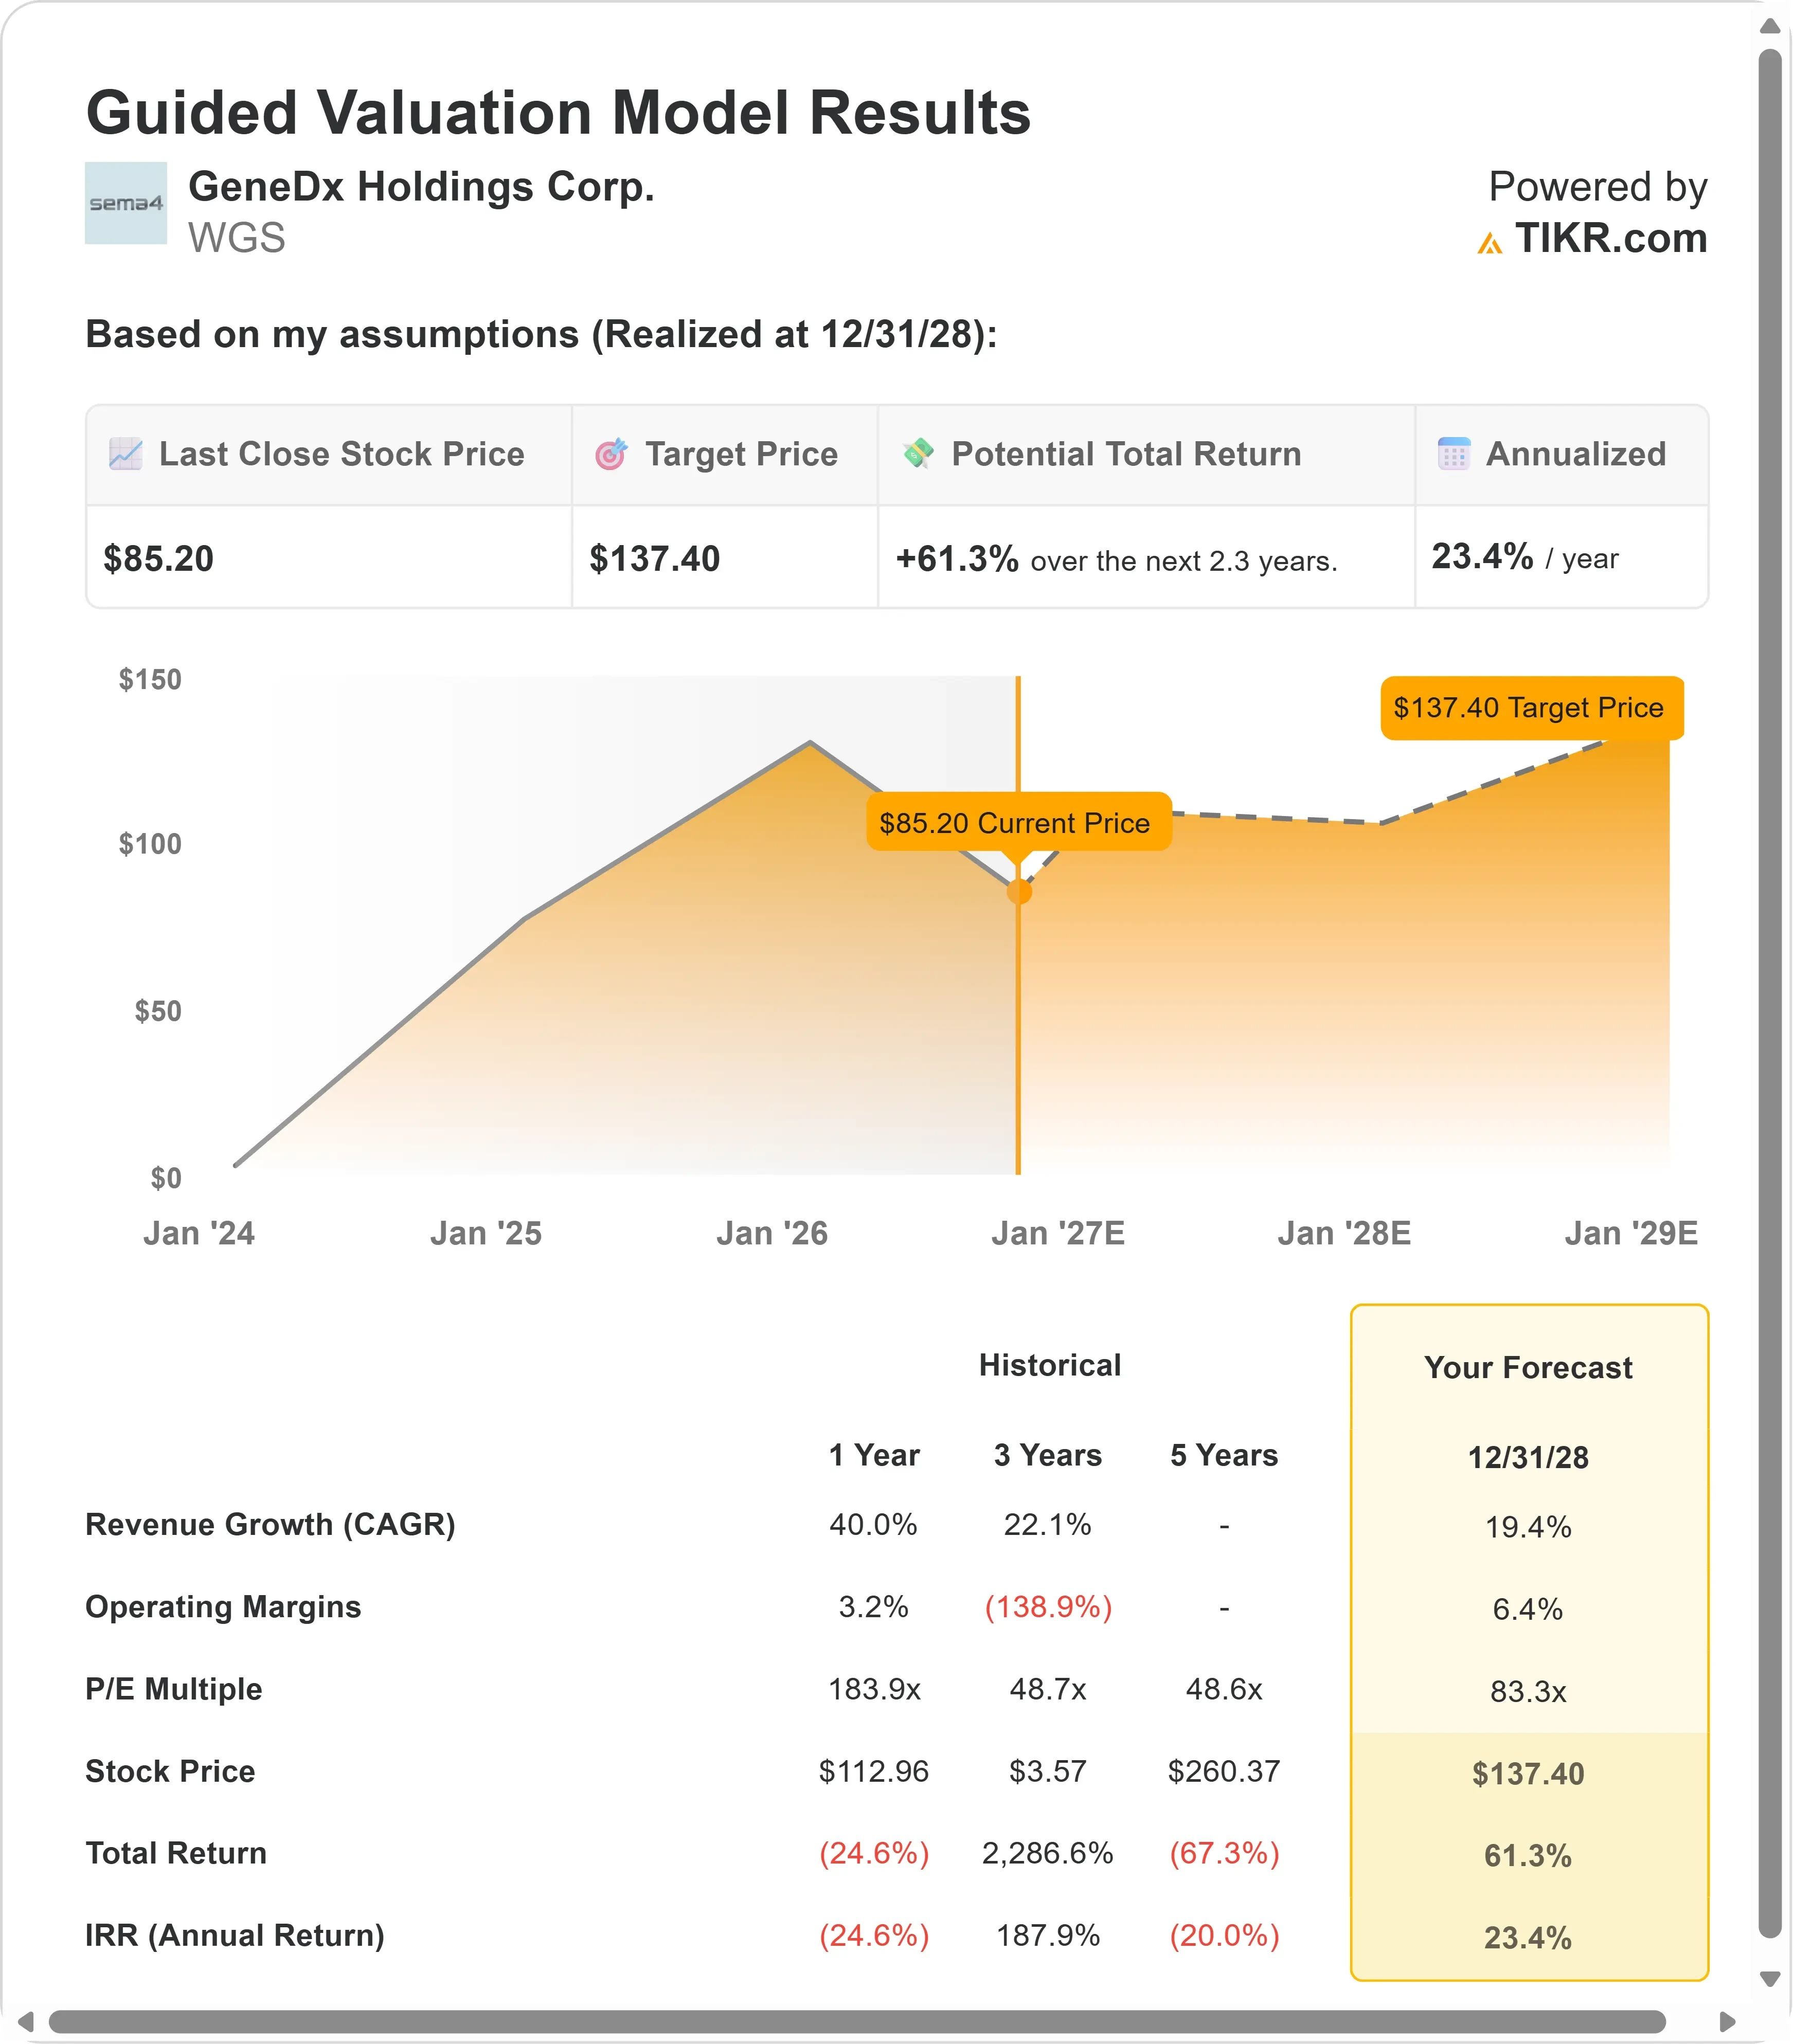
- Price Projection: Based on current assumptions, WGS stock could reach $137 by December 2028.
- Potential Gains: This target implies a total return of 61% from the current price of $85.
- Annual Return: Investors could see roughly 23% annual growth over the next 2.3 years.
Now Live: Discover how much upside your favorite stocks could have using TIKR’s new Valuation Model (It’s free)>>>
GeneDx (WGS) posted total revenue of $114.4 million in Q2, up 11% year-over-year and ahead of guidance.
Adjusted net income came in at $0.4 million, an $8.6 million improvement from the prior quarter and a milestone the company had originally expected a quarter later.
CEO Katherine Stueland framed the quarter around a simple idea: the company is underearning relative to its potential, and fixing that is now the top priority.
- Exome and genome revenue grew 17% year-over-year to $100.3 million, while volume grew 32% to 30,785 tests.
- Total gross margin improved to 70%, up from 69% in Q1.
- The company reaffirmed full-year revenue guidance of $475 million to $490 million.
Despite the return to profitability, GeneDx stock trades well below its recent highs, leaving a gap between where shares sit today and where the model sees fair value.
See analysts’ full growth forecasts and estimates for WGS stock (It’s free) >>>
What the Model Says for GeneDx Stock
GeneDx’s core opportunity is straightforward: the company gets paid far less than it should for the tests it runs, and closing that gap is now the company’s single biggest lever for growth.
The blended average reimbursement rate was $3,258 per test in Q2, roughly flat from the prior quarter.
Management pointed to a major coverage win as the reason this should improve going forward.
Commercial coverage for genome testing jumped from 47% to 87% in a single quarter, driven largely by a new policy from insurer Carelon that now covers roughly 56 million lives.
The catch is that coverage doesn’t translate into cash right away.
Management said the benefit from expanded coverage will start showing up modestly in Q4 2026, with the bulk of the improvement landing in 2027, since revenue is recognized based on a trailing collection period.
Newer commercial channels are also opening up.
GeneDx recently began targeting general pediatricians following updated clinical guidelines, and the company said this channel delivered its highest growth ever in the quarter, an early signal ahead of broader adoption.
Our Valuation Assumptions
Estimate a company’s fair value instantly (Free with TIKR) >>>
Our Valuation Assumptions
TIKR’s Valuation Model lets you plug in your own assumptions for a company’s revenue growth, operating margins, and P/E multiple, and calculates the stock’s expected returns.
Here’s what we used for GeneDx stock:
1. Revenue Growth: 19.4%
This is well below GeneDx’s 2025 annual growth of 40%, reflecting a more conservative view as the company works through the multi-quarter lag between improved coverage and actual cash collection.
Management itself guided to at least 20% growth in exome and genome revenue for the year, so this assumption sits close to that guidance.
2. Operating margins: 6.4%
GeneDx’s 2025 operating margin stands at -2.7%, a sharp turnaround from higher negative margins in prior years.
The model assumes a more moderate figure, reflecting the fact that the company’s genome collection rate is still only around 32%, well below the roughly 70% collection rate management considers standard for a mature diagnostic test.
3. Exit P/E Multiple: 83.3x
GeneDx currently trades at 125x forward earnings, an extremely high multiple that reflects the company’s still-small profit base.
The model assumes significant compression to 83.3x, an average between one-year earnings and the three-year average, as earnings grow faster than the stock price and the multiple normalizes toward more typical diagnostics-sector levels.
Based on these inputs, TIKR’s model projects WGS could reach $137 per share by the end of 2028, a 61% total return, or about 23% annualized.
Build your own Valuation Model to value any stock (It’s free!) >>>
What Happens If Things Go Better or Worse?
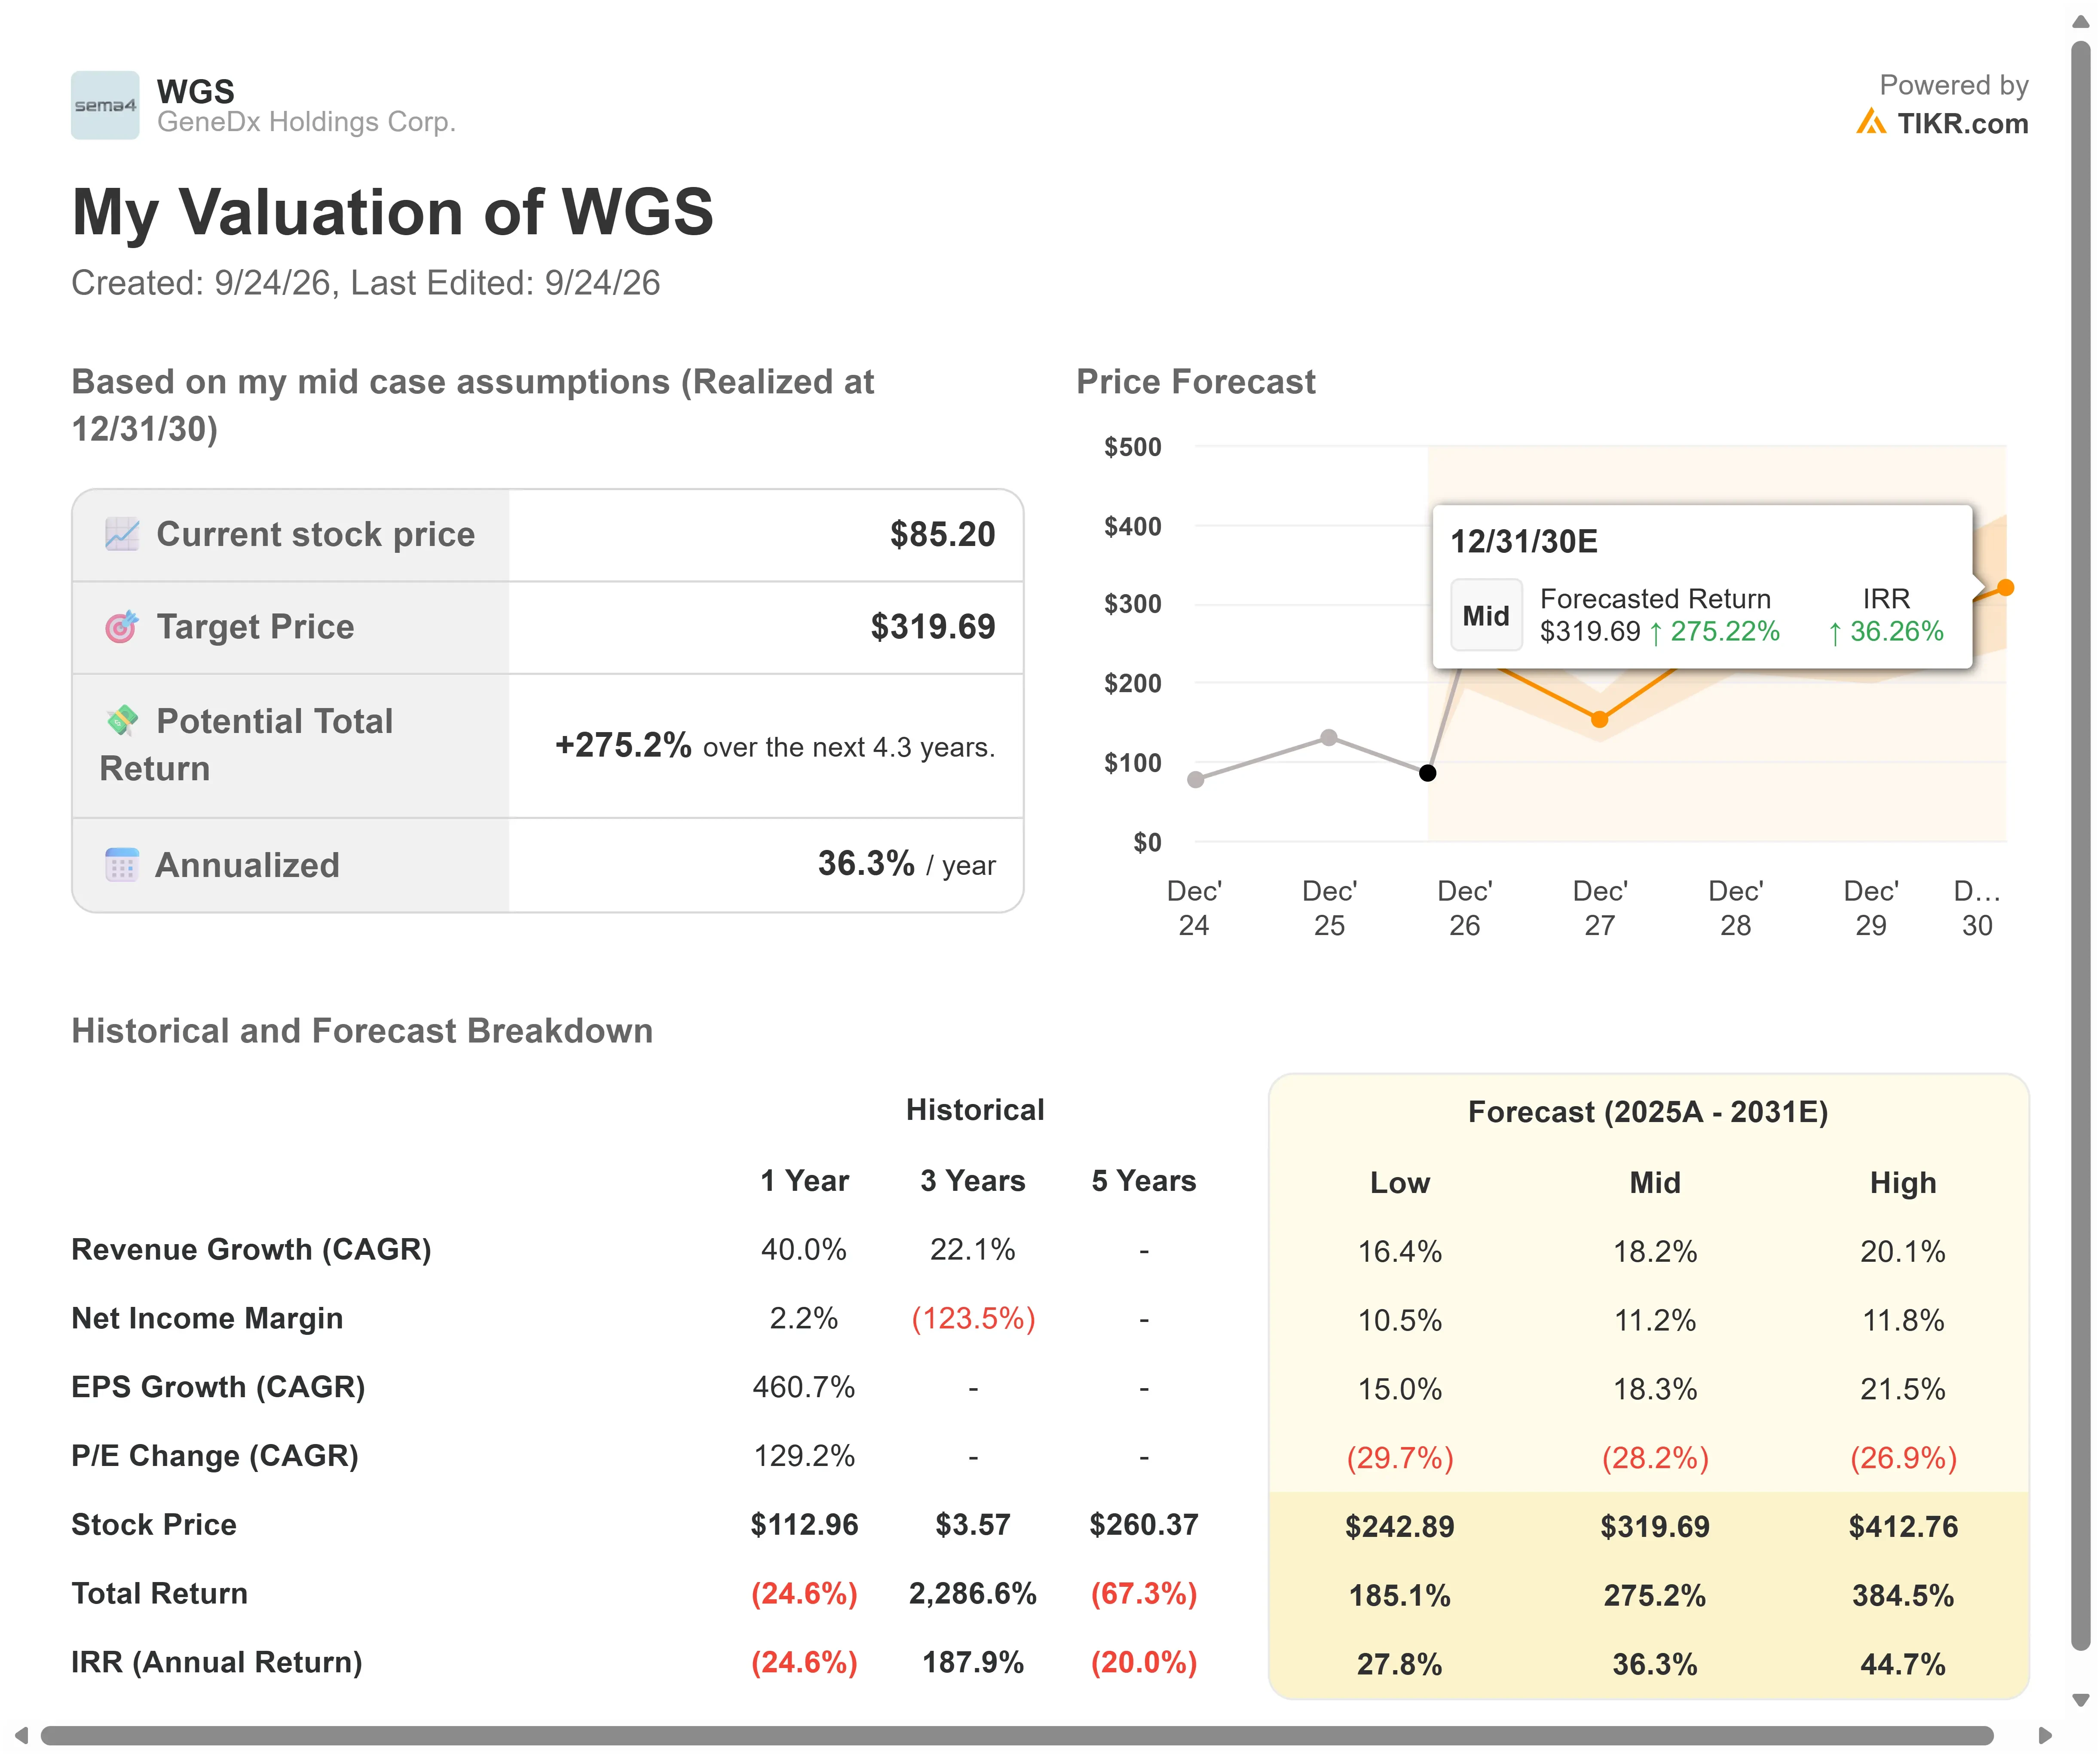
GeneDx operates in a business where reimbursement timing and payer behavior can shift results meaningfully, so outcomes can vary widely. Here’s how WGS stock might perform under different scenarios through December 2030:
- Low Case: If revenue growth comes in at 16.4% and net income margins reach 10.5%, investors could still see a 185.1% total return, or 27.8% annually.
- Mid Case: With 18.2% growth and 11.2% margins, the total return comes to 275.2%, or 36.3% annually.
- High Case: If growth accelerates to 20.1% with margins at 11.8%, returns could hit 384.5% total, or 44.7% annually.
See what analysts think about WGS stock right now (Free with TIKR) >>>
The spread mostly comes down to how quickly GeneDx can convert its recent coverage wins into actual collected revenue, and whether its push into new markets like general pediatrics scales the way management expects.
How Much Upside Does GeneDx Stock Have From Here?
With TIKR’s new Valuation Model tool, you can estimate a stock’s potential share price in under a minute.
All it takes is three simple inputs:
- Revenue Growth
- Operating Margins
- Exit P/E Multiple
If you’re not sure what to enter, TIKR automatically fills in each input using analysts’ consensus estimates, giving you a quick, reliable starting point.
From there, TIKR calculates the potential share price and total returns under Bull, Base, and Bear scenarios so you can quickly see whether a stock looks undervalued or overvalued.
See a stock’s true value in under 60 seconds (Free with TIKR) >>>
Looking for New Opportunities?
- See what stocks billionaire investors are buying so you can follow the smart money.
- Analyze stocks in as little as 5 minutes with TIKR’s all-in-one, easy-to-use platform.
- The more rocks you overturn… the more opportunities you’ll uncover. Search 100K+ global stocks, global top investor holdings, and more with TIKR.
Disclaimer:
Please note that the articles on TIKR are not intended to serve as investment or financial advice from TIKR or our content team, nor are they recommendations to buy or sell any stocks. We create our content based on TIKR Terminal’s investment data and analysts’ estimates. Our analysis might not include recent company news or important updates. TIKR has no position in any stocks mentioned. Thank you for reading, and happy investing!