Key Takeaways:
- Loyalty Launch Exceeds Expectations: Club Wingstop enrollments are tracking 22% ahead of expectations, with loyalty sales already making up nearly half of first-party digital sales.
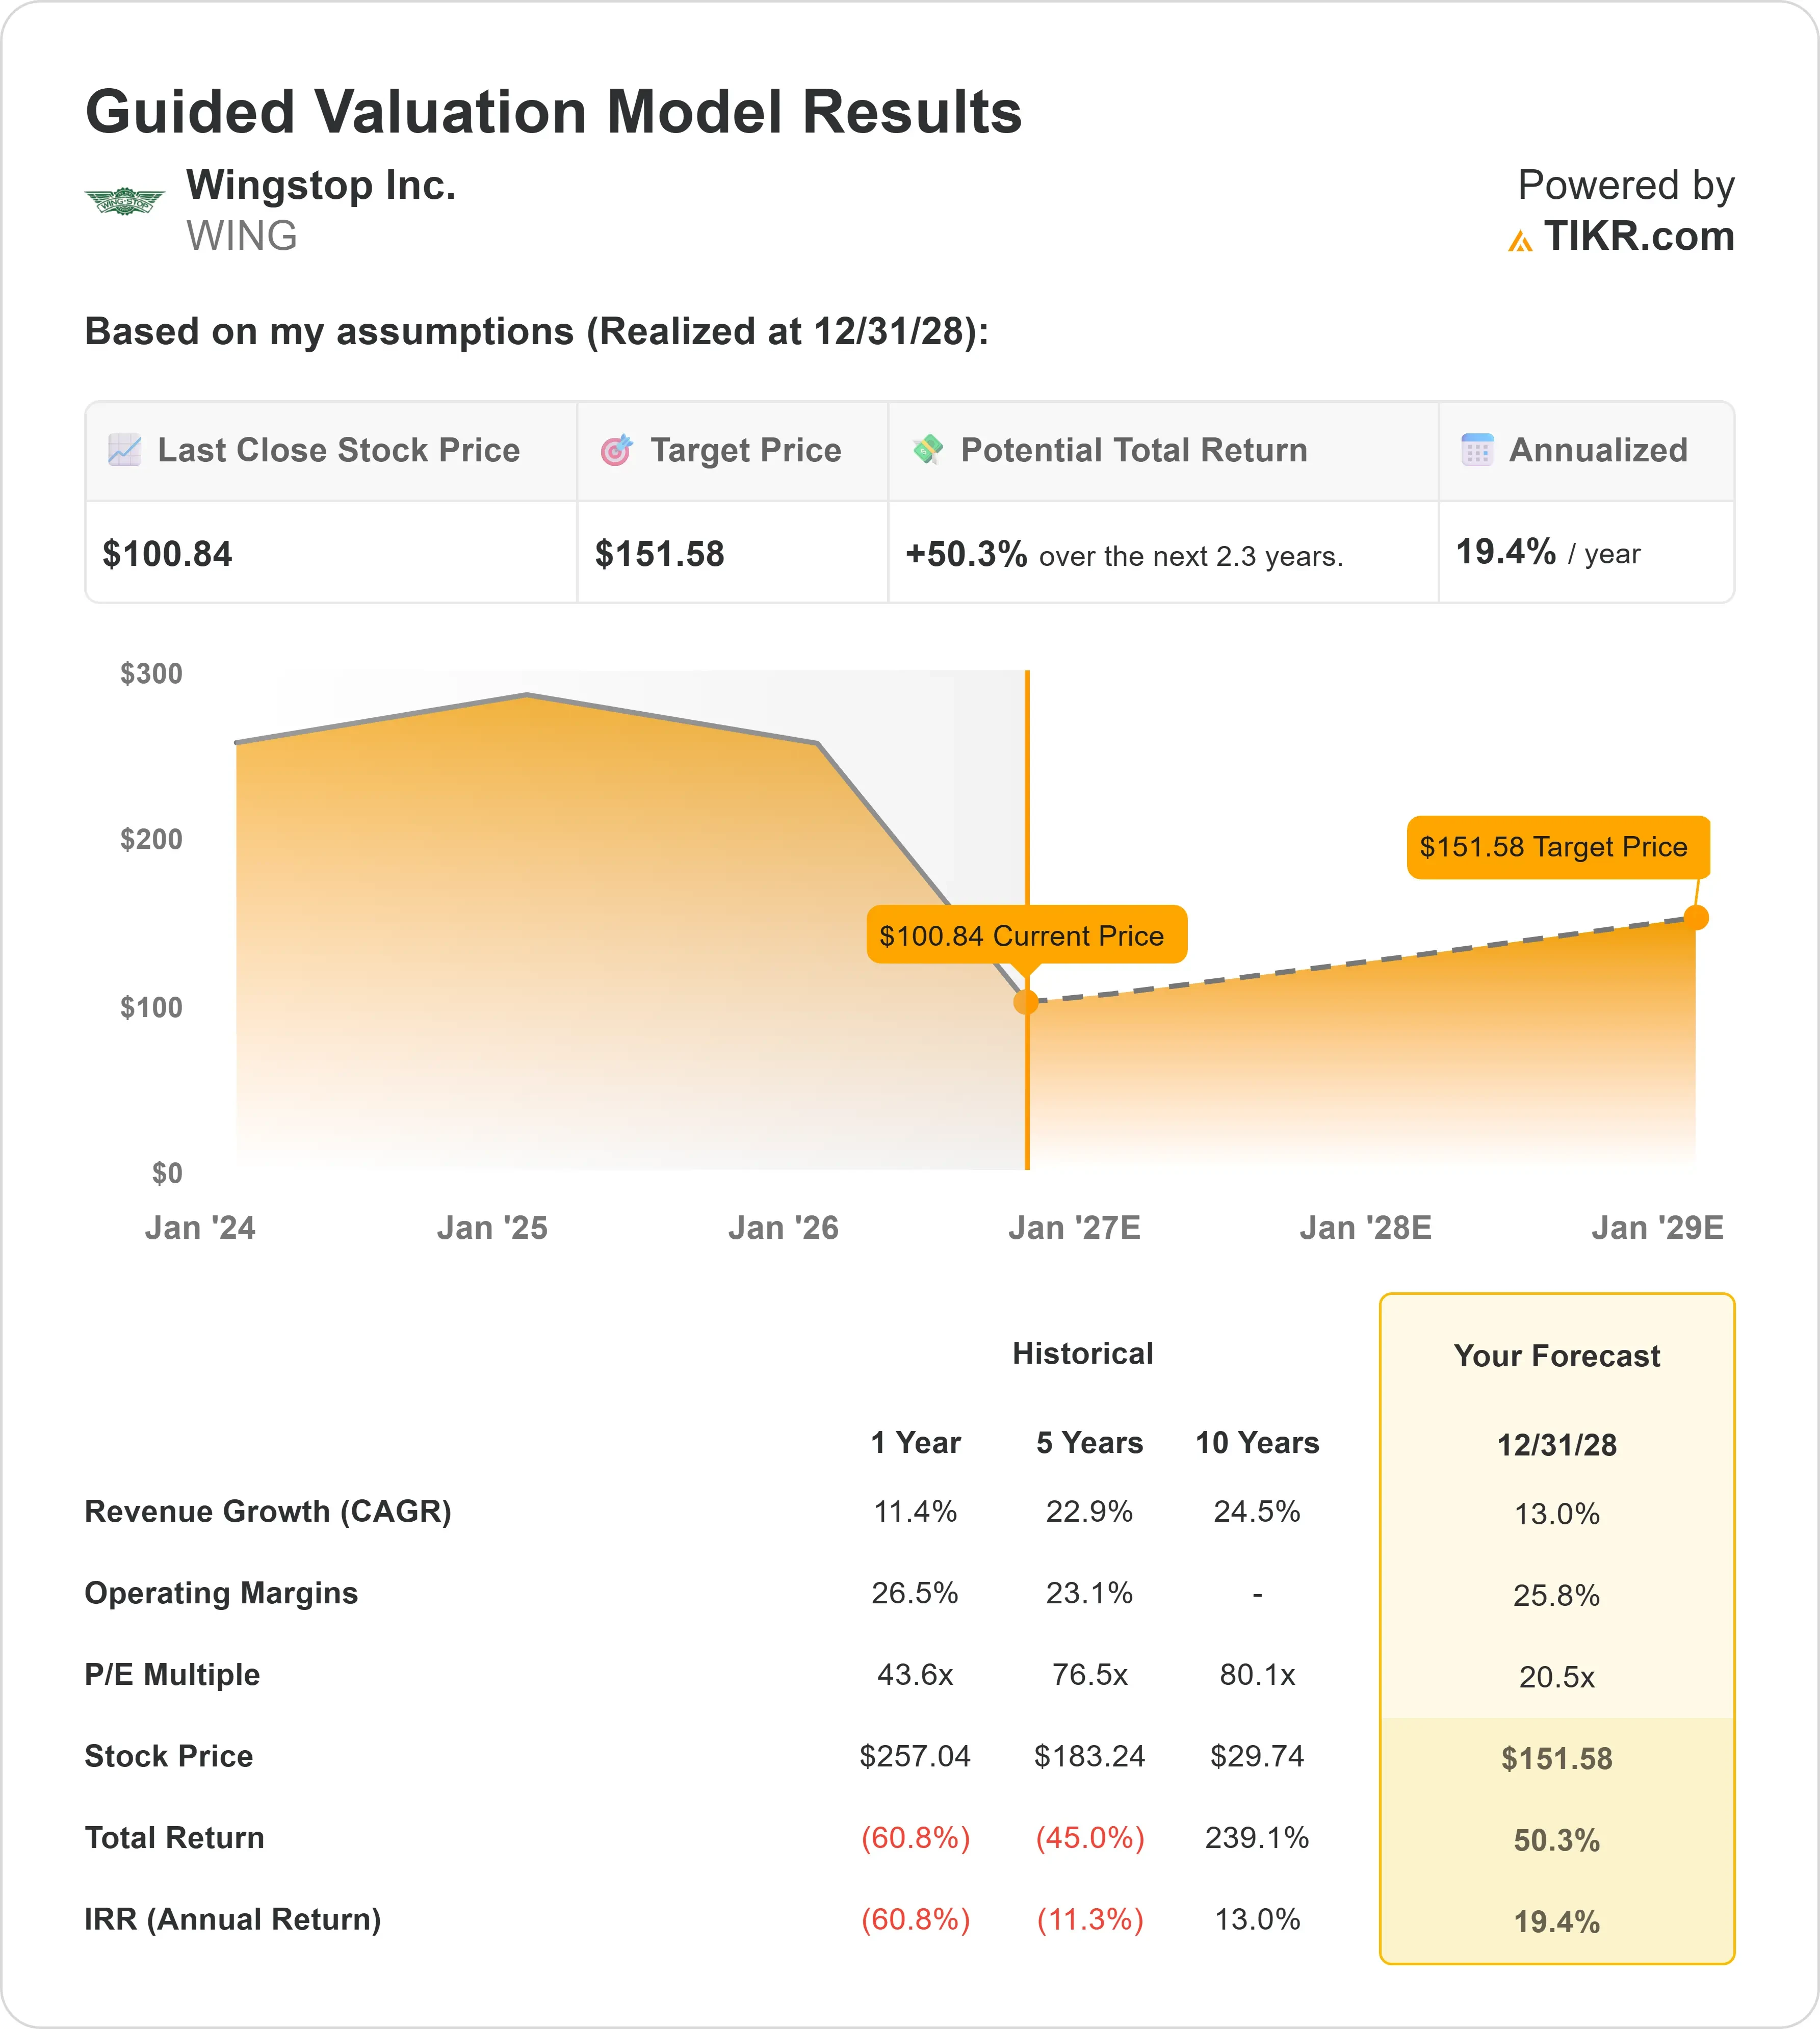
- Price Projection: Based on current execution, WING stock could reach $152 by December 2028.
- Potential Gains: This target implies a total return of 50% from the current price of $101.
- Annual Return: Investors could see roughly 19% annualized growth over the next 2.3 years.
Now Live: Discover how much upside your favorite stocks could have using TIKR’s new Valuation Model (It’s free)>>>
Wingstop (WING) had a rough Q2 of 2026. Domestic same-store sales fell 7.5%, worse than expected, as the company’s core lower-income customers pulled back under pressure from inflation and rising gas prices.
CEO Michael Skipworth said the problem isn’t the brand. During key World Cup matches and NBA Finals games, same-store sales swung into double-digit growth as the same financially stressed customers came together to celebrate.
That told management people still want Wingstop; they just need clearer proof of value right now.
- System-wide sales still grew 5.3% to about $1.4 billion, helped by new restaurant openings
- Adjusted EBITDA rose 12.5% to $66.6 million.
- The company cut its full-year same-store sales guidance to a decline of 4% to 6%, but held firm on 15% to 16% global unit growth.
Wingstop trades around $101 today, down sharply from its 2025 highs, as investors wait to see whether new value messaging and loyalty features can turn sales around.
See analysts’ full growth forecasts and estimates for WING stock (It’s free) >>>
What the Model Says for Wingstop Stock
Wingstop is a fast-growing, asset-light wing chain that franchises almost all of its roughly 300 new restaurants a year.
More than 55% of its domestic locations sit in lower-income urban areas, which explains why this customer pullback has hit harder here than at some competitors.
The company’s response centers on two things.
First, sharper value messaging shows customers they can still eat at Wingstop for about $8 per person, the same price point as several years ago.
Early tests like a “30 wings for $30” bundle worked well, pushing average tickets up nearly 17% as customers added extras rather than just taking the discount.
Second, Club Wingstop, the company’s first loyalty program, launched nationally this quarter.
Enrollment is running 22% ahead of plan, and members are returning fast; about 70% of newly enrolled loyalty members already came back for a second visit.
Management sees this as a long-term platform for personalized offers rather than blanket discounting.
Cannibalization from new store openings actually fell below historical levels in Q2, and the development pipeline sits at record levels, a sign franchisees still believe in the long-term unit economics even with same-store sales under pressure.
Using a forecast of 13.0% annual revenue growth and 25.8% operating margins, our model projects the stock could climb to $152 within 2.3 years. This assumes a 20.5x price-to-earnings multiple, a steep discount to Wingstop’s own one-year average of 43.6x.
Our Valuation Assumptions
Estimate a company’s fair value instantly (Free with TIKR) >>>
Our Valuation Assumptions
TIKR’s Valuation Model lets you plug in your own assumptions for a company’s revenue growth, operating margins, and P/E multiple, and calculates the stock’s expected returns.
Here’s what we used for Wingstop stock:
1. Revenue Growth: 13.0%
Wingstop grew revenue 11.4% over the past year, well below its five- and ten-year averages of roughly 23-25%.
With same-store sales declining and unit growth the main driver right now, we assume growth settles near 13% as new restaurant openings continue at a double-digit pace even as comps stay pressured.
2. Operating margins: 25.8%
Operating margin for 2025 sits at 27.6%, in line with the three- and five-year averages.
Lower bone-in wing costs helped margins in Q2, and management’s supply chain strategy gives visibility into food costs.
We’re assuming margins hold roughly steady as the company balances value investments against favorable wing pricing.
3. Exit P/E Multiple: 20.5x
Wingstop currently trades at 21.2x forward earnings, a massive drop from its one-year average of 43.6x and five-year average of 76.5x.
We’re holding the multiple roughly flat rather than assuming a re-rating, since the market wants to see same-store sales actually turn positive before paying a premium again for this stock.
Build your own Valuation Model to value any stock (It’s free!) >>>
What Happens If Things Go Better or Worse?
Restaurant chains exposed to lower-income consumers can see wide swings depending on how quickly spending pressure eases. Here’s how Wingstop stock might perform under different scenarios through December 2030:
- Low Case: If revenue growth slows to 9.4% and net income margins settle at 16.6%, investors could still see a 71.6% total return, or about 13.4% annually.
- Mid Case: With 10.4% growth and 17.4% margins, we expect a total return of 116.0%, or roughly 19.6% annually.
- High Case: If value messaging and Club Wingstop drive a faster turnaround, pushing revenue growth to 11.5% and margins to 17.8%, returns could reach 163.2% total, or about 25.3% annually.

See what analysts think about WING stock right now (Free with TIKR) >>>
The spread between these outcomes largely depends on how quickly core lower-income guests return as value messaging lands, and whether Club Wingstop’s early momentum translates into sustained frequency gains rather than a short-lived enrollment bump.
How Much Upside Does Wingstop Stock Have From Here?
With TIKR’s new Valuation Model tool, you can estimate a stock’s potential share price in under a minute.
All it takes is three simple inputs:
- Revenue Growth
- Operating Margins
- Exit P/E Multiple
If you’re not sure what to enter, TIKR automatically fills in each input using analysts’ consensus estimates, giving you a quick, reliable starting point.
From there, TIKR calculates the potential share price and total returns under Bull, Base, and Bear scenarios so you can quickly see whether a stock looks undervalued or overvalued.
See a stock’s true value in under 60 seconds (Free with TIKR) >>>
Looking for New Opportunities?
- See what stocks billionaire investors are buying so you can follow the smart money.
- Analyze stocks in as little as 5 minutes with TIKR’s all-in-one, easy-to-use platform.
- The more rocks you overturn… the more opportunities you’ll uncover. Search 100K+ global stocks, global top investor holdings, and more with TIKR.
Disclaimer:
Please note that the articles on TIKR are not intended to serve as investment or financial advice from TIKR or our content team, nor are they recommendations to buy or sell any stocks. We create our content based on TIKR Terminal’s investment data and analysts’ estimates. Our analysis might not include recent company news or important updates. TIKR has no position in any stocks mentioned. Thank you for reading, and happy investing!