Key Stats for APP Stock
- Past week’s performance: +9.6%
- 52-week range: $298 to $746
- Valuation model target price: $496
- Implied upside: 48.4% over 2.3 years
Estimate AppLovin’s fair value in under 60 seconds with TIKR’s Valuation Model (It’s free) >>>
Clawing Back From an Earnings Stumble
AppLovin (APP) stock jumped about 9.6% this week. That’s a welcome bounce after a rough stretch that began in early August. The company’s Q2 revenue rose 53% year over year to $1.92 billion, but that came in just below its own guidance midpoint. Shares fell roughly 17% the day results were released, and BofA followed with a downgrade to Neutral.

Despite the miss, the underlying numbers stayed strong. Net income climbed 55% to $1.27 billion, and adjusted EBITDA grew 58% year over year with margins expanding nearly 300 basis points. CEO Adam Foroughi didn’t sugarcoat the shortfall. He told investors “we know what happened, and it’s already been addressed,” explaining the company simply missed its usual quarterly AI model boost.
That explanation appears to be resonating now. Adjust, AppLovin’s mobile analytics unit, reported this week that global shopping app sessions rose 15% in H1 2026. That’s a sign the mobile advertising ecosystem AppLovin depends on remains healthy. Management guided Q3 revenue to $2.055 billion to $2.085 billion, representing 46% to 48% growth.
If AppLovin’s Q3 results confirm the shortfall was timing rather than weaker demand, this week’s rebound could mark the early stages of a broader recovery toward its 52-week high near $746.
Track how far AppLovin has climbed back from its August lows (It’s free) >>>
Expensive Growth, Even After the Pullback
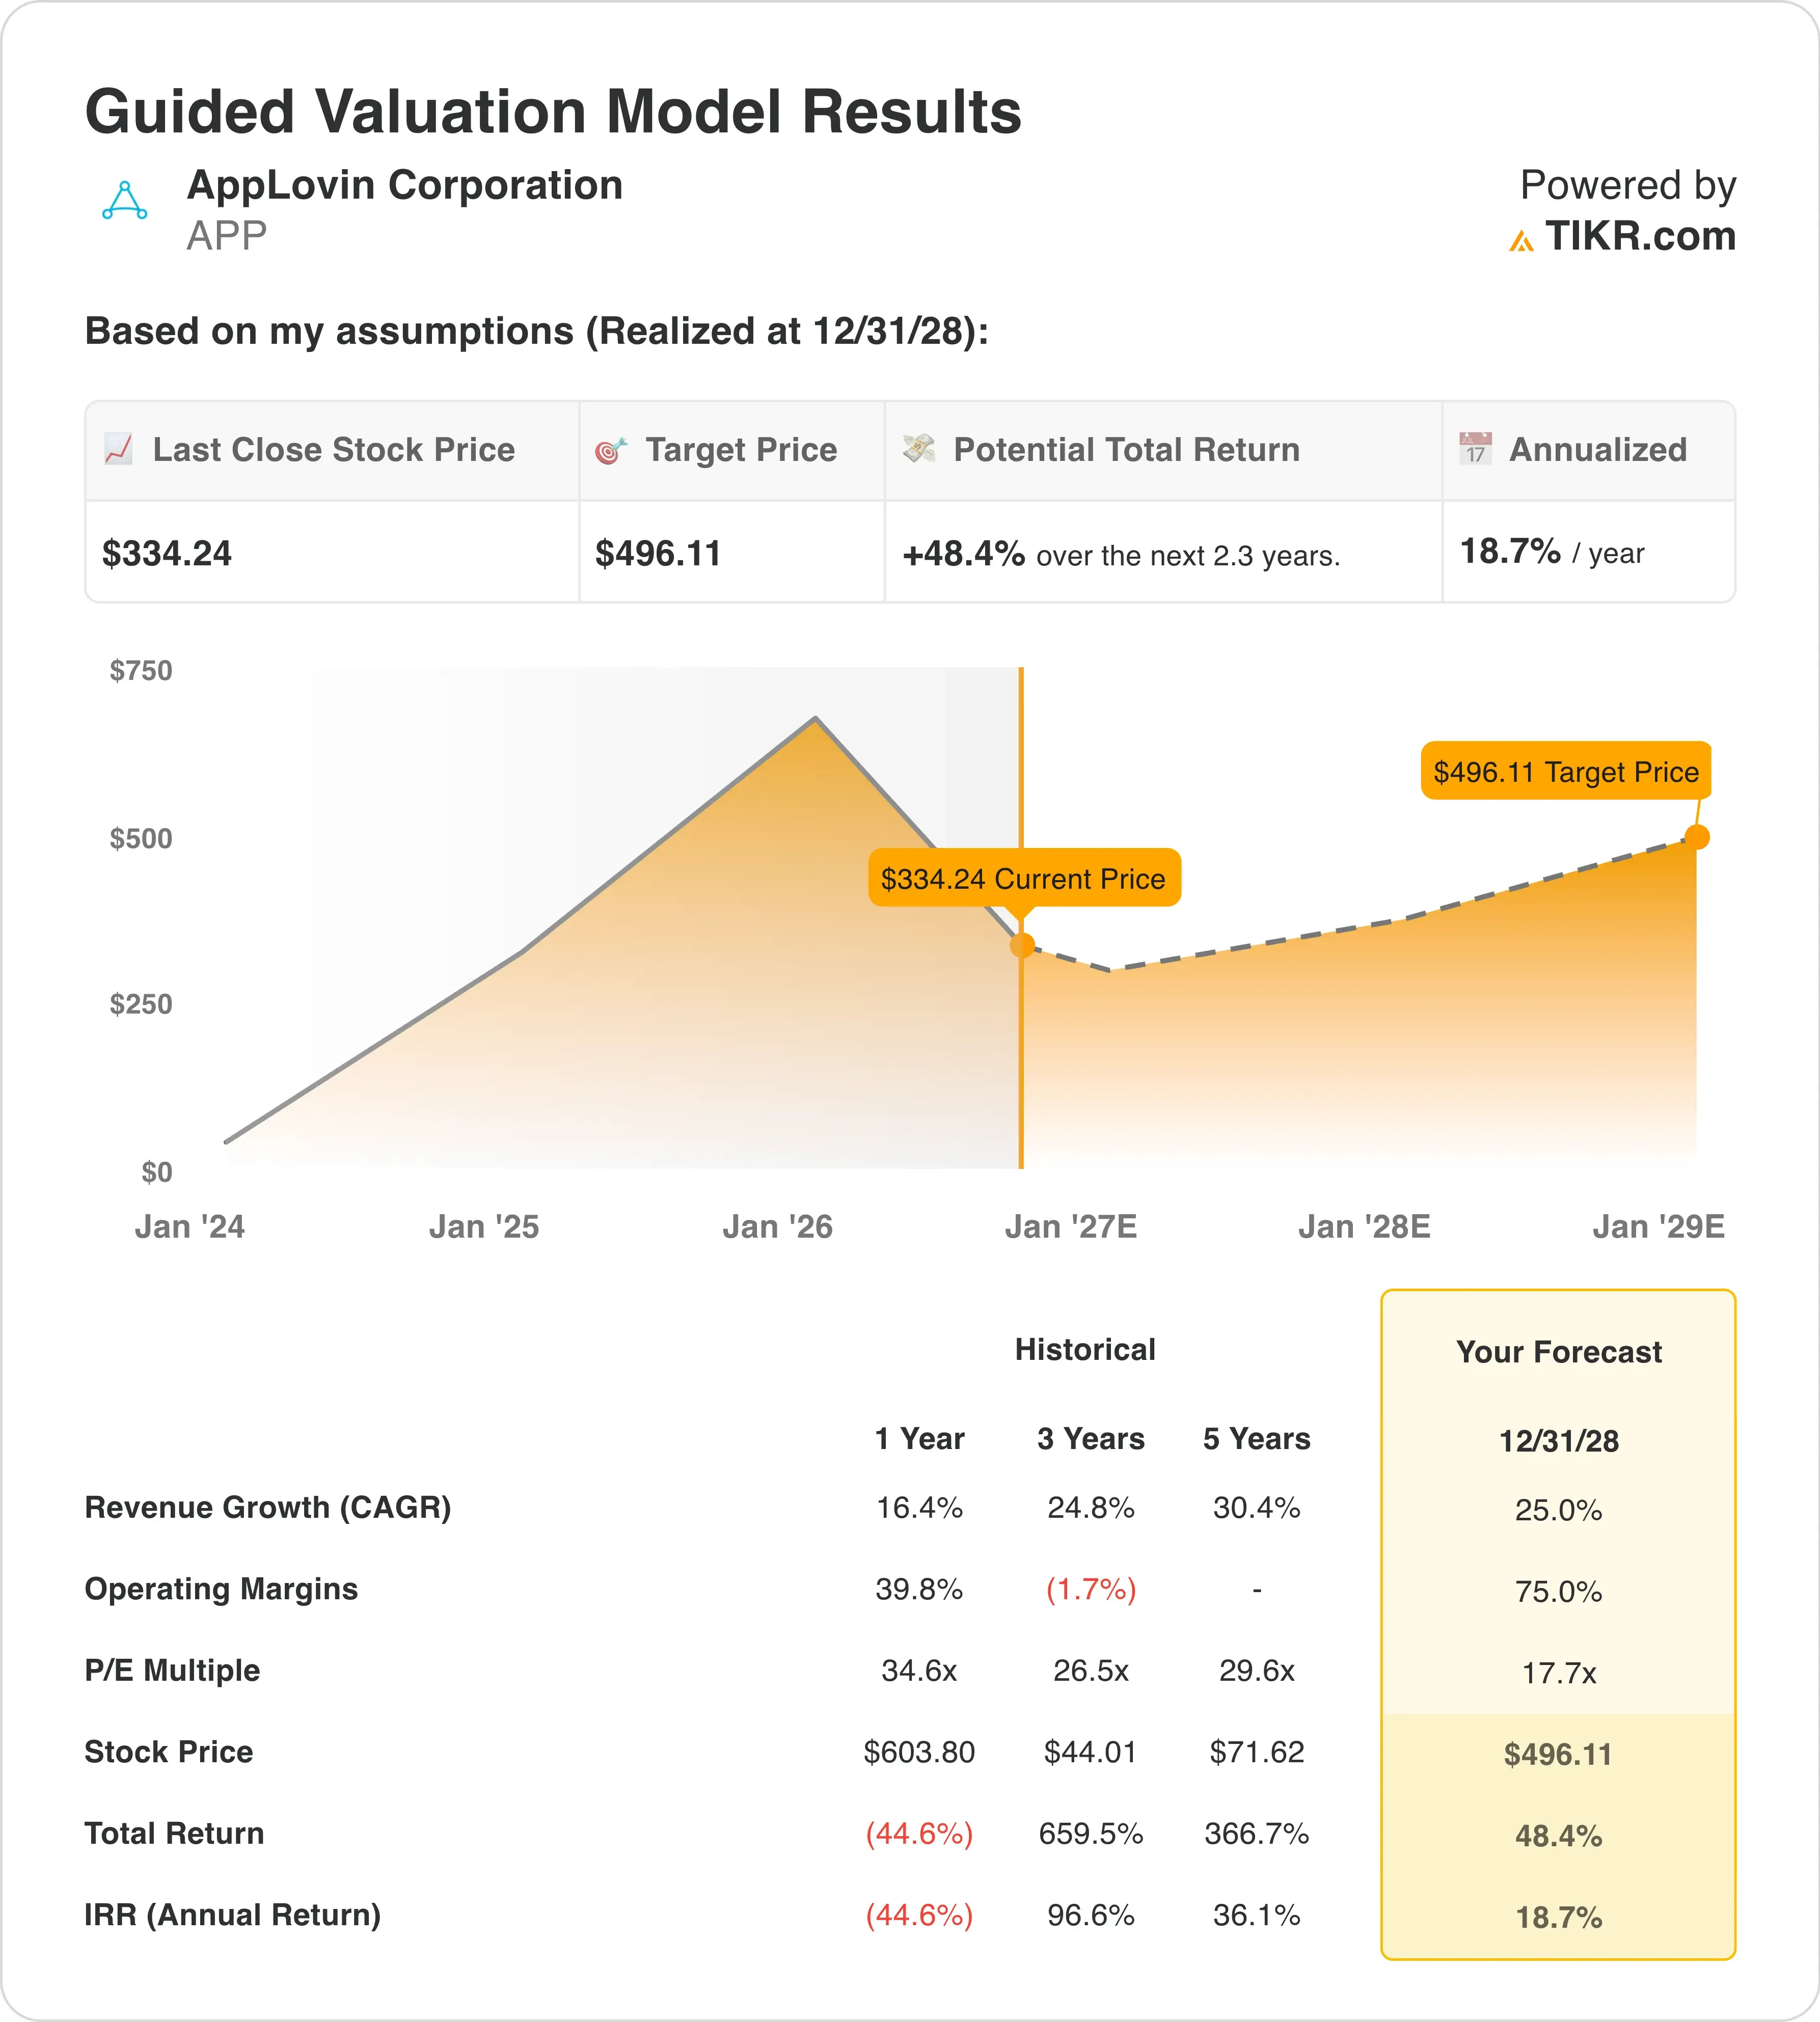
Under valuation model assumptions realized through 12/31/28, the stock is modeled using:
- Revenue Growth (CAGR): 25.0%
- Operating Margins: 75.0%
- Exit P/E Multiple: 17.7x
The model estimates a target price of $496, implying 48.4% upside and an 18.7% annualized return over the next 2.3 years.
Despite trading more than 55% below its 52-week high, AppLovin still isn’t cheap by traditional measures. Its underlying economics remain exceptional though. A 75% operating margin is unusually high for any company, let alone one growing revenue 25% annually, and it reflects the efficiency of AppLovin’s AI-driven ad auction platform.
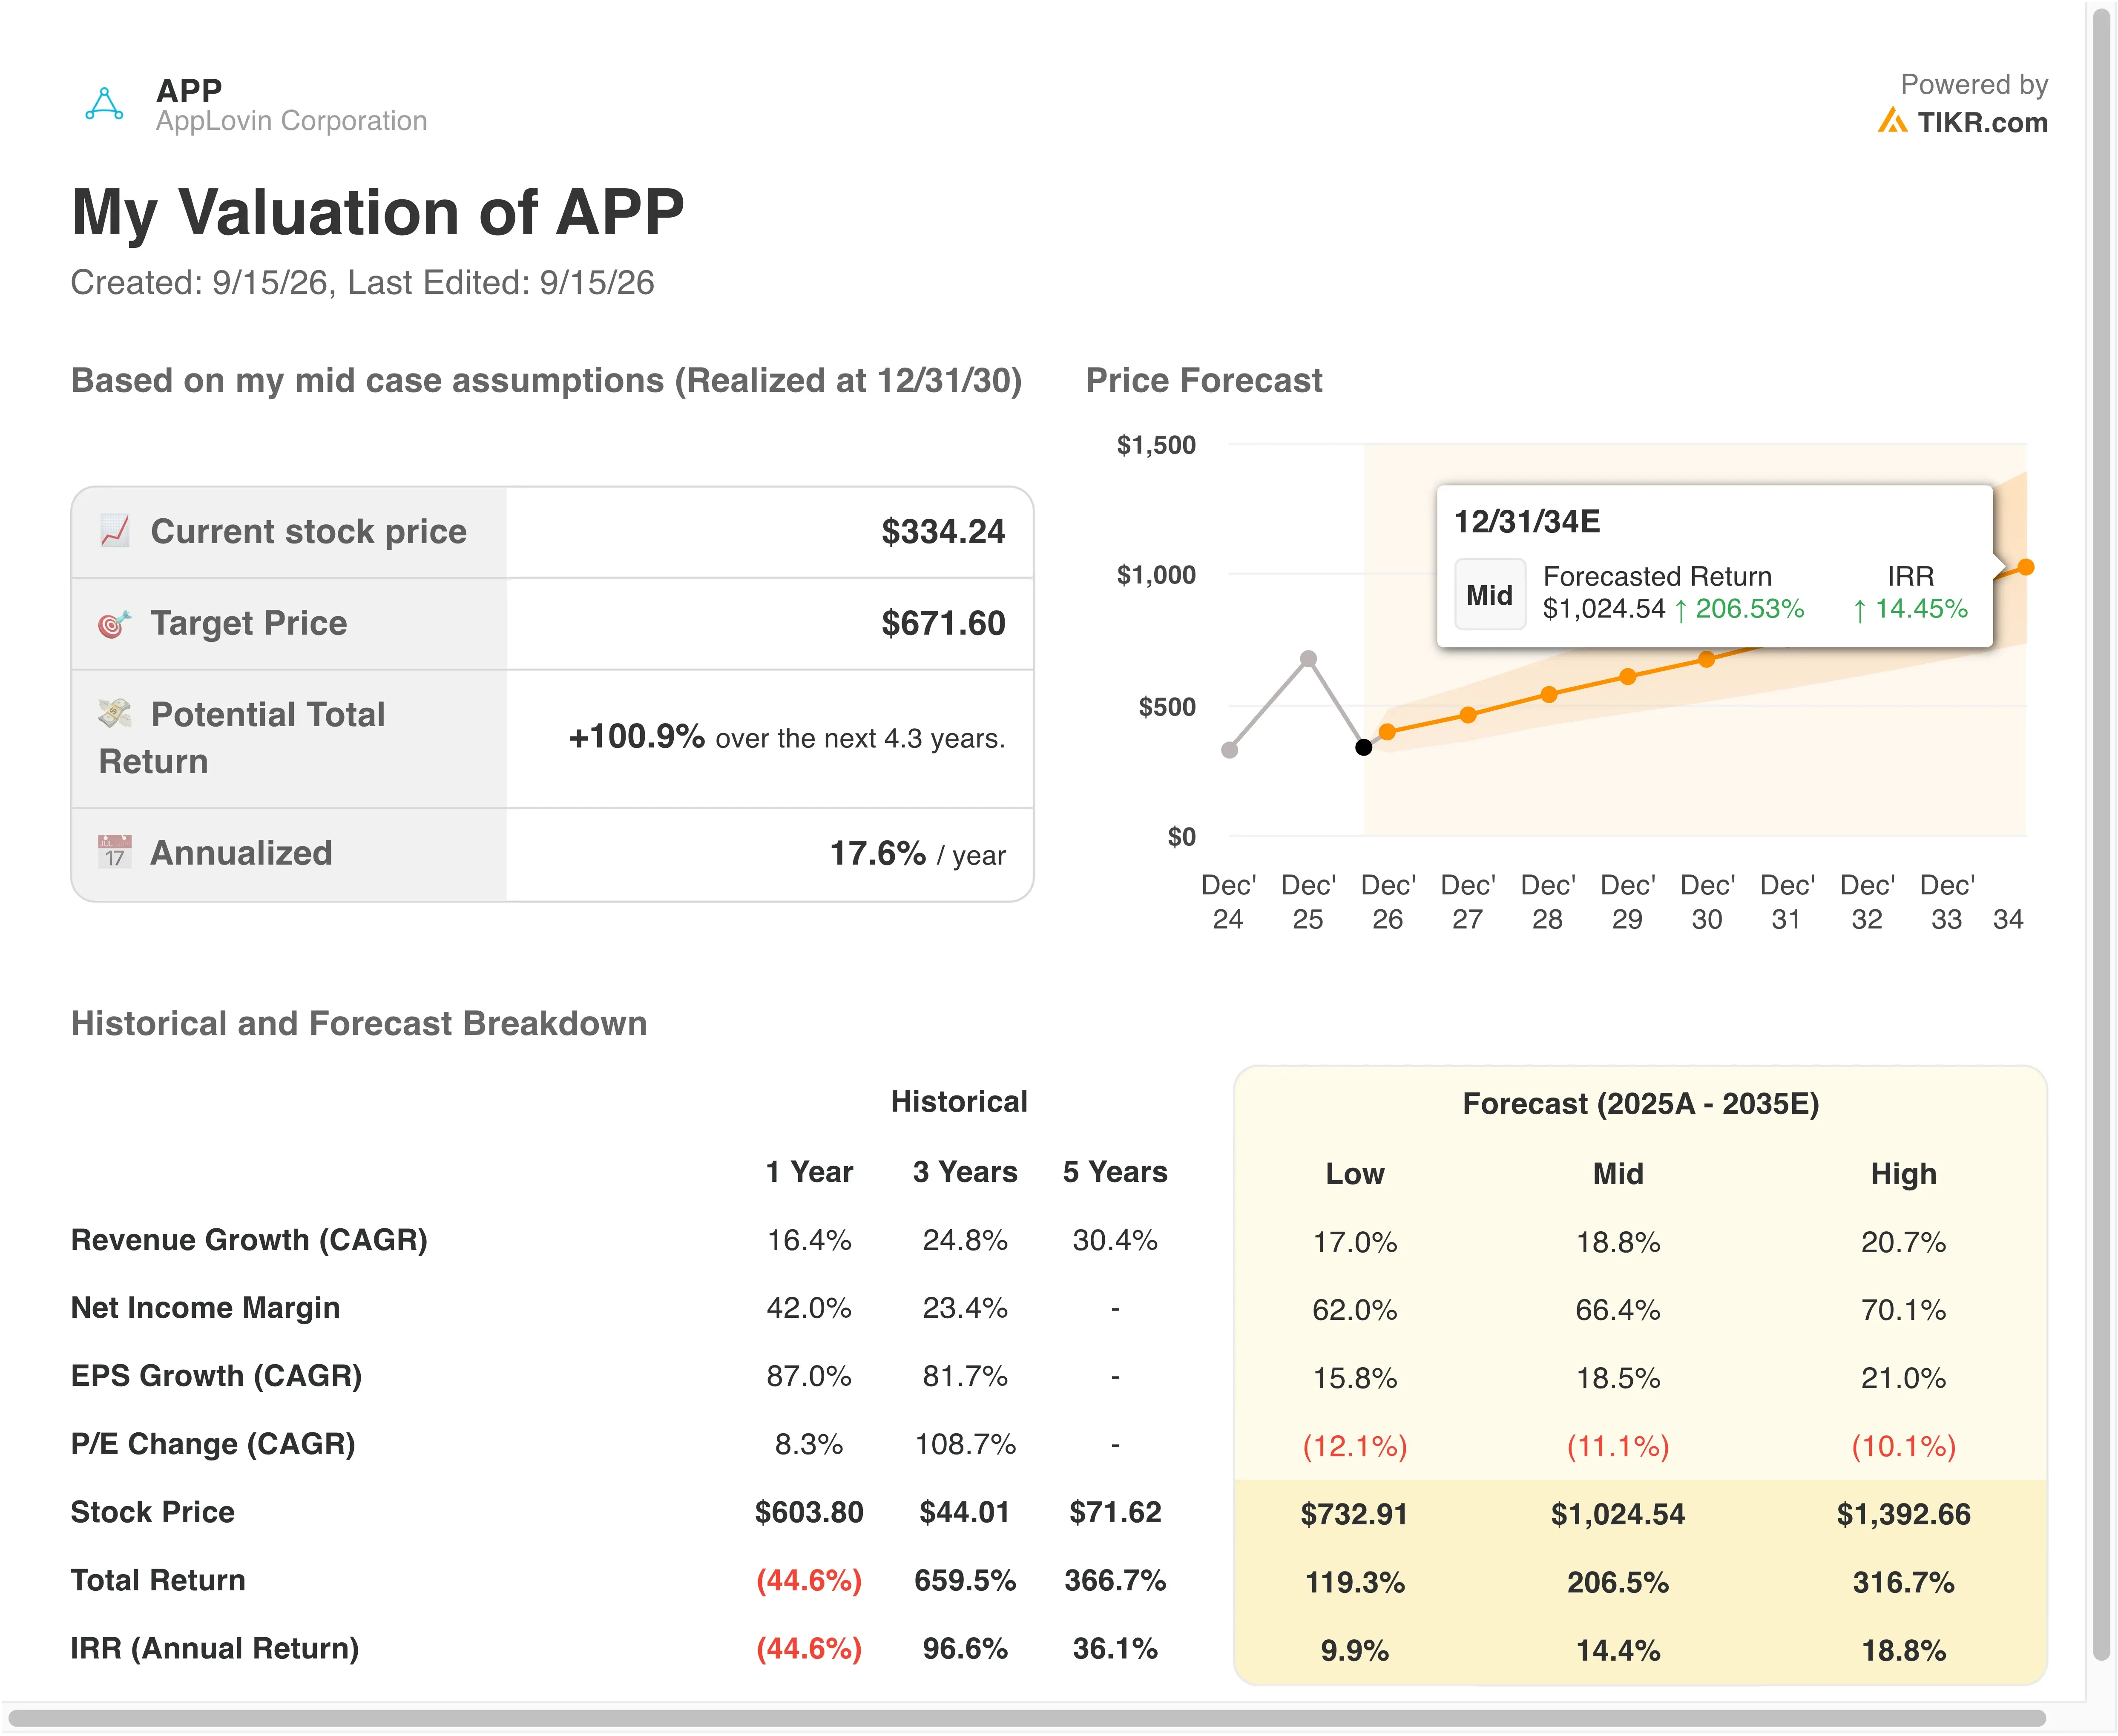
The exit multiple assumption of 17.7x is the interesting wrinkle. It sits well below AppLovin’s current earnings multiple near 26x. That suggests the model expects some multiple compression even as earnings keep growing, a reasonable assumption after a year this volatile.
Compared with its own three-year revenue growth near 25%, current assumptions look achievable rather than aggressive. The bigger question is whether AppLovin’s newer consumer advertising business, still small next to its core gaming platform, can scale fast enough once gaming comparisons get tougher.
Compare AppLovin’s forward multiple against its own recent history (Free with TIKR) >>>
The Ad Tech Pecking Order: Where AppLovin Fits
AppLovin’s closest comparison is The Trade Desk (TTD), another ad tech platform built around programmatic auctions. The Trade Desk trades at a lower revenue multiple than AppLovin but also posts slower growth, since revenue increases there typically run in the low double digits versus AppLovin’s 53% pace last quarter.
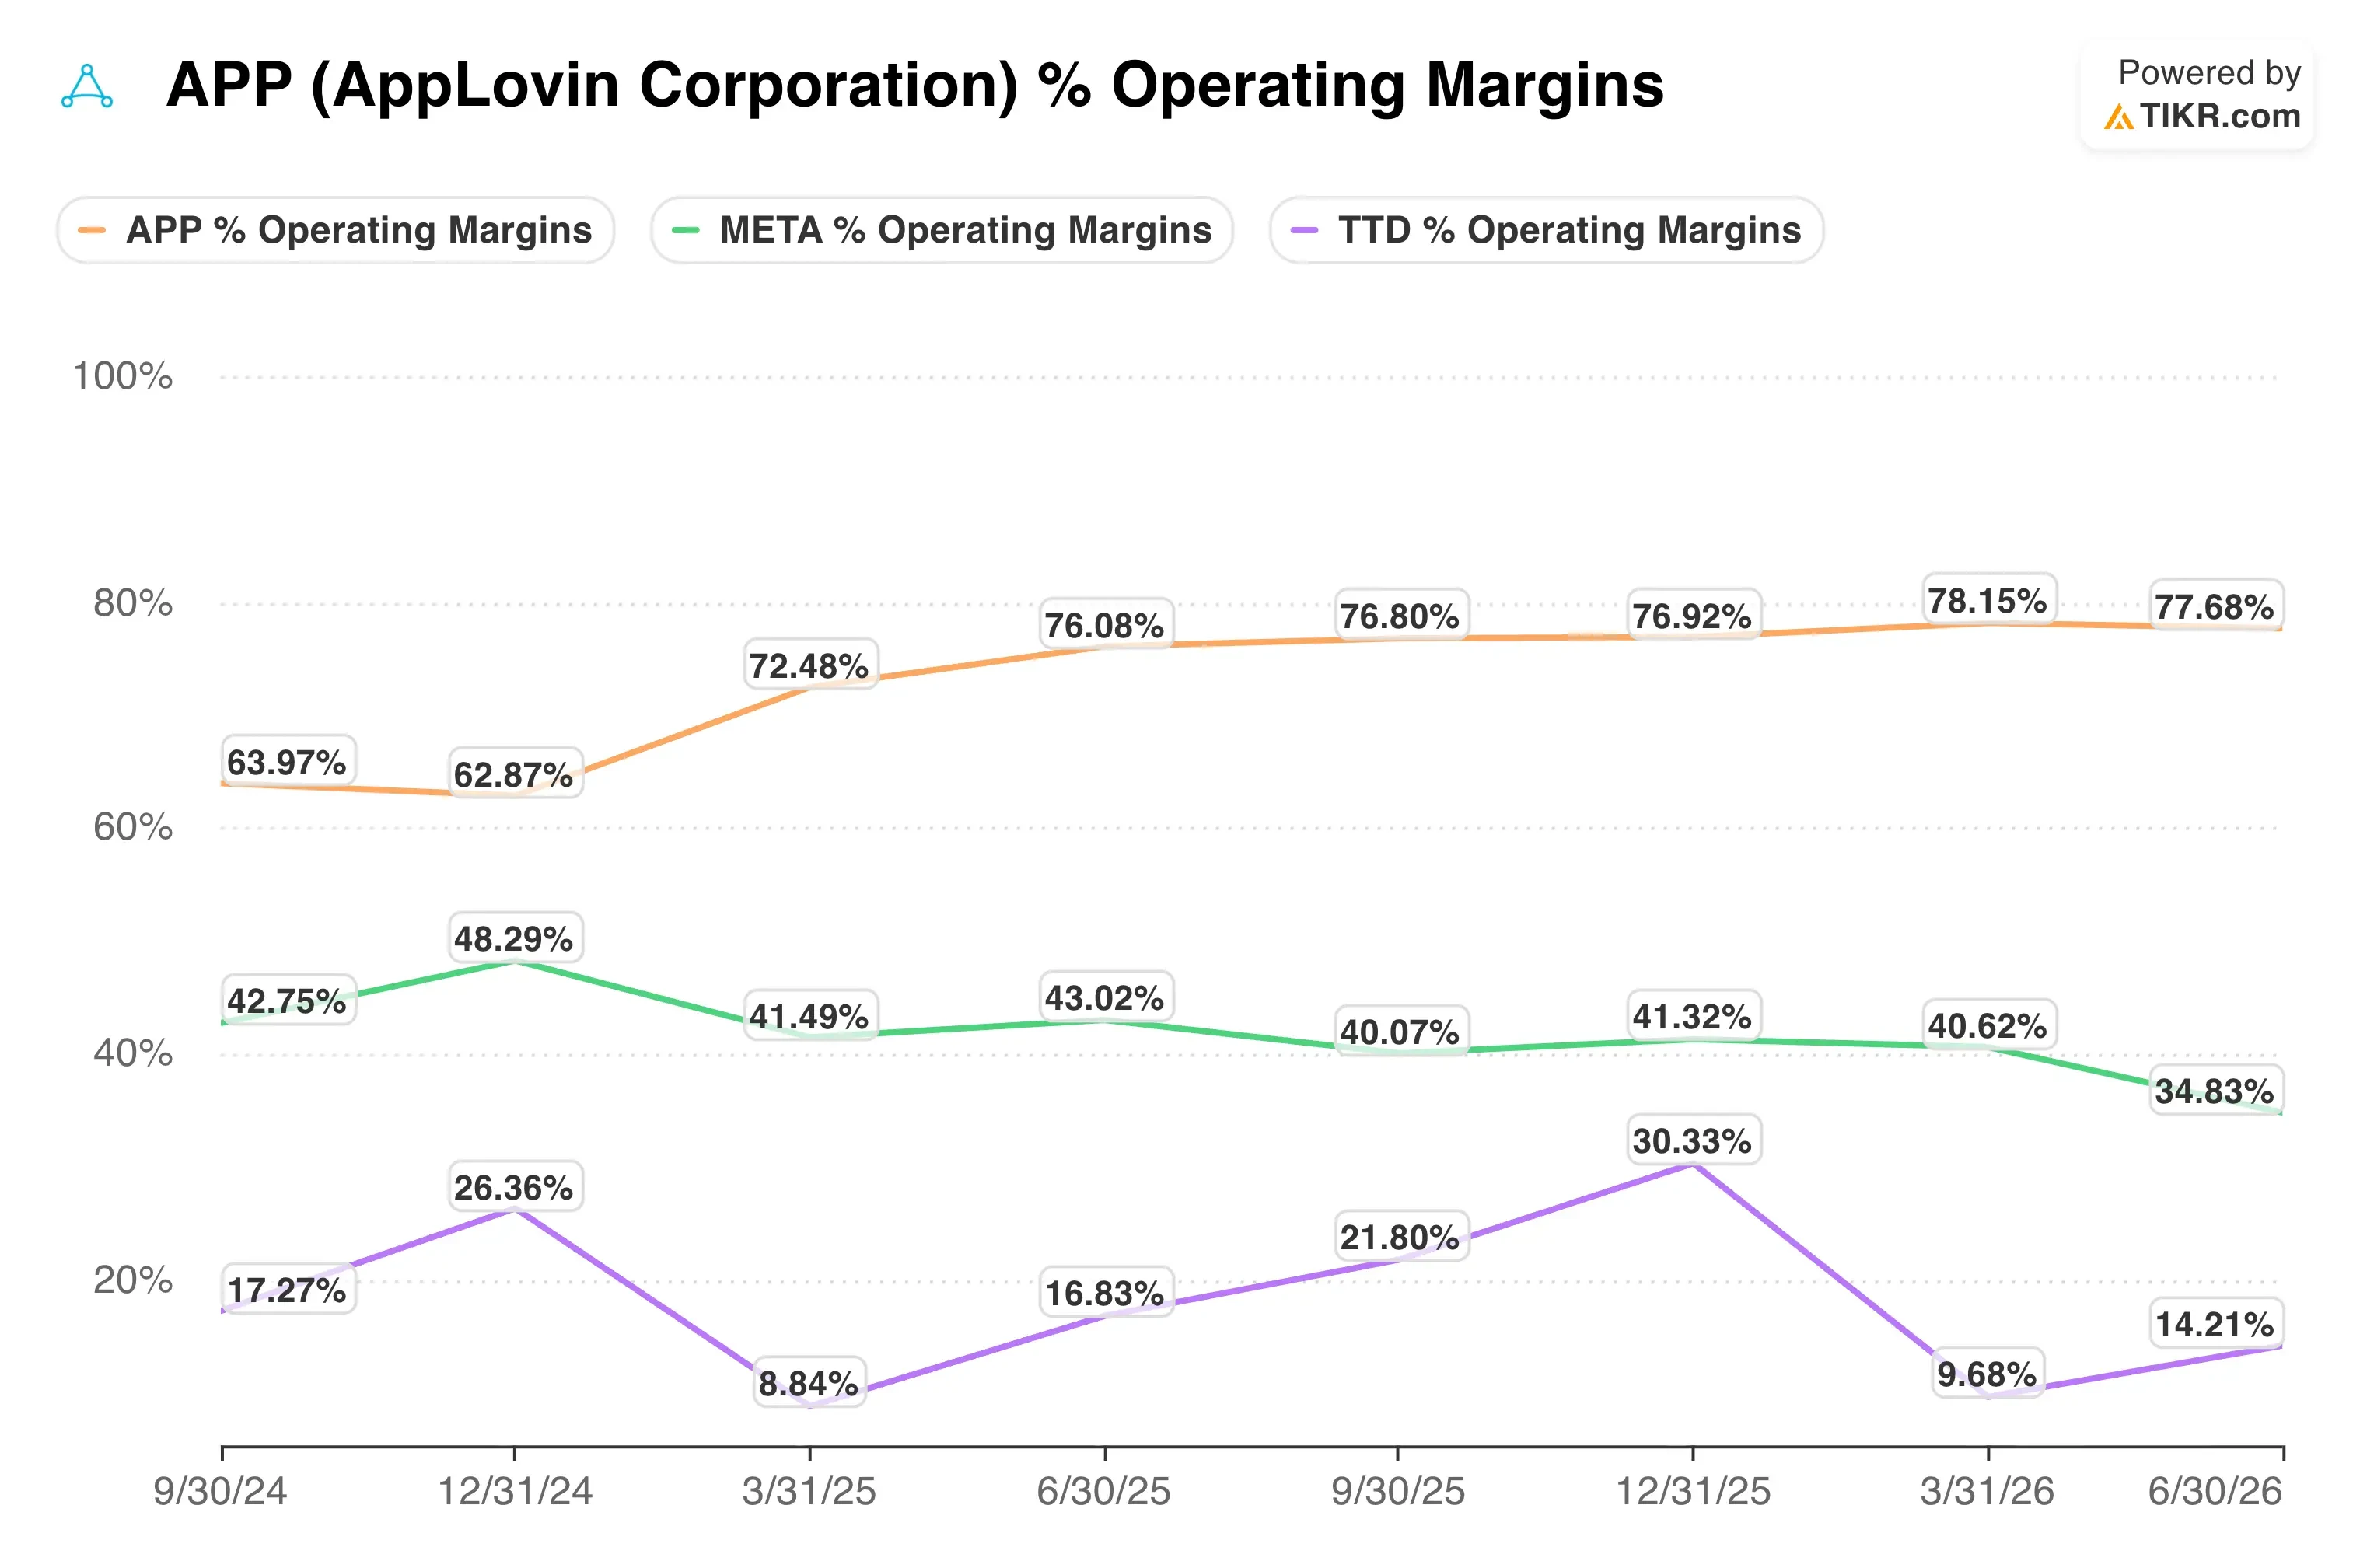
Meta Platforms (META) offers a different comparison, since it also monetizes app install and engagement advertising at massive scale. Meta’s operating margin sits closer to 40%, well below AppLovin’s 77%. Yet Meta’s revenue base is roughly 25 times larger, giving it far more diversification across ad formats and geographies.
AppLovin’s edge is its AI model, which optimizes gaming and, increasingly, e-commerce ad spend without the overhead of a broader social platform. That focus is what’s let margins run so far ahead of larger peers.
What’s Driving APP Stock Going Forward?
Q3 earnings, expected around early November, will be the next real test of whether this week’s rebound has legs. Guidance already bakes in the model improvements that landed after Q2 closed. So a clean beat would help rebuild confidence after August’s stumble.
The consumer advertising business remains the biggest long-term swing factor. Management has said advertiser budgets typically take 12 to 24 months to compound as new partners ramp spending. That means near-term consumer revenue is still a small piece of the overall mix.
Higher AI training and compute costs are a real headwind to watch, since every added dollar needs to show up in revenue to justify itself. Management has said it won’t hold back on compute spending if it produces a measurable uplift.
Estimate a company’s fair value instantly (Free with TIKR) >>>
Should You Invest in AppLovin?
The only way to really know is to look at the numbers yourself. TIKR gives you free access to the same institutional-quality financial data that professional analysts use to answer exactly that question.
Pull up APP, and you’ll see years of historical financials, what Wall Street analysts expect for revenue and earnings in the quarters ahead, how valuation multiples have moved over time, and whether price targets are trending up or down.
You can build a free watchlist to track APP alongside every other stock on your radar. No credit card required. Just the data you need to decide for yourself.
Analyze APP stock on TIKR Free→
Disclaimer:
Please note that the articles on TIKR are not intended to serve as investment or financial advice from TIKR or our content team, nor are they recommendations to buy or sell any stocks. We create our content based on TIKR Terminal’s investment data and analysts’ estimates. Our analysis might not include recent company news or important updates. TIKR has no position in any stocks mentioned. Thank you for reading, and happy investing!